
Key Insights
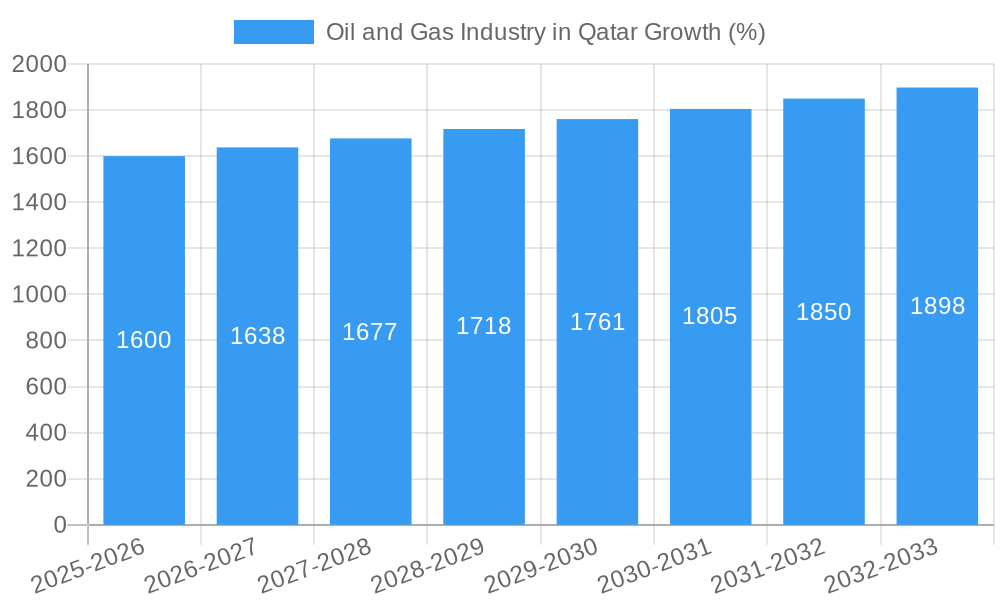
The Qatari oil and gas market, a cornerstone of the nation's economy, exhibits robust growth potential, driven by substantial reserves, strategic geographical location, and government investments in infrastructure development. The market, valued at approximately $50 billion in 2025 (estimated based on a global average and regional comparisons), is projected to experience a Compound Annual Growth Rate (CAGR) exceeding 3.20% through 2033. This growth is fueled by increasing global energy demand, particularly in Asia, and Qatar's expansion of liquefied natural gas (LNG) production and export capacity. Significant investments in upstream exploration and production, coupled with midstream infrastructure enhancements like pipelines and LNG terminals, further contribute to market expansion. The downstream sector, encompassing refining, petrochemicals, and distribution, also presents significant opportunities, particularly in supporting industrial growth within Qatar and meeting regional demand. The residential and commercial sectors are smaller segments but will see growth alongside the overall market expansion, particularly driven by construction and economic development projects.
The market's growth is, however, subject to certain constraints. Global shifts towards renewable energy sources present a long-term challenge, demanding adaptation and diversification strategies for Qatar's oil and gas sector. Price volatility in the global energy market also poses a risk, impacting profitability and investment decisions. Furthermore, environmental regulations and concerns regarding carbon emissions are influencing operational practices and investment priorities, prompting increased focus on sustainability initiatives within the industry. Despite these challenges, Qatar's commitment to its LNG expansion projects and strategic partnerships suggest a continued positive outlook for the oil and gas sector, albeit one requiring careful navigation of global energy transitions and environmental considerations. The dominance of state-owned entities like Qatar Petroleum also shapes the market dynamics, influencing investment patterns and competitiveness.

Oil and Gas Industry in Qatar: A Comprehensive Market Report (2019-2033)
This in-depth report provides a comprehensive analysis of the Oil and Gas industry in Qatar, covering the period from 2019 to 2033. It offers invaluable insights into market dynamics, competitive landscapes, and future growth potential, making it an essential resource for industry stakeholders, investors, and strategic decision-makers. The report leverages extensive primary and secondary research to deliver actionable intelligence and forecast data. Key segments, including upstream, midstream, and downstream operations, are meticulously examined, alongside application analysis across industrial, commercial, and residential sectors. The report incorporates high-impact keywords to ensure maximum search visibility and engagement, including "Qatar Oil and Gas Market," "Qatar Energy Sector," "Upstream Oil and Gas Qatar," "Midstream Oil and Gas Qatar," "Downstream Oil and Gas Qatar," "Qatar Petroleum," "ExxonMobil Qatar," "TotalEnergies Qatar," and more.
Oil and Gas Industry in Qatar Market Concentration & Innovation
The Qatari oil and gas market exhibits a high degree of concentration, with a few dominant players holding significant market share. Qatar Petroleum, Qatar Petroleum, ExxonMobil Corporation, ExxonMobil Corporation, TotalEnergies SE, TotalEnergies SE, ConocoPhillips Company, ConocoPhillips Company, and Qatargas Operating Company Limited significantly shape market dynamics. Market share data for 2024 estimates Qatar Petroleum holding approximately xx%, followed by ExxonMobil at xx%, TotalEnergies at xx%, ConocoPhillips at xx%, and Qatargas at xx%. These figures are subject to change based on future production and market conditions.
Innovation in the Qatari oil and gas sector is driven by the need for enhanced efficiency, cost reduction, and environmental sustainability. The regulatory framework, while supportive of industry growth, also emphasizes environmental protection and safety standards. Product substitutes, such as renewable energy sources, pose a long-term challenge, although their current market penetration remains limited. End-user trends indicate a growing demand for cleaner energy solutions, pushing companies towards exploring and investing in carbon capture and storage technologies. Recent M&A activities in the sector, while not as frequent as in other regions, have primarily focused on strategic partnerships and asset acquisitions to consolidate operations and optimize resources. The total value of M&A deals within the period 2019-2024 is estimated at $xx Million.
Oil and Gas Industry in Qatar Industry Trends & Insights
The Qatari oil and gas market experienced a CAGR of xx% during the historical period (2019-2024) and is projected to maintain a CAGR of xx% during the forecast period (2025-2033). Several factors contribute to this growth. Firstly, Qatar's substantial hydrocarbon reserves and its strategic geographic location provide a strong foundation for continued expansion. Secondly, significant investments in infrastructure development, particularly in liquefied natural gas (LNG) production and export facilities, are boosting capacity and fueling market growth. Thirdly, government initiatives promoting energy diversification and technological innovation contribute to an improved investment climate.
Technological advancements are revolutionizing operations, leading to increased efficiency and reduced environmental impact. The adoption of digital technologies, such as artificial intelligence (AI) and machine learning (ML), in exploration, production, and refining processes is enhancing operational efficiency. Increased automation and remote operations are also optimizing safety and production parameters. Consumer preference for cleaner energy presents both a challenge and an opportunity, prompting the sector to actively invest in carbon capture and storage (CCS) technologies and explore alternative energy sources. Competitive dynamics are shaped by the dominance of major international and national players, with a focus on securing long-term contracts and expanding market share both domestically and internationally. Market penetration of LNG in the global market has exceeded xx% and this figure is projected to reach xx% by 2033.
Dominant Markets & Segments in Oil and Gas Industry in Qatar
The Upstream segment currently dominates the Qatari oil and gas market, driven by the country's vast reserves of natural gas and crude oil. This dominance is expected to continue throughout the forecast period.
- Key Drivers for Upstream Dominance:
- Abundant natural gas and oil reserves.
- Significant investments in exploration and production.
- Government support for hydrocarbon exploration.
- Strategic partnerships with international energy companies.
The industrial sector is the largest consumer of oil and gas in Qatar, followed by the commercial and then residential sectors. This reflects the significant industrial activity within the nation, particularly in petrochemicals and related industries. The significant infrastructure development supporting industrial needs further consolidates the dominance of this sector. Residential and commercial sectors' demand is projected to rise at a steady pace in line with population growth and economic expansion.
Oil and Gas Industry in Qatar Product Developments
Recent product developments focus on enhancing the efficiency and sustainability of oil and gas production and processing. This includes advancements in LNG technology to increase production capacity and reduce emissions. Technological trends are pushing towards the adoption of smart technologies to enhance efficiency, safety, and environmental performance. New products emphasize environmentally friendly aspects, fitting the growing demand for cleaner energy solutions in global markets. This focus on sustainability offers significant competitive advantages, attracting environmentally conscious investors and clients.
Report Scope & Segmentation Analysis
This report segments the Qatari oil and gas market across three key areas: Upstream, Midstream, and Downstream.
Upstream: Focuses on exploration, drilling, and production of crude oil and natural gas. The upstream segment is expected to maintain robust growth, driven by continued investment in new projects. Market size in 2025 is estimated at $xx Million.
Midstream: Covers the transportation, storage, and processing of oil and gas. This segment is crucial for efficiently delivering hydrocarbons to domestic and international markets. Market size is projected at $xx Million in 2025.
Downstream: Includes refining, petrochemicals, and marketing of petroleum products. This segment is experiencing significant growth due to expanding industrial and commercial activities in Qatar. The market size in 2025 is estimated at $xx Million.
The report further segments the market by application: Industrial, Commercial, and Residential. Growth projections for each segment reflect the varied demands of each sector and reflect economic growth forecasts for the nation.
Key Drivers of Oil and Gas Industry in Qatar Growth
Several key factors contribute to the growth of the Qatari oil and gas industry. Firstly, the nation's vast hydrocarbon reserves provide a robust foundation for sustained production. Secondly, government policies supporting energy sector development and foreign investment foster growth. Technological advancements, especially in LNG production and processing, enhance efficiency and increase export capacity. Finally, the strategic geographic location of Qatar enables it to serve both regional and global markets effectively.
Challenges in the Oil and Gas Industry in Qatar Sector
The Qatari oil and gas sector faces challenges, including the volatility of global oil and gas prices, which impacts revenue and investment decisions. Environmental concerns and increasing pressure to reduce greenhouse gas emissions present another significant hurdle. Competition from alternative energy sources and the need for continuous technological innovation also add complexity. These factors create uncertainty, making long-term planning and investment decisions more challenging. The fluctuating geopolitical climate also presents occasional operational challenges and uncertainty in international markets.
Emerging Opportunities in Oil and Gas Industry in Qatar
Significant opportunities exist for growth and innovation in Qatar's oil and gas sector. The development of new LNG export projects offers potential for increased revenue and market share. Investing in CCS technologies can help reduce environmental impact and align with global sustainability goals. Exploration of unconventional resources and technological innovation can enhance productivity and cost-effectiveness. Expanding into new markets, both regional and international, can further drive growth.
Leading Players in the Oil and Gas Industry in Qatar Market
- Exxon Mobil Corporation
- TotalEnergies SE
- Qatargas Operating Company Limited
- ConocoPhillips Company
- Qatar Petroleum
Key Developments in Oil and Gas Industry in Qatar Industry
- 2022: Launch of a major new LNG export project.
- 2023: Significant investment in carbon capture technologies announced by Qatar Petroleum.
- 2024: Partnership established between Qatar Petroleum and a leading international energy company for offshore exploration.
Strategic Outlook for Oil and Gas Industry in Qatar Market
The Qatari oil and gas industry is poised for continued growth, driven by its significant reserves, strategic location, and government support. The focus on sustainability and technological innovation will be crucial in navigating the challenges posed by global market trends and environmental concerns. Future opportunities lie in expanding LNG exports, developing new energy projects, and leveraging technological advancements to enhance efficiency and environmental performance. The ongoing investments in infrastructure development and the government's strategic focus on energy sector diversification contribute to a positive outlook for the industry.
Oil and Gas Industry in Qatar Segmentation
- 1. Upstream
- 2. Midstream
- 3. Downstream
Oil and Gas Industry in Qatar Segmentation By Geography
-
1. North America
- 1.1. United States
- 1.2. Canada
- 1.3. Mexico
-
2. South America
- 2.1. Brazil
- 2.2. Argentina
- 2.3. Rest of South America
-
3. Europe
- 3.1. United Kingdom
- 3.2. Germany
- 3.3. France
- 3.4. Italy
- 3.5. Spain
- 3.6. Russia
- 3.7. Benelux
- 3.8. Nordics
- 3.9. Rest of Europe
-
4. Middle East & Africa
- 4.1. Turkey
- 4.2. Israel
- 4.3. GCC
- 4.4. North Africa
- 4.5. South Africa
- 4.6. Rest of Middle East & Africa
-
5. Asia Pacific
- 5.1. China
- 5.2. India
- 5.3. Japan
- 5.4. South Korea
- 5.5. ASEAN
- 5.6. Oceania
- 5.7. Rest of Asia Pacific
Oil and Gas Industry in Qatar REPORT HIGHLIGHTS
| Aspects | Details |
|---|---|
| Study Period | 2019-2033 |
| Base Year | 2024 |
| Estimated Year | 2025 |
| Forecast Period | 2025-2033 |
| Historical Period | 2019-2024 |
| Growth Rate | CAGR of > 3.20% from 2019-2033 |
| Segmentation |
|
Table of Contents
- 1. Introduction
- 1.1. Research Scope
- 1.2. Market Segmentation
- 1.3. Research Methodology
- 1.4. Definitions and Assumptions
- 2. Executive Summary
- 2.1. Introduction
- 3. Market Dynamics
- 3.1. Introduction
- 3.2. Market Drivers
- 3.2.1. Drivers; Restraints
- 3.3. Market Restrains
- 3.3.1. 4.; Political Instability and Militant Attacks on Pipeline Infrastructure
- 3.4. Market Trends
- 3.4.1. Upstream Segment to Dominate the Market
- 4. Market Factor Analysis
- 4.1. Porters Five Forces
- 4.2. Supply/Value Chain
- 4.3. PESTEL analysis
- 4.4. Market Entropy
- 4.5. Patent/Trademark Analysis
- 5. Global Oil and Gas Industry in Qatar Analysis, Insights and Forecast, 2019-2031
- 5.1. Market Analysis, Insights and Forecast - by Upstream
- 5.2. Market Analysis, Insights and Forecast - by Midstream
- 5.3. Market Analysis, Insights and Forecast - by Downstream
- 5.4. Market Analysis, Insights and Forecast - by Region
- 5.4.1. North America
- 5.4.2. South America
- 5.4.3. Europe
- 5.4.4. Middle East & Africa
- 5.4.5. Asia Pacific
- 5.1. Market Analysis, Insights and Forecast - by Upstream
- 6. North America Oil and Gas Industry in Qatar Analysis, Insights and Forecast, 2019-2031
- 6.1. Market Analysis, Insights and Forecast - by Upstream
- 6.2. Market Analysis, Insights and Forecast - by Midstream
- 6.3. Market Analysis, Insights and Forecast - by Downstream
- 6.1. Market Analysis, Insights and Forecast - by Upstream
- 7. South America Oil and Gas Industry in Qatar Analysis, Insights and Forecast, 2019-2031
- 7.1. Market Analysis, Insights and Forecast - by Upstream
- 7.2. Market Analysis, Insights and Forecast - by Midstream
- 7.3. Market Analysis, Insights and Forecast - by Downstream
- 7.1. Market Analysis, Insights and Forecast - by Upstream
- 8. Europe Oil and Gas Industry in Qatar Analysis, Insights and Forecast, 2019-2031
- 8.1. Market Analysis, Insights and Forecast - by Upstream
- 8.2. Market Analysis, Insights and Forecast - by Midstream
- 8.3. Market Analysis, Insights and Forecast - by Downstream
- 8.1. Market Analysis, Insights and Forecast - by Upstream
- 9. Middle East & Africa Oil and Gas Industry in Qatar Analysis, Insights and Forecast, 2019-2031
- 9.1. Market Analysis, Insights and Forecast - by Upstream
- 9.2. Market Analysis, Insights and Forecast - by Midstream
- 9.3. Market Analysis, Insights and Forecast - by Downstream
- 9.1. Market Analysis, Insights and Forecast - by Upstream
- 10. Asia Pacific Oil and Gas Industry in Qatar Analysis, Insights and Forecast, 2019-2031
- 10.1. Market Analysis, Insights and Forecast - by Upstream
- 10.2. Market Analysis, Insights and Forecast - by Midstream
- 10.3. Market Analysis, Insights and Forecast - by Downstream
- 10.1. Market Analysis, Insights and Forecast - by Upstream
- 11. UAE Oil and Gas Industry in Qatar Analysis, Insights and Forecast, 2019-2031
- 12. South Africa Oil and Gas Industry in Qatar Analysis, Insights and Forecast, 2019-2031
- 13. Saudi Arabia Oil and Gas Industry in Qatar Analysis, Insights and Forecast, 2019-2031
- 14. Rest of MEA Oil and Gas Industry in Qatar Analysis, Insights and Forecast, 2019-2031
- 15. Competitive Analysis
- 15.1. Global Market Share Analysis 2024
- 15.2. Company Profiles
- 15.2.1 Exxon Mobil Corporation
- 15.2.1.1. Overview
- 15.2.1.2. Products
- 15.2.1.3. SWOT Analysis
- 15.2.1.4. Recent Developments
- 15.2.1.5. Financials (Based on Availability)
- 15.2.2 TotalEnergies SE
- 15.2.2.1. Overview
- 15.2.2.2. Products
- 15.2.2.3. SWOT Analysis
- 15.2.2.4. Recent Developments
- 15.2.2.5. Financials (Based on Availability)
- 15.2.3 Qatargas Operating Company Limited
- 15.2.3.1. Overview
- 15.2.3.2. Products
- 15.2.3.3. SWOT Analysis
- 15.2.3.4. Recent Developments
- 15.2.3.5. Financials (Based on Availability)
- 15.2.4 ConocoPhillips Company
- 15.2.4.1. Overview
- 15.2.4.2. Products
- 15.2.4.3. SWOT Analysis
- 15.2.4.4. Recent Developments
- 15.2.4.5. Financials (Based on Availability)
- 15.2.5 Qatar Petroleum
- 15.2.5.1. Overview
- 15.2.5.2. Products
- 15.2.5.3. SWOT Analysis
- 15.2.5.4. Recent Developments
- 15.2.5.5. Financials (Based on Availability)
- 15.2.1 Exxon Mobil Corporation
List of Figures
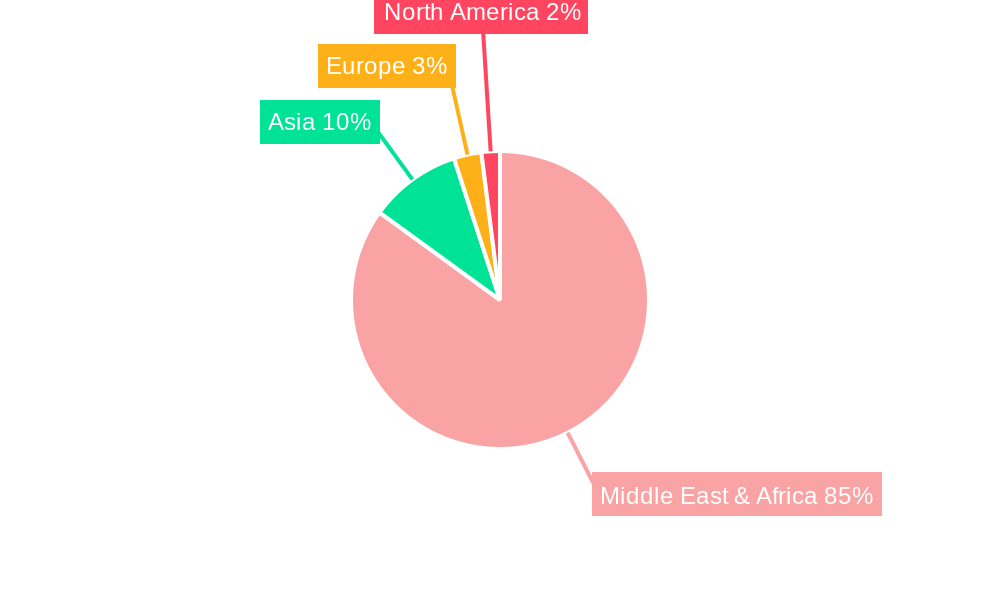
- Figure 1: Global Oil and Gas Industry in Qatar Revenue Breakdown (Million, %) by Region 2024 & 2032
- Figure 2: Global Oil and Gas Industry in Qatar Volume Breakdown (Tonnes, %) by Region 2024 & 2032
- Figure 3: Middle East & Africa Oil and Gas Industry in Qatar Revenue (Million), by Country 2024 & 2032
- Figure 4: Middle East & Africa Oil and Gas Industry in Qatar Volume (Tonnes), by Country 2024 & 2032
- Figure 5: Middle East & Africa Oil and Gas Industry in Qatar Revenue Share (%), by Country 2024 & 2032
- Figure 6: Middle East & Africa Oil and Gas Industry in Qatar Volume Share (%), by Country 2024 & 2032
- Figure 7: North America Oil and Gas Industry in Qatar Revenue (Million), by Upstream 2024 & 2032
- Figure 8: North America Oil and Gas Industry in Qatar Volume (Tonnes), by Upstream 2024 & 2032
- Figure 9: North America Oil and Gas Industry in Qatar Revenue Share (%), by Upstream 2024 & 2032
- Figure 10: North America Oil and Gas Industry in Qatar Volume Share (%), by Upstream 2024 & 2032
- Figure 11: North America Oil and Gas Industry in Qatar Revenue (Million), by Midstream 2024 & 2032
- Figure 12: North America Oil and Gas Industry in Qatar Volume (Tonnes), by Midstream 2024 & 2032
- Figure 13: North America Oil and Gas Industry in Qatar Revenue Share (%), by Midstream 2024 & 2032
- Figure 14: North America Oil and Gas Industry in Qatar Volume Share (%), by Midstream 2024 & 2032
- Figure 15: North America Oil and Gas Industry in Qatar Revenue (Million), by Downstream 2024 & 2032
- Figure 16: North America Oil and Gas Industry in Qatar Volume (Tonnes), by Downstream 2024 & 2032
- Figure 17: North America Oil and Gas Industry in Qatar Revenue Share (%), by Downstream 2024 & 2032
- Figure 18: North America Oil and Gas Industry in Qatar Volume Share (%), by Downstream 2024 & 2032
- Figure 19: North America Oil and Gas Industry in Qatar Revenue (Million), by Country 2024 & 2032
- Figure 20: North America Oil and Gas Industry in Qatar Volume (Tonnes), by Country 2024 & 2032
- Figure 21: North America Oil and Gas Industry in Qatar Revenue Share (%), by Country 2024 & 2032
- Figure 22: North America Oil and Gas Industry in Qatar Volume Share (%), by Country 2024 & 2032
- Figure 23: South America Oil and Gas Industry in Qatar Revenue (Million), by Upstream 2024 & 2032
- Figure 24: South America Oil and Gas Industry in Qatar Volume (Tonnes), by Upstream 2024 & 2032
- Figure 25: South America Oil and Gas Industry in Qatar Revenue Share (%), by Upstream 2024 & 2032
- Figure 26: South America Oil and Gas Industry in Qatar Volume Share (%), by Upstream 2024 & 2032
- Figure 27: South America Oil and Gas Industry in Qatar Revenue (Million), by Midstream 2024 & 2032
- Figure 28: South America Oil and Gas Industry in Qatar Volume (Tonnes), by Midstream 2024 & 2032
- Figure 29: South America Oil and Gas Industry in Qatar Revenue Share (%), by Midstream 2024 & 2032
- Figure 30: South America Oil and Gas Industry in Qatar Volume Share (%), by Midstream 2024 & 2032
- Figure 31: South America Oil and Gas Industry in Qatar Revenue (Million), by Downstream 2024 & 2032
- Figure 32: South America Oil and Gas Industry in Qatar Volume (Tonnes), by Downstream 2024 & 2032
- Figure 33: South America Oil and Gas Industry in Qatar Revenue Share (%), by Downstream 2024 & 2032
- Figure 34: South America Oil and Gas Industry in Qatar Volume Share (%), by Downstream 2024 & 2032
- Figure 35: South America Oil and Gas Industry in Qatar Revenue (Million), by Country 2024 & 2032
- Figure 36: South America Oil and Gas Industry in Qatar Volume (Tonnes), by Country 2024 & 2032
- Figure 37: South America Oil and Gas Industry in Qatar Revenue Share (%), by Country 2024 & 2032
- Figure 38: South America Oil and Gas Industry in Qatar Volume Share (%), by Country 2024 & 2032
- Figure 39: Europe Oil and Gas Industry in Qatar Revenue (Million), by Upstream 2024 & 2032
- Figure 40: Europe Oil and Gas Industry in Qatar Volume (Tonnes), by Upstream 2024 & 2032
- Figure 41: Europe Oil and Gas Industry in Qatar Revenue Share (%), by Upstream 2024 & 2032
- Figure 42: Europe Oil and Gas Industry in Qatar Volume Share (%), by Upstream 2024 & 2032
- Figure 43: Europe Oil and Gas Industry in Qatar Revenue (Million), by Midstream 2024 & 2032
- Figure 44: Europe Oil and Gas Industry in Qatar Volume (Tonnes), by Midstream 2024 & 2032
- Figure 45: Europe Oil and Gas Industry in Qatar Revenue Share (%), by Midstream 2024 & 2032
- Figure 46: Europe Oil and Gas Industry in Qatar Volume Share (%), by Midstream 2024 & 2032
- Figure 47: Europe Oil and Gas Industry in Qatar Revenue (Million), by Downstream 2024 & 2032
- Figure 48: Europe Oil and Gas Industry in Qatar Volume (Tonnes), by Downstream 2024 & 2032
- Figure 49: Europe Oil and Gas Industry in Qatar Revenue Share (%), by Downstream 2024 & 2032
- Figure 50: Europe Oil and Gas Industry in Qatar Volume Share (%), by Downstream 2024 & 2032
- Figure 51: Europe Oil and Gas Industry in Qatar Revenue (Million), by Country 2024 & 2032
- Figure 52: Europe Oil and Gas Industry in Qatar Volume (Tonnes), by Country 2024 & 2032
- Figure 53: Europe Oil and Gas Industry in Qatar Revenue Share (%), by Country 2024 & 2032
- Figure 54: Europe Oil and Gas Industry in Qatar Volume Share (%), by Country 2024 & 2032
- Figure 55: Middle East & Africa Oil and Gas Industry in Qatar Revenue (Million), by Upstream 2024 & 2032
- Figure 56: Middle East & Africa Oil and Gas Industry in Qatar Volume (Tonnes), by Upstream 2024 & 2032
- Figure 57: Middle East & Africa Oil and Gas Industry in Qatar Revenue Share (%), by Upstream 2024 & 2032
- Figure 58: Middle East & Africa Oil and Gas Industry in Qatar Volume Share (%), by Upstream 2024 & 2032
- Figure 59: Middle East & Africa Oil and Gas Industry in Qatar Revenue (Million), by Midstream 2024 & 2032
- Figure 60: Middle East & Africa Oil and Gas Industry in Qatar Volume (Tonnes), by Midstream 2024 & 2032
- Figure 61: Middle East & Africa Oil and Gas Industry in Qatar Revenue Share (%), by Midstream 2024 & 2032
- Figure 62: Middle East & Africa Oil and Gas Industry in Qatar Volume Share (%), by Midstream 2024 & 2032
- Figure 63: Middle East & Africa Oil and Gas Industry in Qatar Revenue (Million), by Downstream 2024 & 2032
- Figure 64: Middle East & Africa Oil and Gas Industry in Qatar Volume (Tonnes), by Downstream 2024 & 2032
- Figure 65: Middle East & Africa Oil and Gas Industry in Qatar Revenue Share (%), by Downstream 2024 & 2032
- Figure 66: Middle East & Africa Oil and Gas Industry in Qatar Volume Share (%), by Downstream 2024 & 2032
- Figure 67: Middle East & Africa Oil and Gas Industry in Qatar Revenue (Million), by Country 2024 & 2032
- Figure 68: Middle East & Africa Oil and Gas Industry in Qatar Volume (Tonnes), by Country 2024 & 2032
- Figure 69: Middle East & Africa Oil and Gas Industry in Qatar Revenue Share (%), by Country 2024 & 2032
- Figure 70: Middle East & Africa Oil and Gas Industry in Qatar Volume Share (%), by Country 2024 & 2032
- Figure 71: Asia Pacific Oil and Gas Industry in Qatar Revenue (Million), by Upstream 2024 & 2032
- Figure 72: Asia Pacific Oil and Gas Industry in Qatar Volume (Tonnes), by Upstream 2024 & 2032
- Figure 73: Asia Pacific Oil and Gas Industry in Qatar Revenue Share (%), by Upstream 2024 & 2032
- Figure 74: Asia Pacific Oil and Gas Industry in Qatar Volume Share (%), by Upstream 2024 & 2032
- Figure 75: Asia Pacific Oil and Gas Industry in Qatar Revenue (Million), by Midstream 2024 & 2032
- Figure 76: Asia Pacific Oil and Gas Industry in Qatar Volume (Tonnes), by Midstream 2024 & 2032
- Figure 77: Asia Pacific Oil and Gas Industry in Qatar Revenue Share (%), by Midstream 2024 & 2032
- Figure 78: Asia Pacific Oil and Gas Industry in Qatar Volume Share (%), by Midstream 2024 & 2032
- Figure 79: Asia Pacific Oil and Gas Industry in Qatar Revenue (Million), by Downstream 2024 & 2032
- Figure 80: Asia Pacific Oil and Gas Industry in Qatar Volume (Tonnes), by Downstream 2024 & 2032
- Figure 81: Asia Pacific Oil and Gas Industry in Qatar Revenue Share (%), by Downstream 2024 & 2032
- Figure 82: Asia Pacific Oil and Gas Industry in Qatar Volume Share (%), by Downstream 2024 & 2032
- Figure 83: Asia Pacific Oil and Gas Industry in Qatar Revenue (Million), by Country 2024 & 2032
- Figure 84: Asia Pacific Oil and Gas Industry in Qatar Volume (Tonnes), by Country 2024 & 2032
- Figure 85: Asia Pacific Oil and Gas Industry in Qatar Revenue Share (%), by Country 2024 & 2032
- Figure 86: Asia Pacific Oil and Gas Industry in Qatar Volume Share (%), by Country 2024 & 2032
List of Tables
- Table 1: Global Oil and Gas Industry in Qatar Revenue Million Forecast, by Region 2019 & 2032
- Table 2: Global Oil and Gas Industry in Qatar Volume Tonnes Forecast, by Region 2019 & 2032
- Table 3: Global Oil and Gas Industry in Qatar Revenue Million Forecast, by Upstream 2019 & 2032
- Table 4: Global Oil and Gas Industry in Qatar Volume Tonnes Forecast, by Upstream 2019 & 2032
- Table 5: Global Oil and Gas Industry in Qatar Revenue Million Forecast, by Midstream 2019 & 2032
- Table 6: Global Oil and Gas Industry in Qatar Volume Tonnes Forecast, by Midstream 2019 & 2032
- Table 7: Global Oil and Gas Industry in Qatar Revenue Million Forecast, by Downstream 2019 & 2032
- Table 8: Global Oil and Gas Industry in Qatar Volume Tonnes Forecast, by Downstream 2019 & 2032
- Table 9: Global Oil and Gas Industry in Qatar Revenue Million Forecast, by Region 2019 & 2032
- Table 10: Global Oil and Gas Industry in Qatar Volume Tonnes Forecast, by Region 2019 & 2032
- Table 11: Global Oil and Gas Industry in Qatar Revenue Million Forecast, by Country 2019 & 2032
- Table 12: Global Oil and Gas Industry in Qatar Volume Tonnes Forecast, by Country 2019 & 2032
- Table 13: UAE Oil and Gas Industry in Qatar Revenue (Million) Forecast, by Application 2019 & 2032
- Table 14: UAE Oil and Gas Industry in Qatar Volume (Tonnes) Forecast, by Application 2019 & 2032
- Table 15: South Africa Oil and Gas Industry in Qatar Revenue (Million) Forecast, by Application 2019 & 2032
- Table 16: South Africa Oil and Gas Industry in Qatar Volume (Tonnes) Forecast, by Application 2019 & 2032
- Table 17: Saudi Arabia Oil and Gas Industry in Qatar Revenue (Million) Forecast, by Application 2019 & 2032
- Table 18: Saudi Arabia Oil and Gas Industry in Qatar Volume (Tonnes) Forecast, by Application 2019 & 2032
- Table 19: Rest of MEA Oil and Gas Industry in Qatar Revenue (Million) Forecast, by Application 2019 & 2032
- Table 20: Rest of MEA Oil and Gas Industry in Qatar Volume (Tonnes) Forecast, by Application 2019 & 2032
- Table 21: Global Oil and Gas Industry in Qatar Revenue Million Forecast, by Upstream 2019 & 2032
- Table 22: Global Oil and Gas Industry in Qatar Volume Tonnes Forecast, by Upstream 2019 & 2032
- Table 23: Global Oil and Gas Industry in Qatar Revenue Million Forecast, by Midstream 2019 & 2032
- Table 24: Global Oil and Gas Industry in Qatar Volume Tonnes Forecast, by Midstream 2019 & 2032
- Table 25: Global Oil and Gas Industry in Qatar Revenue Million Forecast, by Downstream 2019 & 2032
- Table 26: Global Oil and Gas Industry in Qatar Volume Tonnes Forecast, by Downstream 2019 & 2032
- Table 27: Global Oil and Gas Industry in Qatar Revenue Million Forecast, by Country 2019 & 2032
- Table 28: Global Oil and Gas Industry in Qatar Volume Tonnes Forecast, by Country 2019 & 2032
- Table 29: United States Oil and Gas Industry in Qatar Revenue (Million) Forecast, by Application 2019 & 2032
- Table 30: United States Oil and Gas Industry in Qatar Volume (Tonnes) Forecast, by Application 2019 & 2032
- Table 31: Canada Oil and Gas Industry in Qatar Revenue (Million) Forecast, by Application 2019 & 2032
- Table 32: Canada Oil and Gas Industry in Qatar Volume (Tonnes) Forecast, by Application 2019 & 2032
- Table 33: Mexico Oil and Gas Industry in Qatar Revenue (Million) Forecast, by Application 2019 & 2032
- Table 34: Mexico Oil and Gas Industry in Qatar Volume (Tonnes) Forecast, by Application 2019 & 2032
- Table 35: Global Oil and Gas Industry in Qatar Revenue Million Forecast, by Upstream 2019 & 2032
- Table 36: Global Oil and Gas Industry in Qatar Volume Tonnes Forecast, by Upstream 2019 & 2032
- Table 37: Global Oil and Gas Industry in Qatar Revenue Million Forecast, by Midstream 2019 & 2032
- Table 38: Global Oil and Gas Industry in Qatar Volume Tonnes Forecast, by Midstream 2019 & 2032
- Table 39: Global Oil and Gas Industry in Qatar Revenue Million Forecast, by Downstream 2019 & 2032
- Table 40: Global Oil and Gas Industry in Qatar Volume Tonnes Forecast, by Downstream 2019 & 2032
- Table 41: Global Oil and Gas Industry in Qatar Revenue Million Forecast, by Country 2019 & 2032
- Table 42: Global Oil and Gas Industry in Qatar Volume Tonnes Forecast, by Country 2019 & 2032
- Table 43: Brazil Oil and Gas Industry in Qatar Revenue (Million) Forecast, by Application 2019 & 2032
- Table 44: Brazil Oil and Gas Industry in Qatar Volume (Tonnes) Forecast, by Application 2019 & 2032
- Table 45: Argentina Oil and Gas Industry in Qatar Revenue (Million) Forecast, by Application 2019 & 2032
- Table 46: Argentina Oil and Gas Industry in Qatar Volume (Tonnes) Forecast, by Application 2019 & 2032
- Table 47: Rest of South America Oil and Gas Industry in Qatar Revenue (Million) Forecast, by Application 2019 & 2032
- Table 48: Rest of South America Oil and Gas Industry in Qatar Volume (Tonnes) Forecast, by Application 2019 & 2032
- Table 49: Global Oil and Gas Industry in Qatar Revenue Million Forecast, by Upstream 2019 & 2032
- Table 50: Global Oil and Gas Industry in Qatar Volume Tonnes Forecast, by Upstream 2019 & 2032
- Table 51: Global Oil and Gas Industry in Qatar Revenue Million Forecast, by Midstream 2019 & 2032
- Table 52: Global Oil and Gas Industry in Qatar Volume Tonnes Forecast, by Midstream 2019 & 2032
- Table 53: Global Oil and Gas Industry in Qatar Revenue Million Forecast, by Downstream 2019 & 2032
- Table 54: Global Oil and Gas Industry in Qatar Volume Tonnes Forecast, by Downstream 2019 & 2032
- Table 55: Global Oil and Gas Industry in Qatar Revenue Million Forecast, by Country 2019 & 2032
- Table 56: Global Oil and Gas Industry in Qatar Volume Tonnes Forecast, by Country 2019 & 2032
- Table 57: United Kingdom Oil and Gas Industry in Qatar Revenue (Million) Forecast, by Application 2019 & 2032
- Table 58: United Kingdom Oil and Gas Industry in Qatar Volume (Tonnes) Forecast, by Application 2019 & 2032
- Table 59: Germany Oil and Gas Industry in Qatar Revenue (Million) Forecast, by Application 2019 & 2032
- Table 60: Germany Oil and Gas Industry in Qatar Volume (Tonnes) Forecast, by Application 2019 & 2032
- Table 61: France Oil and Gas Industry in Qatar Revenue (Million) Forecast, by Application 2019 & 2032
- Table 62: France Oil and Gas Industry in Qatar Volume (Tonnes) Forecast, by Application 2019 & 2032
- Table 63: Italy Oil and Gas Industry in Qatar Revenue (Million) Forecast, by Application 2019 & 2032
- Table 64: Italy Oil and Gas Industry in Qatar Volume (Tonnes) Forecast, by Application 2019 & 2032
- Table 65: Spain Oil and Gas Industry in Qatar Revenue (Million) Forecast, by Application 2019 & 2032
- Table 66: Spain Oil and Gas Industry in Qatar Volume (Tonnes) Forecast, by Application 2019 & 2032
- Table 67: Russia Oil and Gas Industry in Qatar Revenue (Million) Forecast, by Application 2019 & 2032
- Table 68: Russia Oil and Gas Industry in Qatar Volume (Tonnes) Forecast, by Application 2019 & 2032
- Table 69: Benelux Oil and Gas Industry in Qatar Revenue (Million) Forecast, by Application 2019 & 2032
- Table 70: Benelux Oil and Gas Industry in Qatar Volume (Tonnes) Forecast, by Application 2019 & 2032
- Table 71: Nordics Oil and Gas Industry in Qatar Revenue (Million) Forecast, by Application 2019 & 2032
- Table 72: Nordics Oil and Gas Industry in Qatar Volume (Tonnes) Forecast, by Application 2019 & 2032
- Table 73: Rest of Europe Oil and Gas Industry in Qatar Revenue (Million) Forecast, by Application 2019 & 2032
- Table 74: Rest of Europe Oil and Gas Industry in Qatar Volume (Tonnes) Forecast, by Application 2019 & 2032
- Table 75: Global Oil and Gas Industry in Qatar Revenue Million Forecast, by Upstream 2019 & 2032
- Table 76: Global Oil and Gas Industry in Qatar Volume Tonnes Forecast, by Upstream 2019 & 2032
- Table 77: Global Oil and Gas Industry in Qatar Revenue Million Forecast, by Midstream 2019 & 2032
- Table 78: Global Oil and Gas Industry in Qatar Volume Tonnes Forecast, by Midstream 2019 & 2032
- Table 79: Global Oil and Gas Industry in Qatar Revenue Million Forecast, by Downstream 2019 & 2032
- Table 80: Global Oil and Gas Industry in Qatar Volume Tonnes Forecast, by Downstream 2019 & 2032
- Table 81: Global Oil and Gas Industry in Qatar Revenue Million Forecast, by Country 2019 & 2032
- Table 82: Global Oil and Gas Industry in Qatar Volume Tonnes Forecast, by Country 2019 & 2032
- Table 83: Turkey Oil and Gas Industry in Qatar Revenue (Million) Forecast, by Application 2019 & 2032
- Table 84: Turkey Oil and Gas Industry in Qatar Volume (Tonnes) Forecast, by Application 2019 & 2032
- Table 85: Israel Oil and Gas Industry in Qatar Revenue (Million) Forecast, by Application 2019 & 2032
- Table 86: Israel Oil and Gas Industry in Qatar Volume (Tonnes) Forecast, by Application 2019 & 2032
- Table 87: GCC Oil and Gas Industry in Qatar Revenue (Million) Forecast, by Application 2019 & 2032
- Table 88: GCC Oil and Gas Industry in Qatar Volume (Tonnes) Forecast, by Application 2019 & 2032
- Table 89: North Africa Oil and Gas Industry in Qatar Revenue (Million) Forecast, by Application 2019 & 2032
- Table 90: North Africa Oil and Gas Industry in Qatar Volume (Tonnes) Forecast, by Application 2019 & 2032
- Table 91: South Africa Oil and Gas Industry in Qatar Revenue (Million) Forecast, by Application 2019 & 2032
- Table 92: South Africa Oil and Gas Industry in Qatar Volume (Tonnes) Forecast, by Application 2019 & 2032
- Table 93: Rest of Middle East & Africa Oil and Gas Industry in Qatar Revenue (Million) Forecast, by Application 2019 & 2032
- Table 94: Rest of Middle East & Africa Oil and Gas Industry in Qatar Volume (Tonnes) Forecast, by Application 2019 & 2032
- Table 95: Global Oil and Gas Industry in Qatar Revenue Million Forecast, by Upstream 2019 & 2032
- Table 96: Global Oil and Gas Industry in Qatar Volume Tonnes Forecast, by Upstream 2019 & 2032
- Table 97: Global Oil and Gas Industry in Qatar Revenue Million Forecast, by Midstream 2019 & 2032
- Table 98: Global Oil and Gas Industry in Qatar Volume Tonnes Forecast, by Midstream 2019 & 2032
- Table 99: Global Oil and Gas Industry in Qatar Revenue Million Forecast, by Downstream 2019 & 2032
- Table 100: Global Oil and Gas Industry in Qatar Volume Tonnes Forecast, by Downstream 2019 & 2032
- Table 101: Global Oil and Gas Industry in Qatar Revenue Million Forecast, by Country 2019 & 2032
- Table 102: Global Oil and Gas Industry in Qatar Volume Tonnes Forecast, by Country 2019 & 2032
- Table 103: China Oil and Gas Industry in Qatar Revenue (Million) Forecast, by Application 2019 & 2032
- Table 104: China Oil and Gas Industry in Qatar Volume (Tonnes) Forecast, by Application 2019 & 2032
- Table 105: India Oil and Gas Industry in Qatar Revenue (Million) Forecast, by Application 2019 & 2032
- Table 106: India Oil and Gas Industry in Qatar Volume (Tonnes) Forecast, by Application 2019 & 2032
- Table 107: Japan Oil and Gas Industry in Qatar Revenue (Million) Forecast, by Application 2019 & 2032
- Table 108: Japan Oil and Gas Industry in Qatar Volume (Tonnes) Forecast, by Application 2019 & 2032
- Table 109: South Korea Oil and Gas Industry in Qatar Revenue (Million) Forecast, by Application 2019 & 2032
- Table 110: South Korea Oil and Gas Industry in Qatar Volume (Tonnes) Forecast, by Application 2019 & 2032
- Table 111: ASEAN Oil and Gas Industry in Qatar Revenue (Million) Forecast, by Application 2019 & 2032
- Table 112: ASEAN Oil and Gas Industry in Qatar Volume (Tonnes) Forecast, by Application 2019 & 2032
- Table 113: Oceania Oil and Gas Industry in Qatar Revenue (Million) Forecast, by Application 2019 & 2032
- Table 114: Oceania Oil and Gas Industry in Qatar Volume (Tonnes) Forecast, by Application 2019 & 2032
- Table 115: Rest of Asia Pacific Oil and Gas Industry in Qatar Revenue (Million) Forecast, by Application 2019 & 2032
- Table 116: Rest of Asia Pacific Oil and Gas Industry in Qatar Volume (Tonnes) Forecast, by Application 2019 & 2032
Frequently Asked Questions
1. What is the projected Compound Annual Growth Rate (CAGR) of the Oil and Gas Industry in Qatar?
The projected CAGR is approximately > 3.20%.
2. Which companies are prominent players in the Oil and Gas Industry in Qatar?
Key companies in the market include Exxon Mobil Corporation, TotalEnergies SE, Qatargas Operating Company Limited, ConocoPhillips Company, Qatar Petroleum.
3. What are the main segments of the Oil and Gas Industry in Qatar?
The market segments include Upstream, Midstream, Downstream.
4. Can you provide details about the market size?
The market size is estimated to be USD XX Million as of 2022.
5. What are some drivers contributing to market growth?
Drivers; Restraints.
6. What are the notable trends driving market growth?
Upstream Segment to Dominate the Market.
7. Are there any restraints impacting market growth?
4.; Political Instability and Militant Attacks on Pipeline Infrastructure.
8. Can you provide examples of recent developments in the market?
N/A
9. What pricing options are available for accessing the report?
Pricing options include single-user, multi-user, and enterprise licenses priced at USD 3800, USD 4500, and USD 5800 respectively.
10. Is the market size provided in terms of value or volume?
The market size is provided in terms of value, measured in Million and volume, measured in Tonnes.
11. Are there any specific market keywords associated with the report?
Yes, the market keyword associated with the report is "Oil and Gas Industry in Qatar," which aids in identifying and referencing the specific market segment covered.
12. How do I determine which pricing option suits my needs best?
The pricing options vary based on user requirements and access needs. Individual users may opt for single-user licenses, while businesses requiring broader access may choose multi-user or enterprise licenses for cost-effective access to the report.
13. Are there any additional resources or data provided in the Oil and Gas Industry in Qatar report?
While the report offers comprehensive insights, it's advisable to review the specific contents or supplementary materials provided to ascertain if additional resources or data are available.
14. How can I stay updated on further developments or reports in the Oil and Gas Industry in Qatar?
To stay informed about further developments, trends, and reports in the Oil and Gas Industry in Qatar, consider subscribing to industry newsletters, following relevant companies and organizations, or regularly checking reputable industry news sources and publications.
Methodology
Step 1 - Identification of Relevant Samples Size from Population Database


Step 2 - Approaches for Defining Global Market Size (Value, Volume* & Price*)

Note*: In applicable scenarios
Step 3 - Data Sources
Primary Research
- Web Analytics
- Survey Reports
- Research Institute
- Latest Research Reports
- Opinion Leaders
Secondary Research
- Annual Reports
- White Paper
- Latest Press Release
- Industry Association
- Paid Database
- Investor Presentations

Step 4 - Data Triangulation
Involves using different sources of information in order to increase the validity of a study
These sources are likely to be stakeholders in a program - participants, other researchers, program staff, other community members, and so on.
Then we put all data in single framework & apply various statistical tools to find out the dynamic on the market.
During the analysis stage, feedback from the stakeholder groups would be compared to determine areas of agreement as well as areas of divergence


