
Key Insights
The optical sensor market is experiencing robust growth, projected to reach a substantial size driven by increasing automation across diverse sectors. The 6.33% CAGR from 2019-2033 indicates a consistently expanding market, fueled by several key factors. Advancements in sensor technology, particularly in miniaturization and improved sensitivity, are enabling broader applications in areas like automotive (autonomous driving systems and advanced driver-assistance systems), medical (diagnostic imaging and minimally invasive surgeries), and industrial automation (robotics and process control). The rising demand for high-precision and reliable sensing solutions in these sectors is a major driver. Furthermore, the burgeoning consumer electronics market, with its increasing integration of smart devices and wearables, contributes significantly to market expansion. While the market is segmented by sensor type (fiber optic, image, photoelectric, ambient light, and proximity) and application (industrial, medical, biometric, automotive, and consumer electronics), the intrinsic and extrinsic optical sensor types are also key differentiators based on their sensing mechanisms. Leading players like ROHM, Vishay, Honeywell, and Keyence are continuously investing in R&D and strategic partnerships to strengthen their market positions and capitalize on emerging opportunities.
Competition is intense, with established players and emerging companies vying for market share. Growth, however, is not without challenges. Cost constraints, particularly for high-end applications, and the need for sophisticated integration within complex systems can act as restraints. Regulatory hurdles and potential supply chain disruptions also present challenges. However, ongoing technological innovation, coupled with increasing demand across various industries, positions the optical sensor market for sustained expansion. The Asia-Pacific region, particularly China and Japan, is expected to witness significant growth, driven by rapid industrialization and technological advancements. North America and Europe will also maintain substantial market shares, owing to their strong presence in automotive and medical applications. Future growth will likely depend on the pace of technological advancements, the adoption of automation across sectors, and the successful integration of optical sensors into next-generation devices and systems.
This comprehensive report provides a detailed analysis of the Optical Sensor industry, encompassing market size, segmentation, growth drivers, challenges, and key players. The report covers the period 2019-2033, with a base year of 2025 and a forecast period of 2025-2033. It offers actionable insights for industry stakeholders, including manufacturers, investors, and researchers. The global market value is projected to reach xx Million by 2033.

Optical Sensor Industry Market Concentration & Innovation
The Optical Sensor industry exhibits a moderately concentrated market structure, with several key players holding significant market share. ROHM Co Ltd, Vishay Intertechnology Inc, Honeywell International Inc, Keyence Corporation, and SICK AG are among the leading companies, collectively accounting for an estimated xx% of the global market in 2025. However, the market also features numerous smaller players and emerging companies, fostering competition and innovation.
Market Concentration Metrics (2025 Estimates):
- Top 5 Players Market Share: xx%
- Top 10 Players Market Share: xx%
- Average Market Share per Player (excluding top 10): xx%
Innovation Drivers:
- Advancements in semiconductor technology, driving miniaturization and improved performance.
- Growing demand for automation and robotics across various industries.
- Development of advanced imaging and sensing techniques, such as 3D lidar and time-of-flight sensors.
Regulatory Frameworks and Product Substitutes:
The industry is subject to various regulations related to safety, performance, and environmental impact. While direct substitutes are limited, alternative sensing technologies, such as ultrasonic and radar sensors, pose some competitive pressure.
M&A Activities:
The Optical Sensor market has witnessed a moderate level of mergers and acquisitions (M&A) activity in recent years, with deal values primarily driven by the need for technological expansion and market consolidation. The total value of M&A deals in the industry during the historical period (2019-2024) is estimated at xx Million.
End-User Trends:
The increasing adoption of optical sensors across diverse end-use sectors such as automotive, healthcare, industrial automation, and consumer electronics represents a key trend. Consumer preference is shifting toward products with advanced features and improved performance, demanding more sophisticated optical sensing technologies.
Optical Sensor Industry Industry Trends & Insights
The Optical Sensor market is experiencing robust growth, driven by increasing demand across diverse sectors. The Compound Annual Growth Rate (CAGR) is projected to be xx% during the forecast period (2025-2033). Technological advancements, particularly in areas like 3D sensing and miniaturization, are major contributors to this growth. Market penetration is increasing in developing economies, driven by industrialization and rising consumer spending. However, competitive pressure from established and emerging players requires continuous innovation and strategic adaptation. Consumer preference for higher accuracy, improved sensitivity, and reduced power consumption is shaping product development and market dynamics. These factors combined with ongoing technological advancements suggest significant growth potential.

Dominant Markets & Segments in Optical Sensor Industry
Leading Regions/Countries:
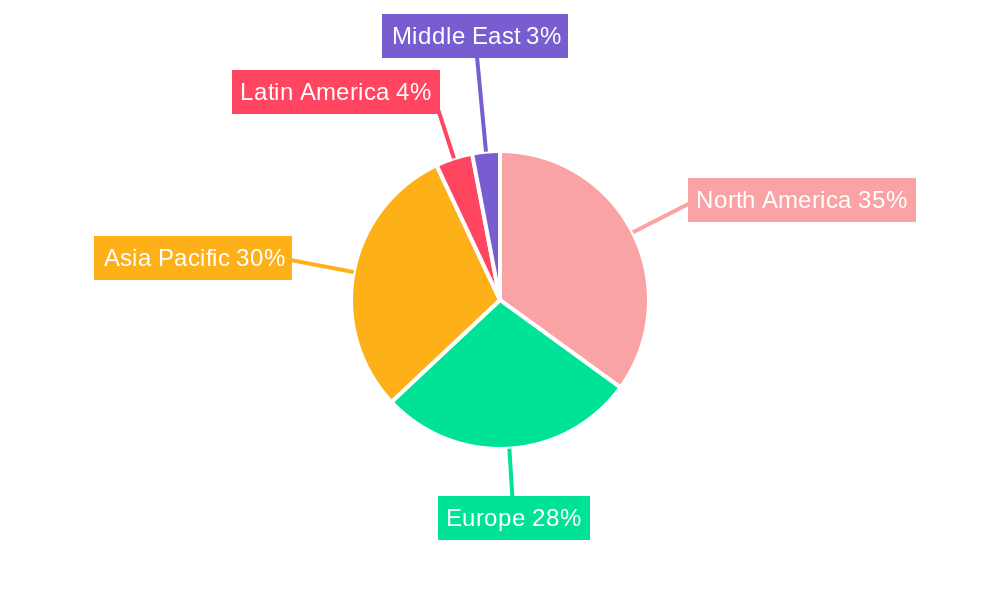
The North American and European regions currently hold the largest market share, driven by strong demand from automotive, industrial automation, and healthcare sectors. However, Asia-Pacific is anticipated to witness significant growth in the forecast period due to expanding industrialization and growing adoption of consumer electronics.
Dominant Segments:
- By Type: The Extrinsic Optical Sensor segment is projected to dominate the market in 2025, owing to its versatility and wide range of applications. However, the Intrinsic Optical Sensor segment is expected to witness faster growth in the coming years.
- By Sensor Type: The Image Sensor segment holds a significant market share due to its use in diverse applications, including automotive, medical imaging, and machine vision. Photoelectric sensors also represent a significant portion of the market due to their widespread adoption in industrial automation. Fiber optic sensors are gaining traction in niche applications requiring high precision and durability. Ambient Light and Proximity sensors are increasingly adopted in consumer electronics, driving segment growth.
- By Application: The Industrial sector accounts for the largest market share due to the wide adoption of optical sensors in automation, robotics, and process control. The Automotive sector is experiencing strong growth, fueled by the rise of Advanced Driver-Assistance Systems (ADAS) and autonomous vehicles. The Medical sector is a significant user of optical sensors in diagnostic and therapeutic applications. Biometric applications are experiencing expansion.
Key Drivers for Dominant Segments:
- Industrial: Automation, robotics, and process control.
- Automotive: ADAS, autonomous driving, and safety systems.
- Medical: Diagnostic imaging, therapeutic procedures, and biosensors.
- Consumer Electronics: Smartphones, wearables, and gaming devices.
Optical Sensor Industry Product Developments
Recent product innovations include advancements in 3D lidar sensors, high-resolution CMOS image sensors, and miniaturized optical modules. These developments enable improved performance, enhanced accuracy, and wider range of applications. The focus is on miniaturization, improved energy efficiency, and integration with other technologies like AI and machine learning to enable advanced functionalities.
Report Scope & Segmentation Analysis
This report provides a comprehensive analysis of the Optical Sensor market, segmented by type (Extrinsic and Intrinsic), sensor type (Fiber Optic, Image, Photoelectric, Ambient Light, and Proximity), and application (Industrial, Medical, Biometric, Automotive, and Consumer Electronics). The report delves into the growth trajectory of each segment, providing detailed market size estimations (in millions) for historical, current, and projected future periods. A granular competitive landscape analysis is included for each segment, highlighting key players and their market strategies. While the Industrial segment currently holds a dominant position, the Automotive segment is poised for substantial growth, driven by the increasing adoption of advanced driver-assistance systems (ADAS) and autonomous vehicles. Furthermore, the report offers insightful analysis of emerging applications and technological advancements that are shaping the future of the optical sensor market.
Key Drivers of Optical Sensor Industry Growth
Several factors are driving market growth, including technological advancements leading to higher accuracy, miniaturization, and improved performance; increasing automation and robotics across various sectors; expanding use of optical sensors in automotive, healthcare and consumer electronics; and supportive government policies promoting technological innovation.
Challenges in the Optical Sensor Industry Sector
The Optical Sensor industry faces several significant challenges. Intense competition among established players and new entrants necessitates continuous innovation and cost optimization. Supply chain vulnerabilities, including potential disruptions and fluctuations in component availability and pricing, pose a considerable risk. Meeting stringent regulatory requirements regarding sensor performance, safety, and reliability adds to the complexity of the market. Finally, the high cost of research and development, coupled with the manufacturing complexities of some advanced sensor technologies, presents a significant barrier to entry for new players and limits widespread adoption in certain applications.
Emerging Opportunities in Optical Sensor Industry
Despite the challenges, the Optical Sensor industry presents significant growth opportunities. The development and adoption of advanced sensing technologies, such as 3D lidar, time-of-flight (ToF) sensors, and hyperspectral imaging, are driving market expansion across diverse sectors. The increasing proliferation of the Internet of Things (IoT), the development of smart cities, and the growing need for sophisticated environmental monitoring systems are creating substantial demand for high-performance optical sensors. Furthermore, advancements in miniaturization, power efficiency, and improved sensor integration are broadening the applications of optical sensors in consumer electronics, healthcare, and industrial automation.
Leading Players in the Optical Sensor Industry Market
- ROHM Co Ltd
- Vishay Intertechnology Inc
- Honeywell International Inc
- Keyence Corporation
- SICK AG
- IFM Efector Inc
- Rockwell Automation Inc
- Pepperl+Fuchs GmbH
- STMicroelectronics NV
- On Semiconductor Corporation
Key Developments in Optical Sensor Industry Industry
- October 2022: Lumotive and Gpixel partnered to launch a reference design platform for next-generation 3D lidar sensors, targeting mobility and industrial applications.
- July 2022: Sony Corporation announced the IMX675, a high-resolution CMOS image sensor for security cameras.
Strategic Outlook for Optical Sensor Industry Market
The Optical Sensor industry is poised for sustained growth, driven by continuous technological advancements, expanding applications across diverse sectors, and increasing demand for automation and smart technologies. The future market holds considerable potential for players who can successfully innovate, adapt to evolving market trends, and cater to diverse customer needs across various industry verticals.
Optical Sensor Industry Segmentation
-
1. Type
- 1.1. Extrinsic Optical Sensor
- 1.2. Intrinsic Optical Sensor
-
2. Sensor Type
- 2.1. Fiber Optic Sensor
- 2.2. Image Sensor
- 2.3. Photoelectric Sensor
- 2.4. Ambient Light and Proximity Sensor
-
3. Application
- 3.1. Industrial
- 3.2. Medical
- 3.3. Biometric
- 3.4. Automotive
- 3.5. Consumer Electronics
Optical Sensor Industry Segmentation By Geography
-
1. North America
- 1.1. United States
- 1.2. Canada
-
2. Europe
- 2.1. Germany
- 2.2. United Kingdom
- 2.3. France
- 2.4. Rest of the Europe
-
3. Asia Pacific
- 3.1. China
- 3.2. Japan
- 3.3. India
- 3.4. Rest of the Asia Pacific
-
4. Latin America
- 4.1. Brazil
- 4.2. Mexico
- 4.3. Rest of the Latin America
- 5. Middle East
-
6. United Arab Emirates
- 6.1. Saudi Arabia
- 6.2. Rest of the Middle East
Optical Sensor Industry REPORT HIGHLIGHTS
| Aspects | Details |
|---|---|
| Study Period | 2019-2033 |
| Base Year | 2024 |
| Estimated Year | 2025 |
| Forecast Period | 2025-2033 |
| Historical Period | 2019-2024 |
| Growth Rate | CAGR of 6.33% from 2019-2033 |
| Segmentation |
|
Table of Contents
- 1. Introduction
- 1.1. Research Scope
- 1.2. Market Segmentation
- 1.3. Research Methodology
- 1.4. Definitions and Assumptions
- 2. Executive Summary
- 2.1. Introduction
- 3. Market Dynamics
- 3.1. Introduction
- 3.2. Market Drivers
- 3.2.1. Increasing Market Penetration of Smartphones; Increasing Demand for Power-saving Devices Across Industries; Increasing Market Penetration of Automation Techniques Across Various Industries
- 3.3. Market Restrains
- 3.3.1. Adoption of Power Transistors is Analyzed Pose a Challenge for the Market
- 3.4. Market Trends
- 3.4.1. Photoelectric Sensor is Expected to Register a Significant Growth
- 4. Market Factor Analysis
- 4.1. Porters Five Forces
- 4.2. Supply/Value Chain
- 4.3. PESTEL analysis
- 4.4. Market Entropy
- 4.5. Patent/Trademark Analysis
- 5. Global Optical Sensor Industry Analysis, Insights and Forecast, 2019-2031
- 5.1. Market Analysis, Insights and Forecast - by Type
- 5.1.1. Extrinsic Optical Sensor
- 5.1.2. Intrinsic Optical Sensor
- 5.2. Market Analysis, Insights and Forecast - by Sensor Type
- 5.2.1. Fiber Optic Sensor
- 5.2.2. Image Sensor
- 5.2.3. Photoelectric Sensor
- 5.2.4. Ambient Light and Proximity Sensor
- 5.3. Market Analysis, Insights and Forecast - by Application
- 5.3.1. Industrial
- 5.3.2. Medical
- 5.3.3. Biometric
- 5.3.4. Automotive
- 5.3.5. Consumer Electronics
- 5.4. Market Analysis, Insights and Forecast - by Region
- 5.4.1. North America
- 5.4.2. Europe
- 5.4.3. Asia Pacific
- 5.4.4. Latin America
- 5.4.5. Middle East
- 5.4.6. United Arab Emirates
- 5.1. Market Analysis, Insights and Forecast - by Type
- 6. North America Optical Sensor Industry Analysis, Insights and Forecast, 2019-2031
- 6.1. Market Analysis, Insights and Forecast - by Type
- 6.1.1. Extrinsic Optical Sensor
- 6.1.2. Intrinsic Optical Sensor
- 6.2. Market Analysis, Insights and Forecast - by Sensor Type
- 6.2.1. Fiber Optic Sensor
- 6.2.2. Image Sensor
- 6.2.3. Photoelectric Sensor
- 6.2.4. Ambient Light and Proximity Sensor
- 6.3. Market Analysis, Insights and Forecast - by Application
- 6.3.1. Industrial
- 6.3.2. Medical
- 6.3.3. Biometric
- 6.3.4. Automotive
- 6.3.5. Consumer Electronics
- 6.1. Market Analysis, Insights and Forecast - by Type
- 7. Europe Optical Sensor Industry Analysis, Insights and Forecast, 2019-2031
- 7.1. Market Analysis, Insights and Forecast - by Type
- 7.1.1. Extrinsic Optical Sensor
- 7.1.2. Intrinsic Optical Sensor
- 7.2. Market Analysis, Insights and Forecast - by Sensor Type
- 7.2.1. Fiber Optic Sensor
- 7.2.2. Image Sensor
- 7.2.3. Photoelectric Sensor
- 7.2.4. Ambient Light and Proximity Sensor
- 7.3. Market Analysis, Insights and Forecast - by Application
- 7.3.1. Industrial
- 7.3.2. Medical
- 7.3.3. Biometric
- 7.3.4. Automotive
- 7.3.5. Consumer Electronics
- 7.1. Market Analysis, Insights and Forecast - by Type
- 8. Asia Pacific Optical Sensor Industry Analysis, Insights and Forecast, 2019-2031
- 8.1. Market Analysis, Insights and Forecast - by Type
- 8.1.1. Extrinsic Optical Sensor
- 8.1.2. Intrinsic Optical Sensor
- 8.2. Market Analysis, Insights and Forecast - by Sensor Type
- 8.2.1. Fiber Optic Sensor
- 8.2.2. Image Sensor
- 8.2.3. Photoelectric Sensor
- 8.2.4. Ambient Light and Proximity Sensor
- 8.3. Market Analysis, Insights and Forecast - by Application
- 8.3.1. Industrial
- 8.3.2. Medical
- 8.3.3. Biometric
- 8.3.4. Automotive
- 8.3.5. Consumer Electronics
- 8.1. Market Analysis, Insights and Forecast - by Type
- 9. Latin America Optical Sensor Industry Analysis, Insights and Forecast, 2019-2031
- 9.1. Market Analysis, Insights and Forecast - by Type
- 9.1.1. Extrinsic Optical Sensor
- 9.1.2. Intrinsic Optical Sensor
- 9.2. Market Analysis, Insights and Forecast - by Sensor Type
- 9.2.1. Fiber Optic Sensor
- 9.2.2. Image Sensor
- 9.2.3. Photoelectric Sensor
- 9.2.4. Ambient Light and Proximity Sensor
- 9.3. Market Analysis, Insights and Forecast - by Application
- 9.3.1. Industrial
- 9.3.2. Medical
- 9.3.3. Biometric
- 9.3.4. Automotive
- 9.3.5. Consumer Electronics
- 9.1. Market Analysis, Insights and Forecast - by Type
- 10. Middle East Optical Sensor Industry Analysis, Insights and Forecast, 2019-2031
- 10.1. Market Analysis, Insights and Forecast - by Type
- 10.1.1. Extrinsic Optical Sensor
- 10.1.2. Intrinsic Optical Sensor
- 10.2. Market Analysis, Insights and Forecast - by Sensor Type
- 10.2.1. Fiber Optic Sensor
- 10.2.2. Image Sensor
- 10.2.3. Photoelectric Sensor
- 10.2.4. Ambient Light and Proximity Sensor
- 10.3. Market Analysis, Insights and Forecast - by Application
- 10.3.1. Industrial
- 10.3.2. Medical
- 10.3.3. Biometric
- 10.3.4. Automotive
- 10.3.5. Consumer Electronics
- 10.1. Market Analysis, Insights and Forecast - by Type
- 11. United Arab Emirates Optical Sensor Industry Analysis, Insights and Forecast, 2019-2031
- 11.1. Market Analysis, Insights and Forecast - by Type
- 11.1.1. Extrinsic Optical Sensor
- 11.1.2. Intrinsic Optical Sensor
- 11.2. Market Analysis, Insights and Forecast - by Sensor Type
- 11.2.1. Fiber Optic Sensor
- 11.2.2. Image Sensor
- 11.2.3. Photoelectric Sensor
- 11.2.4. Ambient Light and Proximity Sensor
- 11.3. Market Analysis, Insights and Forecast - by Application
- 11.3.1. Industrial
- 11.3.2. Medical
- 11.3.3. Biometric
- 11.3.4. Automotive
- 11.3.5. Consumer Electronics
- 11.1. Market Analysis, Insights and Forecast - by Type
- 12. North America Optical Sensor Industry Analysis, Insights and Forecast, 2019-2031
- 12.1. Market Analysis, Insights and Forecast - By Country/Sub-region
- 12.1.1 United States
- 12.1.2 Canada
- 13. Europe Optical Sensor Industry Analysis, Insights and Forecast, 2019-2031
- 13.1. Market Analysis, Insights and Forecast - By Country/Sub-region
- 13.1.1 Germany
- 13.1.2 United Kingdom
- 13.1.3 France
- 13.1.4 Rest of the Europe
- 14. Asia Pacific Optical Sensor Industry Analysis, Insights and Forecast, 2019-2031
- 14.1. Market Analysis, Insights and Forecast - By Country/Sub-region
- 14.1.1 China
- 14.1.2 Japan
- 14.1.3 India
- 14.1.4 Rest of the Asia Pacific
- 15. Latin America Optical Sensor Industry Analysis, Insights and Forecast, 2019-2031
- 15.1. Market Analysis, Insights and Forecast - By Country/Sub-region
- 15.1.1 Brazil
- 15.1.2 Mexico
- 15.1.3 Rest of the Latin America
- 16. Middle East Optical Sensor Industry Analysis, Insights and Forecast, 2019-2031
- 16.1. Market Analysis, Insights and Forecast - By Country/Sub-region
- 16.1.1.
- 17. United Arab Emirates Optical Sensor Industry Analysis, Insights and Forecast, 2019-2031
- 17.1. Market Analysis, Insights and Forecast - By Country/Sub-region
- 17.1.1 Saudi Arabia
- 17.1.2 Rest of the Middle East
- 18. Competitive Analysis
- 18.1. Global Market Share Analysis 2024
- 18.2. Company Profiles
- 18.2.1 ROHM Co Ltd
- 18.2.1.1. Overview
- 18.2.1.2. Products
- 18.2.1.3. SWOT Analysis
- 18.2.1.4. Recent Developments
- 18.2.1.5. Financials (Based on Availability)
- 18.2.2 Vishay Intertechnology Inc
- 18.2.2.1. Overview
- 18.2.2.2. Products
- 18.2.2.3. SWOT Analysis
- 18.2.2.4. Recent Developments
- 18.2.2.5. Financials (Based on Availability)
- 18.2.3 Honeywell International Inc
- 18.2.3.1. Overview
- 18.2.3.2. Products
- 18.2.3.3. SWOT Analysis
- 18.2.3.4. Recent Developments
- 18.2.3.5. Financials (Based on Availability)
- 18.2.4 Keyence Corporation
- 18.2.4.1. Overview
- 18.2.4.2. Products
- 18.2.4.3. SWOT Analysis
- 18.2.4.4. Recent Developments
- 18.2.4.5. Financials (Based on Availability)
- 18.2.5 SICK AG
- 18.2.5.1. Overview
- 18.2.5.2. Products
- 18.2.5.3. SWOT Analysis
- 18.2.5.4. Recent Developments
- 18.2.5.5. Financials (Based on Availability)
- 18.2.6 IFM Efector Inc
- 18.2.6.1. Overview
- 18.2.6.2. Products
- 18.2.6.3. SWOT Analysis
- 18.2.6.4. Recent Developments
- 18.2.6.5. Financials (Based on Availability)
- 18.2.7 Rockwell Automation Inc
- 18.2.7.1. Overview
- 18.2.7.2. Products
- 18.2.7.3. SWOT Analysis
- 18.2.7.4. Recent Developments
- 18.2.7.5. Financials (Based on Availability)
- 18.2.8 Pepperl+Fuchs GmbH
- 18.2.8.1. Overview
- 18.2.8.2. Products
- 18.2.8.3. SWOT Analysis
- 18.2.8.4. Recent Developments
- 18.2.8.5. Financials (Based on Availability)
- 18.2.9 STMicroelectronics NV*List Not Exhaustive
- 18.2.9.1. Overview
- 18.2.9.2. Products
- 18.2.9.3. SWOT Analysis
- 18.2.9.4. Recent Developments
- 18.2.9.5. Financials (Based on Availability)
- 18.2.10 On Semiconductor Corporation
- 18.2.10.1. Overview
- 18.2.10.2. Products
- 18.2.10.3. SWOT Analysis
- 18.2.10.4. Recent Developments
- 18.2.10.5. Financials (Based on Availability)
- 18.2.1 ROHM Co Ltd
List of Figures
- Figure 1: Global Optical Sensor Industry Revenue Breakdown (Million, %) by Region 2024 & 2032
- Figure 2: North America Optical Sensor Industry Revenue (Million), by Country 2024 & 2032
- Figure 3: North America Optical Sensor Industry Revenue Share (%), by Country 2024 & 2032
- Figure 4: Europe Optical Sensor Industry Revenue (Million), by Country 2024 & 2032
- Figure 5: Europe Optical Sensor Industry Revenue Share (%), by Country 2024 & 2032
- Figure 6: Asia Pacific Optical Sensor Industry Revenue (Million), by Country 2024 & 2032
- Figure 7: Asia Pacific Optical Sensor Industry Revenue Share (%), by Country 2024 & 2032
- Figure 8: Latin America Optical Sensor Industry Revenue (Million), by Country 2024 & 2032
- Figure 9: Latin America Optical Sensor Industry Revenue Share (%), by Country 2024 & 2032
- Figure 10: Middle East Optical Sensor Industry Revenue (Million), by Country 2024 & 2032
- Figure 11: Middle East Optical Sensor Industry Revenue Share (%), by Country 2024 & 2032
- Figure 12: United Arab Emirates Optical Sensor Industry Revenue (Million), by Country 2024 & 2032
- Figure 13: United Arab Emirates Optical Sensor Industry Revenue Share (%), by Country 2024 & 2032
- Figure 14: North America Optical Sensor Industry Revenue (Million), by Type 2024 & 2032
- Figure 15: North America Optical Sensor Industry Revenue Share (%), by Type 2024 & 2032
- Figure 16: North America Optical Sensor Industry Revenue (Million), by Sensor Type 2024 & 2032
- Figure 17: North America Optical Sensor Industry Revenue Share (%), by Sensor Type 2024 & 2032
- Figure 18: North America Optical Sensor Industry Revenue (Million), by Application 2024 & 2032
- Figure 19: North America Optical Sensor Industry Revenue Share (%), by Application 2024 & 2032
- Figure 20: North America Optical Sensor Industry Revenue (Million), by Country 2024 & 2032
- Figure 21: North America Optical Sensor Industry Revenue Share (%), by Country 2024 & 2032
- Figure 22: Europe Optical Sensor Industry Revenue (Million), by Type 2024 & 2032
- Figure 23: Europe Optical Sensor Industry Revenue Share (%), by Type 2024 & 2032
- Figure 24: Europe Optical Sensor Industry Revenue (Million), by Sensor Type 2024 & 2032
- Figure 25: Europe Optical Sensor Industry Revenue Share (%), by Sensor Type 2024 & 2032
- Figure 26: Europe Optical Sensor Industry Revenue (Million), by Application 2024 & 2032
- Figure 27: Europe Optical Sensor Industry Revenue Share (%), by Application 2024 & 2032
- Figure 28: Europe Optical Sensor Industry Revenue (Million), by Country 2024 & 2032
- Figure 29: Europe Optical Sensor Industry Revenue Share (%), by Country 2024 & 2032
- Figure 30: Asia Pacific Optical Sensor Industry Revenue (Million), by Type 2024 & 2032
- Figure 31: Asia Pacific Optical Sensor Industry Revenue Share (%), by Type 2024 & 2032
- Figure 32: Asia Pacific Optical Sensor Industry Revenue (Million), by Sensor Type 2024 & 2032
- Figure 33: Asia Pacific Optical Sensor Industry Revenue Share (%), by Sensor Type 2024 & 2032
- Figure 34: Asia Pacific Optical Sensor Industry Revenue (Million), by Application 2024 & 2032
- Figure 35: Asia Pacific Optical Sensor Industry Revenue Share (%), by Application 2024 & 2032
- Figure 36: Asia Pacific Optical Sensor Industry Revenue (Million), by Country 2024 & 2032
- Figure 37: Asia Pacific Optical Sensor Industry Revenue Share (%), by Country 2024 & 2032
- Figure 38: Latin America Optical Sensor Industry Revenue (Million), by Type 2024 & 2032
- Figure 39: Latin America Optical Sensor Industry Revenue Share (%), by Type 2024 & 2032
- Figure 40: Latin America Optical Sensor Industry Revenue (Million), by Sensor Type 2024 & 2032
- Figure 41: Latin America Optical Sensor Industry Revenue Share (%), by Sensor Type 2024 & 2032
- Figure 42: Latin America Optical Sensor Industry Revenue (Million), by Application 2024 & 2032
- Figure 43: Latin America Optical Sensor Industry Revenue Share (%), by Application 2024 & 2032
- Figure 44: Latin America Optical Sensor Industry Revenue (Million), by Country 2024 & 2032
- Figure 45: Latin America Optical Sensor Industry Revenue Share (%), by Country 2024 & 2032
- Figure 46: Middle East Optical Sensor Industry Revenue (Million), by Type 2024 & 2032
- Figure 47: Middle East Optical Sensor Industry Revenue Share (%), by Type 2024 & 2032
- Figure 48: Middle East Optical Sensor Industry Revenue (Million), by Sensor Type 2024 & 2032
- Figure 49: Middle East Optical Sensor Industry Revenue Share (%), by Sensor Type 2024 & 2032
- Figure 50: Middle East Optical Sensor Industry Revenue (Million), by Application 2024 & 2032
- Figure 51: Middle East Optical Sensor Industry Revenue Share (%), by Application 2024 & 2032
- Figure 52: Middle East Optical Sensor Industry Revenue (Million), by Country 2024 & 2032
- Figure 53: Middle East Optical Sensor Industry Revenue Share (%), by Country 2024 & 2032
- Figure 54: United Arab Emirates Optical Sensor Industry Revenue (Million), by Type 2024 & 2032
- Figure 55: United Arab Emirates Optical Sensor Industry Revenue Share (%), by Type 2024 & 2032
- Figure 56: United Arab Emirates Optical Sensor Industry Revenue (Million), by Sensor Type 2024 & 2032
- Figure 57: United Arab Emirates Optical Sensor Industry Revenue Share (%), by Sensor Type 2024 & 2032
- Figure 58: United Arab Emirates Optical Sensor Industry Revenue (Million), by Application 2024 & 2032
- Figure 59: United Arab Emirates Optical Sensor Industry Revenue Share (%), by Application 2024 & 2032
- Figure 60: United Arab Emirates Optical Sensor Industry Revenue (Million), by Country 2024 & 2032
- Figure 61: United Arab Emirates Optical Sensor Industry Revenue Share (%), by Country 2024 & 2032
List of Tables
- Table 1: Global Optical Sensor Industry Revenue Million Forecast, by Region 2019 & 2032
- Table 2: Global Optical Sensor Industry Revenue Million Forecast, by Type 2019 & 2032
- Table 3: Global Optical Sensor Industry Revenue Million Forecast, by Sensor Type 2019 & 2032
- Table 4: Global Optical Sensor Industry Revenue Million Forecast, by Application 2019 & 2032
- Table 5: Global Optical Sensor Industry Revenue Million Forecast, by Region 2019 & 2032
- Table 6: Global Optical Sensor Industry Revenue Million Forecast, by Country 2019 & 2032
- Table 7: United States Optical Sensor Industry Revenue (Million) Forecast, by Application 2019 & 2032
- Table 8: Canada Optical Sensor Industry Revenue (Million) Forecast, by Application 2019 & 2032
- Table 9: Global Optical Sensor Industry Revenue Million Forecast, by Country 2019 & 2032
- Table 10: Germany Optical Sensor Industry Revenue (Million) Forecast, by Application 2019 & 2032
- Table 11: United Kingdom Optical Sensor Industry Revenue (Million) Forecast, by Application 2019 & 2032
- Table 12: France Optical Sensor Industry Revenue (Million) Forecast, by Application 2019 & 2032
- Table 13: Rest of the Europe Optical Sensor Industry Revenue (Million) Forecast, by Application 2019 & 2032
- Table 14: Global Optical Sensor Industry Revenue Million Forecast, by Country 2019 & 2032
- Table 15: China Optical Sensor Industry Revenue (Million) Forecast, by Application 2019 & 2032
- Table 16: Japan Optical Sensor Industry Revenue (Million) Forecast, by Application 2019 & 2032
- Table 17: India Optical Sensor Industry Revenue (Million) Forecast, by Application 2019 & 2032
- Table 18: Rest of the Asia Pacific Optical Sensor Industry Revenue (Million) Forecast, by Application 2019 & 2032
- Table 19: Global Optical Sensor Industry Revenue Million Forecast, by Country 2019 & 2032
- Table 20: Brazil Optical Sensor Industry Revenue (Million) Forecast, by Application 2019 & 2032
- Table 21: Mexico Optical Sensor Industry Revenue (Million) Forecast, by Application 2019 & 2032
- Table 22: Rest of the Latin America Optical Sensor Industry Revenue (Million) Forecast, by Application 2019 & 2032
- Table 23: Global Optical Sensor Industry Revenue Million Forecast, by Country 2019 & 2032
- Table 24: Optical Sensor Industry Revenue (Million) Forecast, by Application 2019 & 2032
- Table 25: Global Optical Sensor Industry Revenue Million Forecast, by Country 2019 & 2032
- Table 26: Saudi Arabia Optical Sensor Industry Revenue (Million) Forecast, by Application 2019 & 2032
- Table 27: Rest of the Middle East Optical Sensor Industry Revenue (Million) Forecast, by Application 2019 & 2032
- Table 28: Global Optical Sensor Industry Revenue Million Forecast, by Type 2019 & 2032
- Table 29: Global Optical Sensor Industry Revenue Million Forecast, by Sensor Type 2019 & 2032
- Table 30: Global Optical Sensor Industry Revenue Million Forecast, by Application 2019 & 2032
- Table 31: Global Optical Sensor Industry Revenue Million Forecast, by Country 2019 & 2032
- Table 32: United States Optical Sensor Industry Revenue (Million) Forecast, by Application 2019 & 2032
- Table 33: Canada Optical Sensor Industry Revenue (Million) Forecast, by Application 2019 & 2032
- Table 34: Global Optical Sensor Industry Revenue Million Forecast, by Type 2019 & 2032
- Table 35: Global Optical Sensor Industry Revenue Million Forecast, by Sensor Type 2019 & 2032
- Table 36: Global Optical Sensor Industry Revenue Million Forecast, by Application 2019 & 2032
- Table 37: Global Optical Sensor Industry Revenue Million Forecast, by Country 2019 & 2032
- Table 38: Germany Optical Sensor Industry Revenue (Million) Forecast, by Application 2019 & 2032
- Table 39: United Kingdom Optical Sensor Industry Revenue (Million) Forecast, by Application 2019 & 2032
- Table 40: France Optical Sensor Industry Revenue (Million) Forecast, by Application 2019 & 2032
- Table 41: Rest of the Europe Optical Sensor Industry Revenue (Million) Forecast, by Application 2019 & 2032
- Table 42: Global Optical Sensor Industry Revenue Million Forecast, by Type 2019 & 2032
- Table 43: Global Optical Sensor Industry Revenue Million Forecast, by Sensor Type 2019 & 2032
- Table 44: Global Optical Sensor Industry Revenue Million Forecast, by Application 2019 & 2032
- Table 45: Global Optical Sensor Industry Revenue Million Forecast, by Country 2019 & 2032
- Table 46: China Optical Sensor Industry Revenue (Million) Forecast, by Application 2019 & 2032
- Table 47: Japan Optical Sensor Industry Revenue (Million) Forecast, by Application 2019 & 2032
- Table 48: India Optical Sensor Industry Revenue (Million) Forecast, by Application 2019 & 2032
- Table 49: Rest of the Asia Pacific Optical Sensor Industry Revenue (Million) Forecast, by Application 2019 & 2032
- Table 50: Global Optical Sensor Industry Revenue Million Forecast, by Type 2019 & 2032
- Table 51: Global Optical Sensor Industry Revenue Million Forecast, by Sensor Type 2019 & 2032
- Table 52: Global Optical Sensor Industry Revenue Million Forecast, by Application 2019 & 2032
- Table 53: Global Optical Sensor Industry Revenue Million Forecast, by Country 2019 & 2032
- Table 54: Brazil Optical Sensor Industry Revenue (Million) Forecast, by Application 2019 & 2032
- Table 55: Mexico Optical Sensor Industry Revenue (Million) Forecast, by Application 2019 & 2032
- Table 56: Rest of the Latin America Optical Sensor Industry Revenue (Million) Forecast, by Application 2019 & 2032
- Table 57: Global Optical Sensor Industry Revenue Million Forecast, by Type 2019 & 2032
- Table 58: Global Optical Sensor Industry Revenue Million Forecast, by Sensor Type 2019 & 2032
- Table 59: Global Optical Sensor Industry Revenue Million Forecast, by Application 2019 & 2032
- Table 60: Global Optical Sensor Industry Revenue Million Forecast, by Country 2019 & 2032
- Table 61: Global Optical Sensor Industry Revenue Million Forecast, by Type 2019 & 2032
- Table 62: Global Optical Sensor Industry Revenue Million Forecast, by Sensor Type 2019 & 2032
- Table 63: Global Optical Sensor Industry Revenue Million Forecast, by Application 2019 & 2032
- Table 64: Global Optical Sensor Industry Revenue Million Forecast, by Country 2019 & 2032
- Table 65: Saudi Arabia Optical Sensor Industry Revenue (Million) Forecast, by Application 2019 & 2032
- Table 66: Rest of the Middle East Optical Sensor Industry Revenue (Million) Forecast, by Application 2019 & 2032
Frequently Asked Questions
1. What is the projected Compound Annual Growth Rate (CAGR) of the Optical Sensor Industry?
The projected CAGR is approximately 6.33%.
2. Which companies are prominent players in the Optical Sensor Industry?
Key companies in the market include ROHM Co Ltd, Vishay Intertechnology Inc, Honeywell International Inc, Keyence Corporation, SICK AG, IFM Efector Inc, Rockwell Automation Inc, Pepperl+Fuchs GmbH, STMicroelectronics NV*List Not Exhaustive, On Semiconductor Corporation.
3. What are the main segments of the Optical Sensor Industry?
The market segments include Type, Sensor Type, Application.
4. Can you provide details about the market size?
The market size is estimated to be USD XX Million as of 2022.
5. What are some drivers contributing to market growth?
Increasing Market Penetration of Smartphones; Increasing Demand for Power-saving Devices Across Industries; Increasing Market Penetration of Automation Techniques Across Various Industries.
6. What are the notable trends driving market growth?
Photoelectric Sensor is Expected to Register a Significant Growth.
7. Are there any restraints impacting market growth?
Adoption of Power Transistors is Analyzed Pose a Challenge for the Market.
8. Can you provide examples of recent developments in the market?
October 2022 - Lumotiveand Gpixelpartnered to launch a reference design platform comprising 3D lidar and CMOS image sensors to enable companies to adopt next-generation 3D lidar sensors in mobility and industrial applications like autonomous navigation of robots in logistics environments. Gpixel'sGTOF0503 indirect time-of-flight image sensor pairing with Lumotive'sLM10 beam steering chip provides a suitable solution for medium to long-range 3D applications. It highlights both the precision and flexibility offered by Gpixel'ssensor.
9. What pricing options are available for accessing the report?
Pricing options include single-user, multi-user, and enterprise licenses priced at USD 4750, USD 5250, and USD 8750 respectively.
10. Is the market size provided in terms of value or volume?
The market size is provided in terms of value, measured in Million.
11. Are there any specific market keywords associated with the report?
Yes, the market keyword associated with the report is "Optical Sensor Industry," which aids in identifying and referencing the specific market segment covered.
12. How do I determine which pricing option suits my needs best?
The pricing options vary based on user requirements and access needs. Individual users may opt for single-user licenses, while businesses requiring broader access may choose multi-user or enterprise licenses for cost-effective access to the report.
13. Are there any additional resources or data provided in the Optical Sensor Industry report?
While the report offers comprehensive insights, it's advisable to review the specific contents or supplementary materials provided to ascertain if additional resources or data are available.
14. How can I stay updated on further developments or reports in the Optical Sensor Industry?
To stay informed about further developments, trends, and reports in the Optical Sensor Industry, consider subscribing to industry newsletters, following relevant companies and organizations, or regularly checking reputable industry news sources and publications.
Methodology
Step 1 - Identification of Relevant Samples Size from Population Database


Step 2 - Approaches for Defining Global Market Size (Value, Volume* & Price*)

Note*: In applicable scenarios
Step 3 - Data Sources
Primary Research
- Web Analytics
- Survey Reports
- Research Institute
- Latest Research Reports
- Opinion Leaders
Secondary Research
- Annual Reports
- White Paper
- Latest Press Release
- Industry Association
- Paid Database
- Investor Presentations

Step 4 - Data Triangulation
Involves using different sources of information in order to increase the validity of a study
These sources are likely to be stakeholders in a program - participants, other researchers, program staff, other community members, and so on.
Then we put all data in single framework & apply various statistical tools to find out the dynamic on the market.
During the analysis stage, feedback from the stakeholder groups would be compared to determine areas of agreement as well as areas of divergence


