
Key Insights
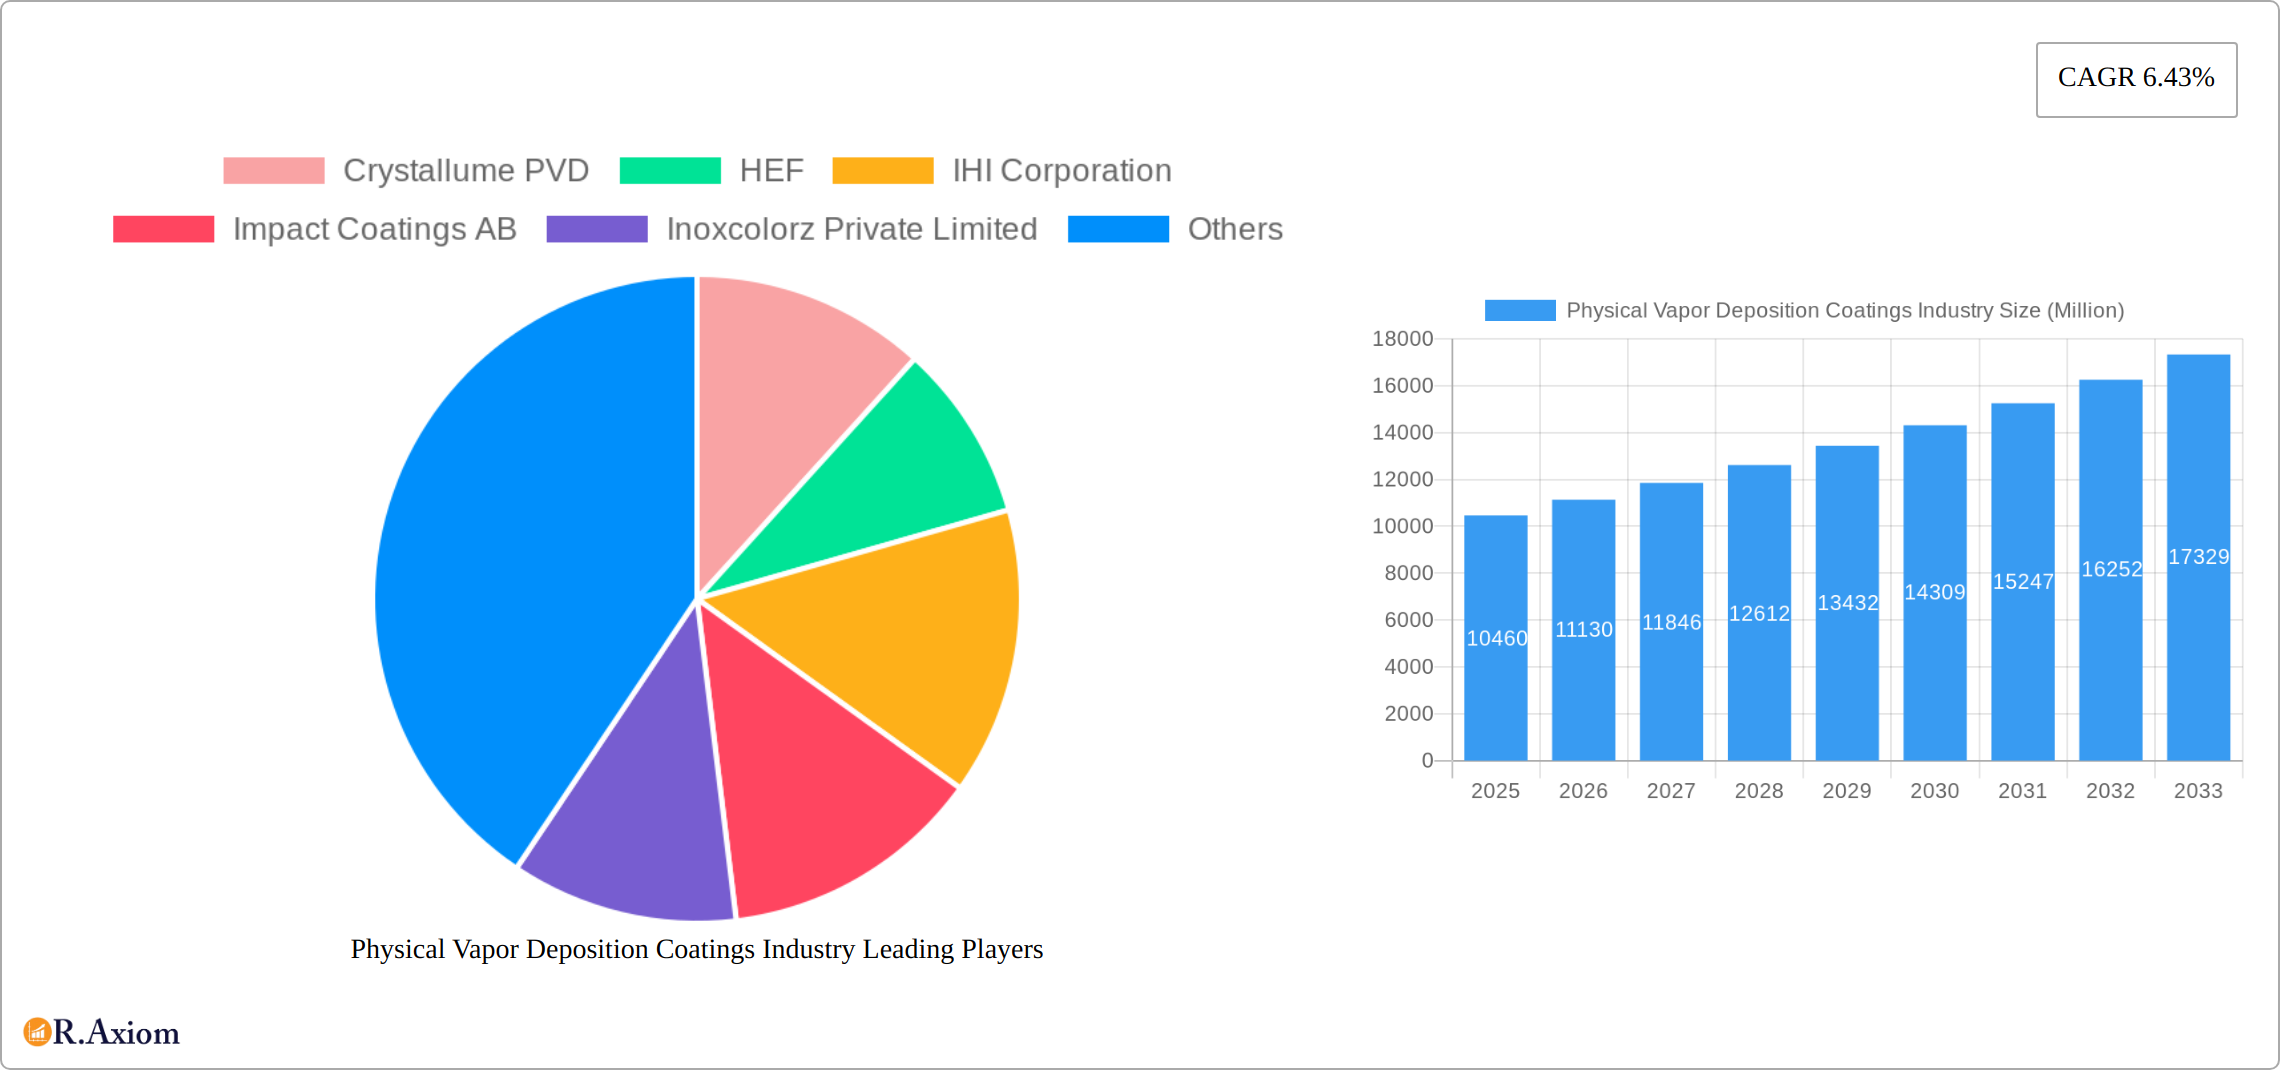
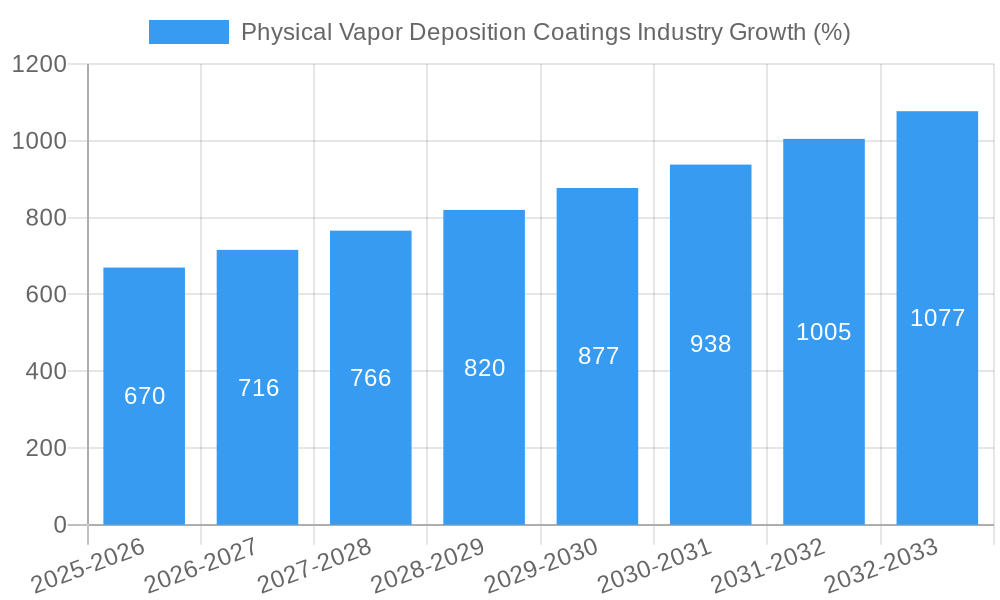
The Physical Vapor Deposition (PVD) Coatings market is experiencing robust growth, projected to reach a market size of $10.46 billion in 2025, exhibiting a Compound Annual Growth Rate (CAGR) of 6.43% from 2019 to 2033. This expansion is driven by several key factors. Increasing demand across diverse sectors such as automotive, aerospace, electronics, and medical devices fuels the adoption of PVD coatings due to their superior properties like enhanced wear resistance, corrosion protection, and aesthetic appeal. Technological advancements leading to improved coating techniques, greater deposition rates, and the development of novel coating materials are further propelling market growth. The rising focus on sustainability and the development of environmentally friendly PVD processes are also contributing positively to the industry's expansion. Key players like Oerlikon, Mitsubishi Materials, and others are investing heavily in R&D and strategic acquisitions to strengthen their market position and tap into emerging applications.
However, the market faces some challenges. The high initial investment costs associated with PVD coating equipment can pose a barrier to entry for smaller companies. Furthermore, fluctuations in raw material prices and potential environmental regulations could impact profitability. Despite these restraints, the long-term outlook for the PVD coatings market remains positive. The continuous development of advanced materials and applications, coupled with the growing demand for high-performance coatings, is expected to drive significant growth throughout the forecast period (2025-2033). The diverse range of applications and the inherent advantages of PVD coatings over traditional methods ensure the industry will continue its upward trajectory, driven by innovation and consistent market demand.
Physical Vapor Deposition (PVD) Coatings Industry: A Comprehensive Market Report (2019-2033)
This comprehensive report provides a detailed analysis of the Physical Vapor Deposition (PVD) coatings industry, offering invaluable insights for stakeholders, investors, and industry professionals. The report covers the period from 2019 to 2033, with a focus on the forecast period from 2025 to 2033 and a base year of 2025. The global market size is projected to reach xx Million by 2033, exhibiting a CAGR of xx% during the forecast period.
Physical Vapor Deposition Coatings Industry Market Concentration & Innovation
The PVD coatings industry is characterized by a moderately concentrated market structure with a few dominant players and numerous smaller niche players. Market share data reveals that the top 5 players account for approximately xx% of the global market in 2025. This concentration is driven by significant capital investment requirements for advanced PVD equipment and expertise in coating processes. Innovation is a key differentiator, with companies investing heavily in R&D to develop advanced coating materials with enhanced properties like improved hardness, corrosion resistance, and wear resistance. This is further fueled by stringent regulatory frameworks driving the need for environmentally friendly coating solutions.
The industry witnesses continuous mergers and acquisitions (M&A) activities. Recent deals, while not publicly disclosing specific values, show a trend toward consolidating market share and expanding geographical reach. For instance, the value of M&A activities in the last 5 years is estimated to be xx Million, with an average deal size of xx Million.
- Key Innovation Drivers: Advanced material development, process optimization, and expansion into new applications (e.g., hydrogen technology, aerospace).
- Regulatory Frameworks: Environmental regulations regarding VOC emissions are shaping the market towards more sustainable PVD techniques.
- Product Substitutes: Alternative coating technologies, such as chemical vapor deposition (CVD) and electroplating, pose some competitive pressure.
- End-User Trends: Growing demand from automotive, aerospace, medical, and electronics industries are key growth drivers.
- M&A Activity: Ongoing consolidation and expansion strategies of key players.
Physical Vapor Deposition Coatings Industry Industry Trends & Insights
The PVD coatings market is experiencing robust growth driven by several factors. The increasing demand for durable, aesthetically pleasing, and functional coatings across diverse industries is a primary driver. Technological advancements resulting in enhanced coating properties, improved deposition rates, and reduced costs are further fueling market expansion. Consumer preferences for high-quality, long-lasting products are also stimulating demand. The market is witnessing increasing adoption of PVD coatings in niche applications such as hydrogen technology and advanced medical devices.
The market demonstrates significant regional variations, with certain regions exhibiting faster growth rates compared to others due to factors like economic development, infrastructure, and technological adoption. The competitive landscape is intense, with companies competing on pricing, quality, innovation, and customer service. Specific market penetration rates vary significantly based on the application and region. The overall market penetration for PVD coatings across major industries is estimated at xx% in 2025.
Dominant Markets & Segments in Physical Vapor Deposition Coatings Industry
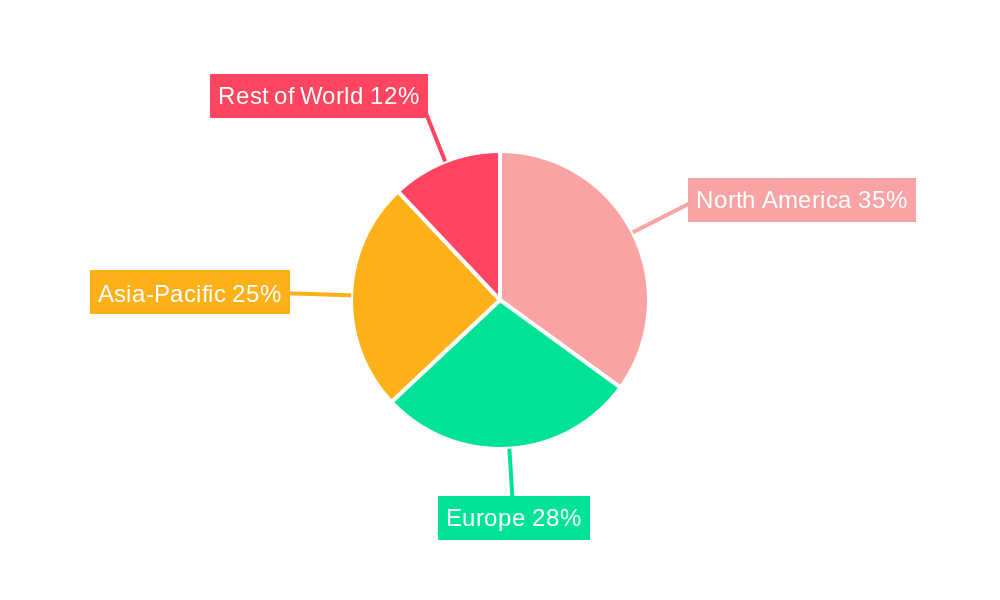
The dominant market for PVD coatings in 2025 is Asia-Pacific, driven by strong growth in economies like China and India, as well as the presence of a substantial manufacturing base. Within Asia-Pacific, China is the leading country due to its large automotive and electronics industries and government investments in infrastructure.
- Key Drivers for Asia-Pacific Dominance:
- Rapid industrialization and economic growth.
- High demand from automotive, electronics, and other manufacturing sectors.
- Government initiatives and subsidies to promote advanced manufacturing technologies.
- Growing investment in renewable energy, particularly solar power, drives demand for PVD-coated components.
The automotive segment holds the largest market share, followed by the electronics and industrial machinery sectors. This is attributed to the widespread adoption of PVD coatings for improving the durability, appearance, and functionality of automotive parts, electronic devices, and industrial equipment. Growth in other segments like aerospace and medical devices is expected to be significant in the forecast period.
Physical Vapor Deposition Coatings Industry Product Developments
Recent product innovations focus on enhancing coating properties such as hardness, wear resistance, corrosion resistance, and aesthetic appeal. New materials like nano-structured coatings and composite coatings are being developed to meet the specific needs of various applications. Technological advancements in PVD processes like High Power Impulse Magnetron Sputtering (HiPIMS) are improving coating quality and deposition rates. These innovations drive market expansion through enhanced product performance and new application possibilities, offering competitive advantages to companies that can adapt rapidly and deliver high-quality coatings consistently.
Report Scope & Segmentation Analysis
This report segments the PVD coatings market by coating type (e.g., titanium nitride, chromium nitride, etc.), application (e.g., automotive, electronics, aerospace, medical), and region (e.g., North America, Europe, Asia-Pacific, etc.). Each segment exhibits unique growth characteristics driven by factors specific to the application and region. For instance, the automotive segment is projected to grow at a CAGR of xx% during the forecast period, propelled by increasing vehicle production and demand for enhanced vehicle durability. The electronics segment is expected to witness significant growth due to the rising adoption of PVD-coated components in smartphones, computers, and other electronic devices. The competitive dynamics vary significantly across segments depending on the level of technological sophistication, application specialization, and barriers to entry.
Key Drivers of Physical Vapor Deposition Coatings Industry Growth
Several factors fuel the growth of the PVD coatings industry. Technological advancements lead to superior coating properties, enhanced process efficiency, and reduced costs. The increasing demand from various industries, particularly automotive, electronics, and aerospace, necessitates the use of durable, aesthetically pleasing, and functional coatings. Stringent environmental regulations push for the development and adoption of eco-friendly PVD coatings. Government policies supporting advanced manufacturing technologies and investment in infrastructure further stimulate market growth. Finally, the increasing adoption of PVD coatings in emerging applications such as renewable energy and medical devices drives market expansion.
Challenges in the Physical Vapor Deposition Coatings Industry Sector
The PVD coatings industry faces challenges like high initial capital investment costs for equipment and skilled labor. Fluctuations in raw material prices and supply chain disruptions can impact production costs and profitability. Intense competition and price pressure from alternative coating technologies necessitate continuous innovation and cost optimization. Stringent environmental regulations require compliance measures, adding to operational costs. Finally, the need to adapt to evolving industry standards and customer demands presents ongoing challenges. These factors can collectively reduce profit margins and market growth if not handled strategically.
Emerging Opportunities in Physical Vapor Deposition Coatings Industry
Several emerging opportunities exist for the PVD coatings industry. The growing demand for lightweight and high-strength materials in aerospace and automotive applications opens opportunities for specialized PVD coatings. The rise of renewable energy technologies, particularly solar power, presents a significant opportunity for PVD-coated components. Advances in medical device technology require advanced coatings, creating further growth potential. Finally, expansion into emerging markets with growing manufacturing sectors offers new avenues for growth. The development of sustainable and eco-friendly PVD techniques offers significant opportunities for environmentally conscious companies.
Leading Players in the Physical Vapor Deposition Coatings Industry Market
- Crystallume PVD
- HEF
- IHI Corporation
- Impact Coatings AB
- Inoxcolorz Private Limited
- KOLZER SRL
- Mitsubishi Materials Corporation
- OC Oerlikon Management AG
- Red Spot Paint & Varnish Company Inc
- Richter Precision Inc
- Sputtek Advanced Metallurgical Coatings
- Surface Modification Technologies
- TOCALO Co Ltd
- voestalpine eifeler Group
Key Developments in Physical Vapor Deposition Coatings Industry Industry
April 2022: Impact Coatings announced the establishment of a Chinese subsidiary, expanding its market reach and expertise in PVD coatings for hydrogen solutions within the Chinese market. This move signifies a strategic expansion into a rapidly growing market segment.
January 2022: IHI Ionbond invested significantly in decorative coating capacity, purchasing a Hauzer Flexicoat 1500 PVD system. This upgrade enhances their production capabilities for decorative coatings, enhancing their competitive advantage in this sector.
Strategic Outlook for Physical Vapor Deposition Coatings Industry Market
The PVD coatings market exhibits significant growth potential driven by technological advancements, increasing demand from diverse industries, and expansion into new applications. The focus on sustainability and eco-friendly solutions will shape future market trends. Companies that successfully integrate advanced technologies, optimize their production processes, and cater to evolving customer demands are poised for significant growth. Strategic partnerships and mergers and acquisitions will continue to shape the industry landscape. The development of specialized coatings for emerging applications will be crucial for success in this dynamic market.
Physical Vapor Deposition Coatings Industry Segmentation
-
1. Substrate
- 1.1. Metals
- 1.2. Plastics
- 1.3. Glass
-
2. Material Type
- 2.1. Metals (Includes Alloys)
- 2.2. Ceramics
- 2.3. Other Material Types
-
3. End User
- 3.1. Tools
-
3.2. Components
- 3.2.1. Aerospace and Defense
- 3.2.2. Automotive
- 3.2.3. Electronics and Semiconductors (Including Optics)
- 3.2.4. Power Generation
- 3.2.5. Other Co
Physical Vapor Deposition Coatings Industry Segmentation By Geography
-
1. Asia Pacific
- 1.1. China
- 1.2. India
- 1.3. Japan
- 1.4. South Korea
- 1.5. Malaysia
- 1.6. Thailand
- 1.7. Indonesia
- 1.8. Vietnam
- 1.9. Rest of Asia Pacific
-
2. North America
- 2.1. United States
- 2.2. Canada
- 2.3. Mexico
-
3. Europe
- 3.1. Germany
- 3.2. United Kingdom
- 3.3. France
- 3.4. Italy
- 3.5. Spain
- 3.6. Turkey
- 3.7. Russia
- 3.8. NORDIC Countries
- 3.9. Rest of Europe
-
4. South America
- 4.1. Brazil
- 4.2. Argentina
- 4.3. Colombia
- 4.4. Rest of South America
-
5. Middle East and Africa
- 5.1. Saudi Arabia
- 5.2. Nigeria
- 5.3. Qatar
- 5.4. Egypt
- 5.5. United Arab Emirates
- 5.6. South Africa
- 5.7. Rest of Middle East and Africa
Physical Vapor Deposition Coatings Industry REPORT HIGHLIGHTS
| Aspects | Details |
|---|---|
| Study Period | 2019-2033 |
| Base Year | 2024 |
| Estimated Year | 2025 |
| Forecast Period | 2025-2033 |
| Historical Period | 2019-2024 |
| Growth Rate | CAGR of 6.43% from 2019-2033 |
| Segmentation |
|
Table of Contents
- 1. Introduction
- 1.1. Research Scope
- 1.2. Market Segmentation
- 1.3. Research Methodology
- 1.4. Definitions and Assumptions
- 2. Executive Summary
- 2.1. Introduction
- 3. Market Dynamics
- 3.1. Introduction
- 3.2. Market Drivers
- 3.2.1. Demand from the Electronics Sector; Increasing Usage in Medical Industry; Other Drivers
- 3.3. Market Restrains
- 3.3.1. Demand from the Electronics Sector; Increasing Usage in Medical Industry; Other Drivers
- 3.4. Market Trends
- 3.4.1. The Automotive Industry is Expected to Dominate the Market Studied
- 4. Market Factor Analysis
- 4.1. Porters Five Forces
- 4.2. Supply/Value Chain
- 4.3. PESTEL analysis
- 4.4. Market Entropy
- 4.5. Patent/Trademark Analysis
- 5. Global Physical Vapor Deposition Coatings Industry Analysis, Insights and Forecast, 2019-2031
- 5.1. Market Analysis, Insights and Forecast - by Substrate
- 5.1.1. Metals
- 5.1.2. Plastics
- 5.1.3. Glass
- 5.2. Market Analysis, Insights and Forecast - by Material Type
- 5.2.1. Metals (Includes Alloys)
- 5.2.2. Ceramics
- 5.2.3. Other Material Types
- 5.3. Market Analysis, Insights and Forecast - by End User
- 5.3.1. Tools
- 5.3.2. Components
- 5.3.2.1. Aerospace and Defense
- 5.3.2.2. Automotive
- 5.3.2.3. Electronics and Semiconductors (Including Optics)
- 5.3.2.4. Power Generation
- 5.3.2.5. Other Co
- 5.4. Market Analysis, Insights and Forecast - by Region
- 5.4.1. Asia Pacific
- 5.4.2. North America
- 5.4.3. Europe
- 5.4.4. South America
- 5.4.5. Middle East and Africa
- 5.1. Market Analysis, Insights and Forecast - by Substrate
- 6. Asia Pacific Physical Vapor Deposition Coatings Industry Analysis, Insights and Forecast, 2019-2031
- 6.1. Market Analysis, Insights and Forecast - by Substrate
- 6.1.1. Metals
- 6.1.2. Plastics
- 6.1.3. Glass
- 6.2. Market Analysis, Insights and Forecast - by Material Type
- 6.2.1. Metals (Includes Alloys)
- 6.2.2. Ceramics
- 6.2.3. Other Material Types
- 6.3. Market Analysis, Insights and Forecast - by End User
- 6.3.1. Tools
- 6.3.2. Components
- 6.3.2.1. Aerospace and Defense
- 6.3.2.2. Automotive
- 6.3.2.3. Electronics and Semiconductors (Including Optics)
- 6.3.2.4. Power Generation
- 6.3.2.5. Other Co
- 6.1. Market Analysis, Insights and Forecast - by Substrate
- 7. North America Physical Vapor Deposition Coatings Industry Analysis, Insights and Forecast, 2019-2031
- 7.1. Market Analysis, Insights and Forecast - by Substrate
- 7.1.1. Metals
- 7.1.2. Plastics
- 7.1.3. Glass
- 7.2. Market Analysis, Insights and Forecast - by Material Type
- 7.2.1. Metals (Includes Alloys)
- 7.2.2. Ceramics
- 7.2.3. Other Material Types
- 7.3. Market Analysis, Insights and Forecast - by End User
- 7.3.1. Tools
- 7.3.2. Components
- 7.3.2.1. Aerospace and Defense
- 7.3.2.2. Automotive
- 7.3.2.3. Electronics and Semiconductors (Including Optics)
- 7.3.2.4. Power Generation
- 7.3.2.5. Other Co
- 7.1. Market Analysis, Insights and Forecast - by Substrate
- 8. Europe Physical Vapor Deposition Coatings Industry Analysis, Insights and Forecast, 2019-2031
- 8.1. Market Analysis, Insights and Forecast - by Substrate
- 8.1.1. Metals
- 8.1.2. Plastics
- 8.1.3. Glass
- 8.2. Market Analysis, Insights and Forecast - by Material Type
- 8.2.1. Metals (Includes Alloys)
- 8.2.2. Ceramics
- 8.2.3. Other Material Types
- 8.3. Market Analysis, Insights and Forecast - by End User
- 8.3.1. Tools
- 8.3.2. Components
- 8.3.2.1. Aerospace and Defense
- 8.3.2.2. Automotive
- 8.3.2.3. Electronics and Semiconductors (Including Optics)
- 8.3.2.4. Power Generation
- 8.3.2.5. Other Co
- 8.1. Market Analysis, Insights and Forecast - by Substrate
- 9. South America Physical Vapor Deposition Coatings Industry Analysis, Insights and Forecast, 2019-2031
- 9.1. Market Analysis, Insights and Forecast - by Substrate
- 9.1.1. Metals
- 9.1.2. Plastics
- 9.1.3. Glass
- 9.2. Market Analysis, Insights and Forecast - by Material Type
- 9.2.1. Metals (Includes Alloys)
- 9.2.2. Ceramics
- 9.2.3. Other Material Types
- 9.3. Market Analysis, Insights and Forecast - by End User
- 9.3.1. Tools
- 9.3.2. Components
- 9.3.2.1. Aerospace and Defense
- 9.3.2.2. Automotive
- 9.3.2.3. Electronics and Semiconductors (Including Optics)
- 9.3.2.4. Power Generation
- 9.3.2.5. Other Co
- 9.1. Market Analysis, Insights and Forecast - by Substrate
- 10. Middle East and Africa Physical Vapor Deposition Coatings Industry Analysis, Insights and Forecast, 2019-2031
- 10.1. Market Analysis, Insights and Forecast - by Substrate
- 10.1.1. Metals
- 10.1.2. Plastics
- 10.1.3. Glass
- 10.2. Market Analysis, Insights and Forecast - by Material Type
- 10.2.1. Metals (Includes Alloys)
- 10.2.2. Ceramics
- 10.2.3. Other Material Types
- 10.3. Market Analysis, Insights and Forecast - by End User
- 10.3.1. Tools
- 10.3.2. Components
- 10.3.2.1. Aerospace and Defense
- 10.3.2.2. Automotive
- 10.3.2.3. Electronics and Semiconductors (Including Optics)
- 10.3.2.4. Power Generation
- 10.3.2.5. Other Co
- 10.1. Market Analysis, Insights and Forecast - by Substrate
- 11. Competitive Analysis
- 11.1. Global Market Share Analysis 2024
- 11.2. Company Profiles
- 11.2.1 Crystallume PVD
- 11.2.1.1. Overview
- 11.2.1.2. Products
- 11.2.1.3. SWOT Analysis
- 11.2.1.4. Recent Developments
- 11.2.1.5. Financials (Based on Availability)
- 11.2.2 HEF
- 11.2.2.1. Overview
- 11.2.2.2. Products
- 11.2.2.3. SWOT Analysis
- 11.2.2.4. Recent Developments
- 11.2.2.5. Financials (Based on Availability)
- 11.2.3 IHI Corporation
- 11.2.3.1. Overview
- 11.2.3.2. Products
- 11.2.3.3. SWOT Analysis
- 11.2.3.4. Recent Developments
- 11.2.3.5. Financials (Based on Availability)
- 11.2.4 Impact Coatings AB
- 11.2.4.1. Overview
- 11.2.4.2. Products
- 11.2.4.3. SWOT Analysis
- 11.2.4.4. Recent Developments
- 11.2.4.5. Financials (Based on Availability)
- 11.2.5 Inoxcolorz Private Limited
- 11.2.5.1. Overview
- 11.2.5.2. Products
- 11.2.5.3. SWOT Analysis
- 11.2.5.4. Recent Developments
- 11.2.5.5. Financials (Based on Availability)
- 11.2.6 KOLZER SRL
- 11.2.6.1. Overview
- 11.2.6.2. Products
- 11.2.6.3. SWOT Analysis
- 11.2.6.4. Recent Developments
- 11.2.6.5. Financials (Based on Availability)
- 11.2.7 Mitsubishi Materials Corporation
- 11.2.7.1. Overview
- 11.2.7.2. Products
- 11.2.7.3. SWOT Analysis
- 11.2.7.4. Recent Developments
- 11.2.7.5. Financials (Based on Availability)
- 11.2.8 OC Oerlikon Management AG
- 11.2.8.1. Overview
- 11.2.8.2. Products
- 11.2.8.3. SWOT Analysis
- 11.2.8.4. Recent Developments
- 11.2.8.5. Financials (Based on Availability)
- 11.2.9 Red Spot Paint & Varnish Company Inc
- 11.2.9.1. Overview
- 11.2.9.2. Products
- 11.2.9.3. SWOT Analysis
- 11.2.9.4. Recent Developments
- 11.2.9.5. Financials (Based on Availability)
- 11.2.10 Richter Precision Inc
- 11.2.10.1. Overview
- 11.2.10.2. Products
- 11.2.10.3. SWOT Analysis
- 11.2.10.4. Recent Developments
- 11.2.10.5. Financials (Based on Availability)
- 11.2.11 Sputtek Advanced Metallurgical Coatings
- 11.2.11.1. Overview
- 11.2.11.2. Products
- 11.2.11.3. SWOT Analysis
- 11.2.11.4. Recent Developments
- 11.2.11.5. Financials (Based on Availability)
- 11.2.12 Surface Modification Technologies
- 11.2.12.1. Overview
- 11.2.12.2. Products
- 11.2.12.3. SWOT Analysis
- 11.2.12.4. Recent Developments
- 11.2.12.5. Financials (Based on Availability)
- 11.2.13 TOCALO Co Ltd
- 11.2.13.1. Overview
- 11.2.13.2. Products
- 11.2.13.3. SWOT Analysis
- 11.2.13.4. Recent Developments
- 11.2.13.5. Financials (Based on Availability)
- 11.2.14 voestalpine eifeler Group*List Not Exhaustive
- 11.2.14.1. Overview
- 11.2.14.2. Products
- 11.2.14.3. SWOT Analysis
- 11.2.14.4. Recent Developments
- 11.2.14.5. Financials (Based on Availability)
- 11.2.1 Crystallume PVD
List of Figures
- Figure 1: Global Physical Vapor Deposition Coatings Industry Revenue Breakdown (Million, %) by Region 2024 & 2032
- Figure 2: Global Physical Vapor Deposition Coatings Industry Volume Breakdown (Billion, %) by Region 2024 & 2032
- Figure 3: Asia Pacific Physical Vapor Deposition Coatings Industry Revenue (Million), by Substrate 2024 & 2032
- Figure 4: Asia Pacific Physical Vapor Deposition Coatings Industry Volume (Billion), by Substrate 2024 & 2032
- Figure 5: Asia Pacific Physical Vapor Deposition Coatings Industry Revenue Share (%), by Substrate 2024 & 2032
- Figure 6: Asia Pacific Physical Vapor Deposition Coatings Industry Volume Share (%), by Substrate 2024 & 2032
- Figure 7: Asia Pacific Physical Vapor Deposition Coatings Industry Revenue (Million), by Material Type 2024 & 2032
- Figure 8: Asia Pacific Physical Vapor Deposition Coatings Industry Volume (Billion), by Material Type 2024 & 2032
- Figure 9: Asia Pacific Physical Vapor Deposition Coatings Industry Revenue Share (%), by Material Type 2024 & 2032
- Figure 10: Asia Pacific Physical Vapor Deposition Coatings Industry Volume Share (%), by Material Type 2024 & 2032
- Figure 11: Asia Pacific Physical Vapor Deposition Coatings Industry Revenue (Million), by End User 2024 & 2032
- Figure 12: Asia Pacific Physical Vapor Deposition Coatings Industry Volume (Billion), by End User 2024 & 2032
- Figure 13: Asia Pacific Physical Vapor Deposition Coatings Industry Revenue Share (%), by End User 2024 & 2032
- Figure 14: Asia Pacific Physical Vapor Deposition Coatings Industry Volume Share (%), by End User 2024 & 2032
- Figure 15: Asia Pacific Physical Vapor Deposition Coatings Industry Revenue (Million), by Country 2024 & 2032
- Figure 16: Asia Pacific Physical Vapor Deposition Coatings Industry Volume (Billion), by Country 2024 & 2032
- Figure 17: Asia Pacific Physical Vapor Deposition Coatings Industry Revenue Share (%), by Country 2024 & 2032
- Figure 18: Asia Pacific Physical Vapor Deposition Coatings Industry Volume Share (%), by Country 2024 & 2032
- Figure 19: North America Physical Vapor Deposition Coatings Industry Revenue (Million), by Substrate 2024 & 2032
- Figure 20: North America Physical Vapor Deposition Coatings Industry Volume (Billion), by Substrate 2024 & 2032
- Figure 21: North America Physical Vapor Deposition Coatings Industry Revenue Share (%), by Substrate 2024 & 2032
- Figure 22: North America Physical Vapor Deposition Coatings Industry Volume Share (%), by Substrate 2024 & 2032
- Figure 23: North America Physical Vapor Deposition Coatings Industry Revenue (Million), by Material Type 2024 & 2032
- Figure 24: North America Physical Vapor Deposition Coatings Industry Volume (Billion), by Material Type 2024 & 2032
- Figure 25: North America Physical Vapor Deposition Coatings Industry Revenue Share (%), by Material Type 2024 & 2032
- Figure 26: North America Physical Vapor Deposition Coatings Industry Volume Share (%), by Material Type 2024 & 2032
- Figure 27: North America Physical Vapor Deposition Coatings Industry Revenue (Million), by End User 2024 & 2032
- Figure 28: North America Physical Vapor Deposition Coatings Industry Volume (Billion), by End User 2024 & 2032
- Figure 29: North America Physical Vapor Deposition Coatings Industry Revenue Share (%), by End User 2024 & 2032
- Figure 30: North America Physical Vapor Deposition Coatings Industry Volume Share (%), by End User 2024 & 2032
- Figure 31: North America Physical Vapor Deposition Coatings Industry Revenue (Million), by Country 2024 & 2032
- Figure 32: North America Physical Vapor Deposition Coatings Industry Volume (Billion), by Country 2024 & 2032
- Figure 33: North America Physical Vapor Deposition Coatings Industry Revenue Share (%), by Country 2024 & 2032
- Figure 34: North America Physical Vapor Deposition Coatings Industry Volume Share (%), by Country 2024 & 2032
- Figure 35: Europe Physical Vapor Deposition Coatings Industry Revenue (Million), by Substrate 2024 & 2032
- Figure 36: Europe Physical Vapor Deposition Coatings Industry Volume (Billion), by Substrate 2024 & 2032
- Figure 37: Europe Physical Vapor Deposition Coatings Industry Revenue Share (%), by Substrate 2024 & 2032
- Figure 38: Europe Physical Vapor Deposition Coatings Industry Volume Share (%), by Substrate 2024 & 2032
- Figure 39: Europe Physical Vapor Deposition Coatings Industry Revenue (Million), by Material Type 2024 & 2032
- Figure 40: Europe Physical Vapor Deposition Coatings Industry Volume (Billion), by Material Type 2024 & 2032
- Figure 41: Europe Physical Vapor Deposition Coatings Industry Revenue Share (%), by Material Type 2024 & 2032
- Figure 42: Europe Physical Vapor Deposition Coatings Industry Volume Share (%), by Material Type 2024 & 2032
- Figure 43: Europe Physical Vapor Deposition Coatings Industry Revenue (Million), by End User 2024 & 2032
- Figure 44: Europe Physical Vapor Deposition Coatings Industry Volume (Billion), by End User 2024 & 2032
- Figure 45: Europe Physical Vapor Deposition Coatings Industry Revenue Share (%), by End User 2024 & 2032
- Figure 46: Europe Physical Vapor Deposition Coatings Industry Volume Share (%), by End User 2024 & 2032
- Figure 47: Europe Physical Vapor Deposition Coatings Industry Revenue (Million), by Country 2024 & 2032
- Figure 48: Europe Physical Vapor Deposition Coatings Industry Volume (Billion), by Country 2024 & 2032
- Figure 49: Europe Physical Vapor Deposition Coatings Industry Revenue Share (%), by Country 2024 & 2032
- Figure 50: Europe Physical Vapor Deposition Coatings Industry Volume Share (%), by Country 2024 & 2032
- Figure 51: South America Physical Vapor Deposition Coatings Industry Revenue (Million), by Substrate 2024 & 2032
- Figure 52: South America Physical Vapor Deposition Coatings Industry Volume (Billion), by Substrate 2024 & 2032
- Figure 53: South America Physical Vapor Deposition Coatings Industry Revenue Share (%), by Substrate 2024 & 2032
- Figure 54: South America Physical Vapor Deposition Coatings Industry Volume Share (%), by Substrate 2024 & 2032
- Figure 55: South America Physical Vapor Deposition Coatings Industry Revenue (Million), by Material Type 2024 & 2032
- Figure 56: South America Physical Vapor Deposition Coatings Industry Volume (Billion), by Material Type 2024 & 2032
- Figure 57: South America Physical Vapor Deposition Coatings Industry Revenue Share (%), by Material Type 2024 & 2032
- Figure 58: South America Physical Vapor Deposition Coatings Industry Volume Share (%), by Material Type 2024 & 2032
- Figure 59: South America Physical Vapor Deposition Coatings Industry Revenue (Million), by End User 2024 & 2032
- Figure 60: South America Physical Vapor Deposition Coatings Industry Volume (Billion), by End User 2024 & 2032
- Figure 61: South America Physical Vapor Deposition Coatings Industry Revenue Share (%), by End User 2024 & 2032
- Figure 62: South America Physical Vapor Deposition Coatings Industry Volume Share (%), by End User 2024 & 2032
- Figure 63: South America Physical Vapor Deposition Coatings Industry Revenue (Million), by Country 2024 & 2032
- Figure 64: South America Physical Vapor Deposition Coatings Industry Volume (Billion), by Country 2024 & 2032
- Figure 65: South America Physical Vapor Deposition Coatings Industry Revenue Share (%), by Country 2024 & 2032
- Figure 66: South America Physical Vapor Deposition Coatings Industry Volume Share (%), by Country 2024 & 2032
- Figure 67: Middle East and Africa Physical Vapor Deposition Coatings Industry Revenue (Million), by Substrate 2024 & 2032
- Figure 68: Middle East and Africa Physical Vapor Deposition Coatings Industry Volume (Billion), by Substrate 2024 & 2032
- Figure 69: Middle East and Africa Physical Vapor Deposition Coatings Industry Revenue Share (%), by Substrate 2024 & 2032
- Figure 70: Middle East and Africa Physical Vapor Deposition Coatings Industry Volume Share (%), by Substrate 2024 & 2032
- Figure 71: Middle East and Africa Physical Vapor Deposition Coatings Industry Revenue (Million), by Material Type 2024 & 2032
- Figure 72: Middle East and Africa Physical Vapor Deposition Coatings Industry Volume (Billion), by Material Type 2024 & 2032
- Figure 73: Middle East and Africa Physical Vapor Deposition Coatings Industry Revenue Share (%), by Material Type 2024 & 2032
- Figure 74: Middle East and Africa Physical Vapor Deposition Coatings Industry Volume Share (%), by Material Type 2024 & 2032
- Figure 75: Middle East and Africa Physical Vapor Deposition Coatings Industry Revenue (Million), by End User 2024 & 2032
- Figure 76: Middle East and Africa Physical Vapor Deposition Coatings Industry Volume (Billion), by End User 2024 & 2032
- Figure 77: Middle East and Africa Physical Vapor Deposition Coatings Industry Revenue Share (%), by End User 2024 & 2032
- Figure 78: Middle East and Africa Physical Vapor Deposition Coatings Industry Volume Share (%), by End User 2024 & 2032
- Figure 79: Middle East and Africa Physical Vapor Deposition Coatings Industry Revenue (Million), by Country 2024 & 2032
- Figure 80: Middle East and Africa Physical Vapor Deposition Coatings Industry Volume (Billion), by Country 2024 & 2032
- Figure 81: Middle East and Africa Physical Vapor Deposition Coatings Industry Revenue Share (%), by Country 2024 & 2032
- Figure 82: Middle East and Africa Physical Vapor Deposition Coatings Industry Volume Share (%), by Country 2024 & 2032
List of Tables
- Table 1: Global Physical Vapor Deposition Coatings Industry Revenue Million Forecast, by Region 2019 & 2032
- Table 2: Global Physical Vapor Deposition Coatings Industry Volume Billion Forecast, by Region 2019 & 2032
- Table 3: Global Physical Vapor Deposition Coatings Industry Revenue Million Forecast, by Substrate 2019 & 2032
- Table 4: Global Physical Vapor Deposition Coatings Industry Volume Billion Forecast, by Substrate 2019 & 2032
- Table 5: Global Physical Vapor Deposition Coatings Industry Revenue Million Forecast, by Material Type 2019 & 2032
- Table 6: Global Physical Vapor Deposition Coatings Industry Volume Billion Forecast, by Material Type 2019 & 2032
- Table 7: Global Physical Vapor Deposition Coatings Industry Revenue Million Forecast, by End User 2019 & 2032
- Table 8: Global Physical Vapor Deposition Coatings Industry Volume Billion Forecast, by End User 2019 & 2032
- Table 9: Global Physical Vapor Deposition Coatings Industry Revenue Million Forecast, by Region 2019 & 2032
- Table 10: Global Physical Vapor Deposition Coatings Industry Volume Billion Forecast, by Region 2019 & 2032
- Table 11: Global Physical Vapor Deposition Coatings Industry Revenue Million Forecast, by Substrate 2019 & 2032
- Table 12: Global Physical Vapor Deposition Coatings Industry Volume Billion Forecast, by Substrate 2019 & 2032
- Table 13: Global Physical Vapor Deposition Coatings Industry Revenue Million Forecast, by Material Type 2019 & 2032
- Table 14: Global Physical Vapor Deposition Coatings Industry Volume Billion Forecast, by Material Type 2019 & 2032
- Table 15: Global Physical Vapor Deposition Coatings Industry Revenue Million Forecast, by End User 2019 & 2032
- Table 16: Global Physical Vapor Deposition Coatings Industry Volume Billion Forecast, by End User 2019 & 2032
- Table 17: Global Physical Vapor Deposition Coatings Industry Revenue Million Forecast, by Country 2019 & 2032
- Table 18: Global Physical Vapor Deposition Coatings Industry Volume Billion Forecast, by Country 2019 & 2032
- Table 19: China Physical Vapor Deposition Coatings Industry Revenue (Million) Forecast, by Application 2019 & 2032
- Table 20: China Physical Vapor Deposition Coatings Industry Volume (Billion) Forecast, by Application 2019 & 2032
- Table 21: India Physical Vapor Deposition Coatings Industry Revenue (Million) Forecast, by Application 2019 & 2032
- Table 22: India Physical Vapor Deposition Coatings Industry Volume (Billion) Forecast, by Application 2019 & 2032
- Table 23: Japan Physical Vapor Deposition Coatings Industry Revenue (Million) Forecast, by Application 2019 & 2032
- Table 24: Japan Physical Vapor Deposition Coatings Industry Volume (Billion) Forecast, by Application 2019 & 2032
- Table 25: South Korea Physical Vapor Deposition Coatings Industry Revenue (Million) Forecast, by Application 2019 & 2032
- Table 26: South Korea Physical Vapor Deposition Coatings Industry Volume (Billion) Forecast, by Application 2019 & 2032
- Table 27: Malaysia Physical Vapor Deposition Coatings Industry Revenue (Million) Forecast, by Application 2019 & 2032
- Table 28: Malaysia Physical Vapor Deposition Coatings Industry Volume (Billion) Forecast, by Application 2019 & 2032
- Table 29: Thailand Physical Vapor Deposition Coatings Industry Revenue (Million) Forecast, by Application 2019 & 2032
- Table 30: Thailand Physical Vapor Deposition Coatings Industry Volume (Billion) Forecast, by Application 2019 & 2032
- Table 31: Indonesia Physical Vapor Deposition Coatings Industry Revenue (Million) Forecast, by Application 2019 & 2032
- Table 32: Indonesia Physical Vapor Deposition Coatings Industry Volume (Billion) Forecast, by Application 2019 & 2032
- Table 33: Vietnam Physical Vapor Deposition Coatings Industry Revenue (Million) Forecast, by Application 2019 & 2032
- Table 34: Vietnam Physical Vapor Deposition Coatings Industry Volume (Billion) Forecast, by Application 2019 & 2032
- Table 35: Rest of Asia Pacific Physical Vapor Deposition Coatings Industry Revenue (Million) Forecast, by Application 2019 & 2032
- Table 36: Rest of Asia Pacific Physical Vapor Deposition Coatings Industry Volume (Billion) Forecast, by Application 2019 & 2032
- Table 37: Global Physical Vapor Deposition Coatings Industry Revenue Million Forecast, by Substrate 2019 & 2032
- Table 38: Global Physical Vapor Deposition Coatings Industry Volume Billion Forecast, by Substrate 2019 & 2032
- Table 39: Global Physical Vapor Deposition Coatings Industry Revenue Million Forecast, by Material Type 2019 & 2032
- Table 40: Global Physical Vapor Deposition Coatings Industry Volume Billion Forecast, by Material Type 2019 & 2032
- Table 41: Global Physical Vapor Deposition Coatings Industry Revenue Million Forecast, by End User 2019 & 2032
- Table 42: Global Physical Vapor Deposition Coatings Industry Volume Billion Forecast, by End User 2019 & 2032
- Table 43: Global Physical Vapor Deposition Coatings Industry Revenue Million Forecast, by Country 2019 & 2032
- Table 44: Global Physical Vapor Deposition Coatings Industry Volume Billion Forecast, by Country 2019 & 2032
- Table 45: United States Physical Vapor Deposition Coatings Industry Revenue (Million) Forecast, by Application 2019 & 2032
- Table 46: United States Physical Vapor Deposition Coatings Industry Volume (Billion) Forecast, by Application 2019 & 2032
- Table 47: Canada Physical Vapor Deposition Coatings Industry Revenue (Million) Forecast, by Application 2019 & 2032
- Table 48: Canada Physical Vapor Deposition Coatings Industry Volume (Billion) Forecast, by Application 2019 & 2032
- Table 49: Mexico Physical Vapor Deposition Coatings Industry Revenue (Million) Forecast, by Application 2019 & 2032
- Table 50: Mexico Physical Vapor Deposition Coatings Industry Volume (Billion) Forecast, by Application 2019 & 2032
- Table 51: Global Physical Vapor Deposition Coatings Industry Revenue Million Forecast, by Substrate 2019 & 2032
- Table 52: Global Physical Vapor Deposition Coatings Industry Volume Billion Forecast, by Substrate 2019 & 2032
- Table 53: Global Physical Vapor Deposition Coatings Industry Revenue Million Forecast, by Material Type 2019 & 2032
- Table 54: Global Physical Vapor Deposition Coatings Industry Volume Billion Forecast, by Material Type 2019 & 2032
- Table 55: Global Physical Vapor Deposition Coatings Industry Revenue Million Forecast, by End User 2019 & 2032
- Table 56: Global Physical Vapor Deposition Coatings Industry Volume Billion Forecast, by End User 2019 & 2032
- Table 57: Global Physical Vapor Deposition Coatings Industry Revenue Million Forecast, by Country 2019 & 2032
- Table 58: Global Physical Vapor Deposition Coatings Industry Volume Billion Forecast, by Country 2019 & 2032
- Table 59: Germany Physical Vapor Deposition Coatings Industry Revenue (Million) Forecast, by Application 2019 & 2032
- Table 60: Germany Physical Vapor Deposition Coatings Industry Volume (Billion) Forecast, by Application 2019 & 2032
- Table 61: United Kingdom Physical Vapor Deposition Coatings Industry Revenue (Million) Forecast, by Application 2019 & 2032
- Table 62: United Kingdom Physical Vapor Deposition Coatings Industry Volume (Billion) Forecast, by Application 2019 & 2032
- Table 63: France Physical Vapor Deposition Coatings Industry Revenue (Million) Forecast, by Application 2019 & 2032
- Table 64: France Physical Vapor Deposition Coatings Industry Volume (Billion) Forecast, by Application 2019 & 2032
- Table 65: Italy Physical Vapor Deposition Coatings Industry Revenue (Million) Forecast, by Application 2019 & 2032
- Table 66: Italy Physical Vapor Deposition Coatings Industry Volume (Billion) Forecast, by Application 2019 & 2032
- Table 67: Spain Physical Vapor Deposition Coatings Industry Revenue (Million) Forecast, by Application 2019 & 2032
- Table 68: Spain Physical Vapor Deposition Coatings Industry Volume (Billion) Forecast, by Application 2019 & 2032
- Table 69: Turkey Physical Vapor Deposition Coatings Industry Revenue (Million) Forecast, by Application 2019 & 2032
- Table 70: Turkey Physical Vapor Deposition Coatings Industry Volume (Billion) Forecast, by Application 2019 & 2032
- Table 71: Russia Physical Vapor Deposition Coatings Industry Revenue (Million) Forecast, by Application 2019 & 2032
- Table 72: Russia Physical Vapor Deposition Coatings Industry Volume (Billion) Forecast, by Application 2019 & 2032
- Table 73: NORDIC Countries Physical Vapor Deposition Coatings Industry Revenue (Million) Forecast, by Application 2019 & 2032
- Table 74: NORDIC Countries Physical Vapor Deposition Coatings Industry Volume (Billion) Forecast, by Application 2019 & 2032
- Table 75: Rest of Europe Physical Vapor Deposition Coatings Industry Revenue (Million) Forecast, by Application 2019 & 2032
- Table 76: Rest of Europe Physical Vapor Deposition Coatings Industry Volume (Billion) Forecast, by Application 2019 & 2032
- Table 77: Global Physical Vapor Deposition Coatings Industry Revenue Million Forecast, by Substrate 2019 & 2032
- Table 78: Global Physical Vapor Deposition Coatings Industry Volume Billion Forecast, by Substrate 2019 & 2032
- Table 79: Global Physical Vapor Deposition Coatings Industry Revenue Million Forecast, by Material Type 2019 & 2032
- Table 80: Global Physical Vapor Deposition Coatings Industry Volume Billion Forecast, by Material Type 2019 & 2032
- Table 81: Global Physical Vapor Deposition Coatings Industry Revenue Million Forecast, by End User 2019 & 2032
- Table 82: Global Physical Vapor Deposition Coatings Industry Volume Billion Forecast, by End User 2019 & 2032
- Table 83: Global Physical Vapor Deposition Coatings Industry Revenue Million Forecast, by Country 2019 & 2032
- Table 84: Global Physical Vapor Deposition Coatings Industry Volume Billion Forecast, by Country 2019 & 2032
- Table 85: Brazil Physical Vapor Deposition Coatings Industry Revenue (Million) Forecast, by Application 2019 & 2032
- Table 86: Brazil Physical Vapor Deposition Coatings Industry Volume (Billion) Forecast, by Application 2019 & 2032
- Table 87: Argentina Physical Vapor Deposition Coatings Industry Revenue (Million) Forecast, by Application 2019 & 2032
- Table 88: Argentina Physical Vapor Deposition Coatings Industry Volume (Billion) Forecast, by Application 2019 & 2032
- Table 89: Colombia Physical Vapor Deposition Coatings Industry Revenue (Million) Forecast, by Application 2019 & 2032
- Table 90: Colombia Physical Vapor Deposition Coatings Industry Volume (Billion) Forecast, by Application 2019 & 2032
- Table 91: Rest of South America Physical Vapor Deposition Coatings Industry Revenue (Million) Forecast, by Application 2019 & 2032
- Table 92: Rest of South America Physical Vapor Deposition Coatings Industry Volume (Billion) Forecast, by Application 2019 & 2032
- Table 93: Global Physical Vapor Deposition Coatings Industry Revenue Million Forecast, by Substrate 2019 & 2032
- Table 94: Global Physical Vapor Deposition Coatings Industry Volume Billion Forecast, by Substrate 2019 & 2032
- Table 95: Global Physical Vapor Deposition Coatings Industry Revenue Million Forecast, by Material Type 2019 & 2032
- Table 96: Global Physical Vapor Deposition Coatings Industry Volume Billion Forecast, by Material Type 2019 & 2032
- Table 97: Global Physical Vapor Deposition Coatings Industry Revenue Million Forecast, by End User 2019 & 2032
- Table 98: Global Physical Vapor Deposition Coatings Industry Volume Billion Forecast, by End User 2019 & 2032
- Table 99: Global Physical Vapor Deposition Coatings Industry Revenue Million Forecast, by Country 2019 & 2032
- Table 100: Global Physical Vapor Deposition Coatings Industry Volume Billion Forecast, by Country 2019 & 2032
- Table 101: Saudi Arabia Physical Vapor Deposition Coatings Industry Revenue (Million) Forecast, by Application 2019 & 2032
- Table 102: Saudi Arabia Physical Vapor Deposition Coatings Industry Volume (Billion) Forecast, by Application 2019 & 2032
- Table 103: Nigeria Physical Vapor Deposition Coatings Industry Revenue (Million) Forecast, by Application 2019 & 2032
- Table 104: Nigeria Physical Vapor Deposition Coatings Industry Volume (Billion) Forecast, by Application 2019 & 2032
- Table 105: Qatar Physical Vapor Deposition Coatings Industry Revenue (Million) Forecast, by Application 2019 & 2032
- Table 106: Qatar Physical Vapor Deposition Coatings Industry Volume (Billion) Forecast, by Application 2019 & 2032
- Table 107: Egypt Physical Vapor Deposition Coatings Industry Revenue (Million) Forecast, by Application 2019 & 2032
- Table 108: Egypt Physical Vapor Deposition Coatings Industry Volume (Billion) Forecast, by Application 2019 & 2032
- Table 109: United Arab Emirates Physical Vapor Deposition Coatings Industry Revenue (Million) Forecast, by Application 2019 & 2032
- Table 110: United Arab Emirates Physical Vapor Deposition Coatings Industry Volume (Billion) Forecast, by Application 2019 & 2032
- Table 111: South Africa Physical Vapor Deposition Coatings Industry Revenue (Million) Forecast, by Application 2019 & 2032
- Table 112: South Africa Physical Vapor Deposition Coatings Industry Volume (Billion) Forecast, by Application 2019 & 2032
- Table 113: Rest of Middle East and Africa Physical Vapor Deposition Coatings Industry Revenue (Million) Forecast, by Application 2019 & 2032
- Table 114: Rest of Middle East and Africa Physical Vapor Deposition Coatings Industry Volume (Billion) Forecast, by Application 2019 & 2032
Frequently Asked Questions
1. What is the projected Compound Annual Growth Rate (CAGR) of the Physical Vapor Deposition Coatings Industry?
The projected CAGR is approximately 6.43%.
2. Which companies are prominent players in the Physical Vapor Deposition Coatings Industry?
Key companies in the market include Crystallume PVD, HEF, IHI Corporation, Impact Coatings AB, Inoxcolorz Private Limited, KOLZER SRL, Mitsubishi Materials Corporation, OC Oerlikon Management AG, Red Spot Paint & Varnish Company Inc, Richter Precision Inc, Sputtek Advanced Metallurgical Coatings, Surface Modification Technologies, TOCALO Co Ltd, voestalpine eifeler Group*List Not Exhaustive.
3. What are the main segments of the Physical Vapor Deposition Coatings Industry?
The market segments include Substrate, Material Type, End User.
4. Can you provide details about the market size?
The market size is estimated to be USD 10.46 Million as of 2022.
5. What are some drivers contributing to market growth?
Demand from the Electronics Sector; Increasing Usage in Medical Industry; Other Drivers.
6. What are the notable trends driving market growth?
The Automotive Industry is Expected to Dominate the Market Studied.
7. Are there any restraints impacting market growth?
Demand from the Electronics Sector; Increasing Usage in Medical Industry; Other Drivers.
8. Can you provide examples of recent developments in the market?
April 2022: Impact Coatings announced the establishment of a Chinese subsidiary with headquarters in Shanghai. The opening is expected to disseminate Impact Coatings' market-leading expertise in PVD coatings for hydrogen solutions and increase the availability of coating services solutions to Chinese customers in the hydrogen value chain.January 2022: IHI Ionbond announced its significant investment in decorative coating capacity by purchasing a Hauzer Flexicoat 1500 PVD system. This large-scale coating system has an impressive coating zone of 0.9 m diameter by 1.5 m height. It is a welcome addition to the growing capabilities of the Ionbond component coating facility at Consett County Durham.
9. What pricing options are available for accessing the report?
Pricing options include single-user, multi-user, and enterprise licenses priced at USD 4750, USD 5250, and USD 8750 respectively.
10. Is the market size provided in terms of value or volume?
The market size is provided in terms of value, measured in Million and volume, measured in Billion.
11. Are there any specific market keywords associated with the report?
Yes, the market keyword associated with the report is "Physical Vapor Deposition Coatings Industry," which aids in identifying and referencing the specific market segment covered.
12. How do I determine which pricing option suits my needs best?
The pricing options vary based on user requirements and access needs. Individual users may opt for single-user licenses, while businesses requiring broader access may choose multi-user or enterprise licenses for cost-effective access to the report.
13. Are there any additional resources or data provided in the Physical Vapor Deposition Coatings Industry report?
While the report offers comprehensive insights, it's advisable to review the specific contents or supplementary materials provided to ascertain if additional resources or data are available.
14. How can I stay updated on further developments or reports in the Physical Vapor Deposition Coatings Industry?
To stay informed about further developments, trends, and reports in the Physical Vapor Deposition Coatings Industry, consider subscribing to industry newsletters, following relevant companies and organizations, or regularly checking reputable industry news sources and publications.
Methodology
Step 1 - Identification of Relevant Samples Size from Population Database


Step 2 - Approaches for Defining Global Market Size (Value, Volume* & Price*)

Note*: In applicable scenarios
Step 3 - Data Sources
Primary Research
- Web Analytics
- Survey Reports
- Research Institute
- Latest Research Reports
- Opinion Leaders
Secondary Research
- Annual Reports
- White Paper
- Latest Press Release
- Industry Association
- Paid Database
- Investor Presentations

Step 4 - Data Triangulation
Involves using different sources of information in order to increase the validity of a study
These sources are likely to be stakeholders in a program - participants, other researchers, program staff, other community members, and so on.
Then we put all data in single framework & apply various statistical tools to find out the dynamic on the market.
During the analysis stage, feedback from the stakeholder groups would be compared to determine areas of agreement as well as areas of divergence


