
Key Insights
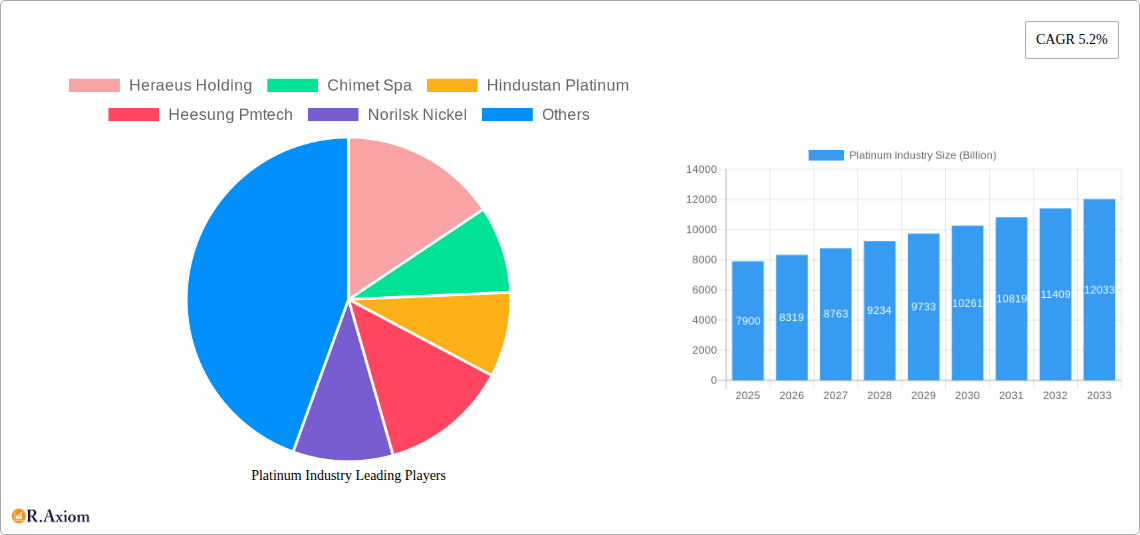
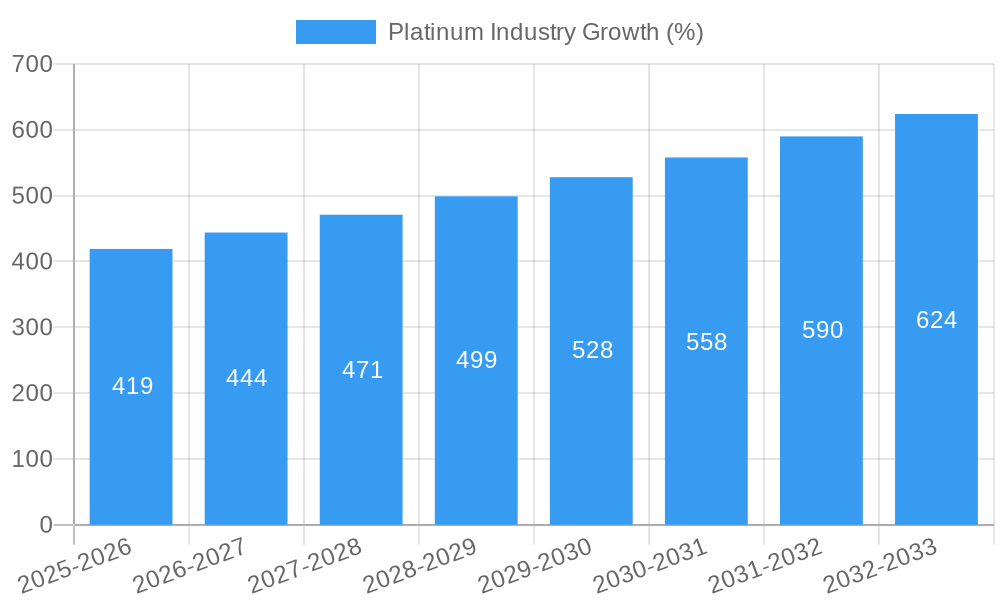
The global platinum market, valued at $7.9 billion in 2025, is projected to experience robust growth, exhibiting a compound annual growth rate (CAGR) of 5.2% from 2025 to 2033. This expansion is driven by several key factors. The automotive industry's increasing demand for catalytic converters in gasoline vehicles, particularly in emerging economies experiencing rapid motorization, significantly contributes to platinum consumption. Furthermore, the burgeoning electronics sector, with its reliance on platinum in various components, fuels market growth. Growth in the jewelry sector, particularly in regions with rising disposable incomes and a preference for platinum's durability and prestige, further bolsters demand. Finally, the chemical industry's use of platinum as a catalyst in various processes, including the production of pharmaceuticals and specialty chemicals, adds to the overall market momentum. However, price volatility, primarily influenced by fluctuating supply from major producing countries and global economic conditions, presents a significant restraint. Additionally, the ongoing transition towards electric vehicles poses a potential long-term challenge, although advancements in fuel cell technology, utilizing platinum, offer a counterbalance. Market segmentation reveals significant contributions from various forms (metal, powder, alloys) and sources (primary, secondary), with applications spanning diverse sectors, including exhaust systems, jewelry, chemical catalysts, glass production, and electronics. The competitive landscape is dominated by major players like Heraeus Holding, Johnson Matthey, and several prominent mining companies, each vying for market share through innovation and strategic partnerships.
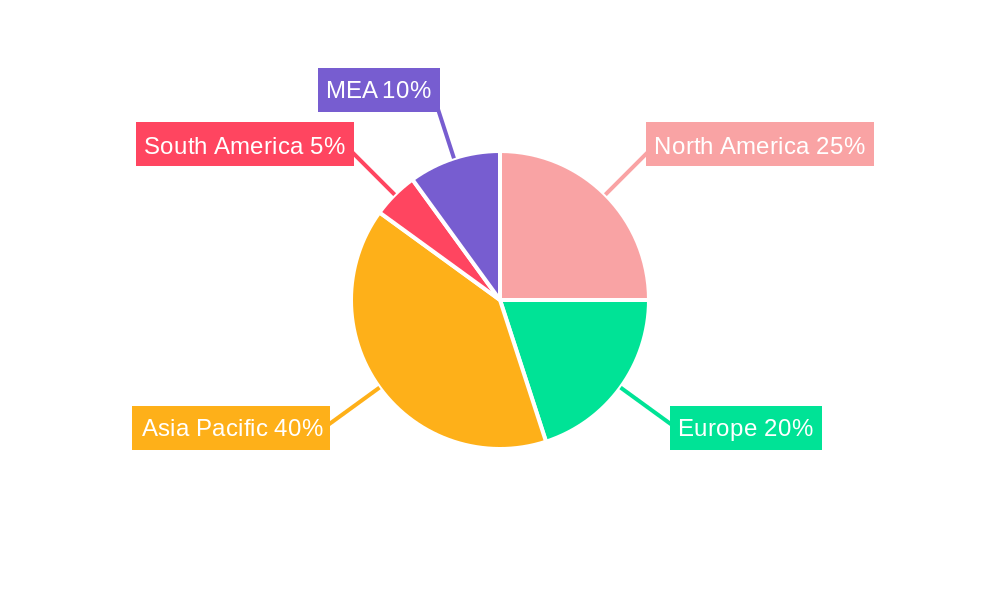
The platinum market's geographical distribution is expected to show variations in growth rates. While North America and Europe maintain substantial market shares, fuelled by established automotive and industrial sectors, the Asia-Pacific region, particularly China and India, is anticipated to witness the most significant growth, mirroring their rapid economic expansion and increasing industrialization. South America and the Middle East & Africa also present promising growth opportunities, albeit at potentially slower paces compared to Asia-Pacific. The forecast period (2025-2033) anticipates continued growth, influenced by technological advancements, emerging applications, and the evolving geopolitical landscape. Analyzing the historical data (2019-2024) reveals consistent, albeit fluctuating, growth, setting a positive trajectory for the future. Continuous monitoring of these factors – technological innovations, regulatory changes, and economic fluctuations – is crucial for accurate market forecasting and strategic planning within the platinum industry.
Platinum Industry: A Comprehensive Market Report (2019-2033)
This in-depth report provides a comprehensive analysis of the global platinum industry, covering market size, segmentation, key players, industry trends, and future growth prospects from 2019 to 2033. With a base year of 2025 and an estimated year of 2025, this report offers invaluable insights for industry stakeholders, investors, and businesses seeking to understand and capitalize on the opportunities within this dynamic market. The total market value is projected to reach Billions by 2033.
Platinum Industry Market Concentration & Innovation
This section analyzes the competitive landscape of the platinum industry, examining market concentration, innovation drivers, regulatory frameworks, and significant M&A activities. The study period covers 2019-2024 (historical) and 2025-2033 (forecast).
The global platinum market exhibits a moderately concentrated structure, with a few major players holding significant market share. For instance, Anglo American Platinum Limited and Impala Platinum Holdings Limited collectively account for an estimated xx% of the global market. However, a number of smaller players also contribute significantly to supply and innovation. Market share data for each major player is detailed in the full report, along with an analysis of their respective strategies.
Innovation in the platinum industry is driven by several factors, including the development of new applications for platinum in emerging technologies (e.g., fuel cells, electronics) and advancements in refining and processing techniques to improve efficiency and reduce environmental impact. Stringent environmental regulations are also pushing companies to adopt sustainable practices. The increasing demand for platinum in diverse sectors like automotive catalysts, jewelry, and chemical catalysts fuels continuous innovation.
Mergers and acquisitions (M&A) activities play a significant role in shaping the market dynamics. Recent transactions, such as Impala Platinum’s planned acquisition of Royal Bafokeng Platinum (April 2022), highlight the industry’s consolidation trend and the desire to control greater resources and market share. The total value of M&A deals within the period reached Billions.
Platinum Industry Industry Trends & Insights
This section delves into the key trends and insights shaping the platinum industry's growth trajectory. Market growth is primarily driven by increasing demand from the automotive and jewelry sectors, technological advancements in various applications (e.g., fuel cells, medical devices), and economic growth in key regions. The report details a Compound Annual Growth Rate (CAGR) of xx% for the forecast period (2025-2033), and identifies specific applications with high market penetration rates.
The platinum industry is characterized by intense competition among major players. This competition is driven by factors including pricing pressures, technological advancements, and the pursuit of market share. The report examines the competitive landscape in detail, highlighting each company’s key strategies and market positioning. Technological disruptions, such as the development of alternative catalysts, present both challenges and opportunities for the industry. The report analyzes the potential impact of these disruptions on market dynamics. Consumer preferences, particularly the growing demand for sustainable and ethically sourced platinum, are also influencing the industry’s trajectory.
Dominant Markets & Segments in Platinum Industry
This section identifies the leading regions, countries, and segments within the platinum industry, based on form (metal, powder, alloys), source (primary, secondary), and application (exhaust systems, jewelry, chemical catalysts, glass production, electronics, other applications).
Leading Regions/Countries: The report identifies South Africa, Russia, and Zimbabwe as dominant players in platinum production, holding a combined market share of xx%. Strong economic growth in key Asian markets, particularly China and India, are projected to drive significant demand growth in the coming years.
Dominant Form: The demand for platinum metal and alloys remains significantly higher than that of platinum powder. However, the powder segment is projected to experience faster growth due to its application in emerging technologies.
Dominant Source: Primary platinum accounts for xx% of the market and is expected to retain its dominance in the forecast period, though the secondary market is likely to experience moderate growth due to improved recycling technology and the environmental focus on recycling.
Dominant Application: The automotive exhaust systems segment continues to be the largest end-use application of platinum, owing to emission regulations for automobiles. However, growing demand in the electronics and chemical catalyst industries is anticipated to contribute to significant growth in these segments.
Detailed analyses of the key drivers for each segment’s dominance are presented in the complete report. These include economic policies supporting the industry, government regulations, and infrastructural developments.
Platinum Industry Product Developments
Recent years have witnessed significant advancements in platinum-based product technologies. The development of high-performance catalysts with improved efficiency and durability for automotive applications and the use of platinum nanoparticles in various applications like cancer therapy have enhanced the industry’s market offerings. These innovations demonstrate the ongoing efforts to improve platinum's performance and expand its applications, leading to increased demand. Moreover, sustainable production methods and the development of recycled platinum products are gaining traction to comply with environmental regulations and consumer preferences.
Report Scope & Segmentation Analysis
This report segments the platinum market comprehensively by form (metal, powder, alloys), source (primary, secondary), and application (exhaust systems, jewelry, chemical catalysts, glass production, electronics, other applications). Each segment's market size, growth projections, and competitive dynamics are analyzed. The report provides detailed analysis of growth projections for each segment, projecting strong growth in several niche applications. Competitive dynamics within each segment are analyzed, highlighting key players and their strategies.
Key Drivers of Platinum Industry Growth
The platinum industry's growth is propelled by several factors. The increasing demand for platinum in automotive catalysts due to stringent emission regulations is a significant driver. The growing use of platinum in jewelry and electronics is also a major contributor. Technological advancements resulting in new applications for platinum in fuel cells, medical devices, and other emerging technologies further stimulate market growth. Furthermore, economic growth in developing economies is driving increased consumption of platinum.
Challenges in the Platinum Industry Sector
The platinum industry faces several challenges. Fluctuations in platinum prices due to supply-demand imbalances can impact profitability. Environmental regulations and concerns regarding sustainable mining practices pose significant challenges for companies. Competition from alternative materials and technologies, along with potential supply chain disruptions, are also substantial concerns for the industry. These challenges collectively impact the industry's growth trajectory.
Emerging Opportunities in Platinum Industry
Several emerging opportunities exist within the platinum industry. The increasing demand for platinum in fuel cells for renewable energy applications and in hydrogen technologies is a significant opportunity. The growing use of platinum in medical devices and other emerging health care applications presents significant potential for growth. Further exploration of new applications and the advancement of recycling technologies to address environmental concerns can unlock new revenue streams and contribute to sustainable growth.
Leading Players in the Platinum Industry Market
- Heraeus Holding
- Chimet Spa
- Hindustan Platinum
- Heesung Pmtech
- Norilsk Nickel
- Impala Platinum Holdings Limited
- Northam Platinum Holdings Limited
- Nihon Material Co Ltd
- Johnson Matthey
- Sibanye-stillwater
- Anglo American Platinum Limited
Key Developments in Platinum Industry Industry
- April 2022: Impala Platinum Holdings Limited plans to acquire a 100% stake in Royal Bafokeng Platinum, creating one of the world's largest platinum miners and consolidating Impala's market position.
- February 2022: Heraeus Holding and BASF SE formed a joint venture, BASF Heraeus Metal Resource Co. Ltd., to recover precious metals, including platinum, from spent automotive catalysts in China.
Strategic Outlook for Platinum Industry Market
The platinum industry is poised for continued growth, driven by increasing demand from various sectors and technological advancements. The focus on sustainable practices and the development of new applications will shape the industry's future. Companies that can adapt to changing market dynamics, invest in innovation, and implement sustainable practices will be well-positioned to capitalize on the emerging opportunities in this dynamic sector. The market presents significant potential for growth in the coming years, with the industry expected to continue its expansion and innovation.
Platinum Industry Segmentation
-
1. Application
- 1.1. Exhaust Systems
- 1.2. Jewelry
- 1.3. Chemical Catalysts
- 1.4. Glass Production
- 1.5. Electronics
- 1.6. Other Applications
Platinum Industry Segmentation By Geography
-
1. Asia Pacific
- 1.1. China
- 1.2. India
- 1.3. Japan
- 1.4. South Korea
- 1.5. Rest of Asia Pacific
-
2. North America
- 2.1. United States
- 2.2. Canada
- 2.3. Mexico
-
3. Europe
- 3.1. Germany
- 3.2. United Kingdom
- 3.3. Italy
- 3.4. France
- 3.5. Rest of Europe
-
4. Rest Of The World
- 4.1. South America
- 4.2. Middle East and Africa
Platinum Industry REPORT HIGHLIGHTS
| Aspects | Details |
|---|---|
| Study Period | 2019-2033 |
| Base Year | 2024 |
| Estimated Year | 2025 |
| Forecast Period | 2025-2033 |
| Historical Period | 2019-2024 |
| Growth Rate | CAGR of 5.2% from 2019-2033 |
| Segmentation |
|
Table of Contents
- 1. Introduction
- 1.1. Research Scope
- 1.2. Market Segmentation
- 1.3. Research Methodology
- 1.4. Definitions and Assumptions
- 2. Executive Summary
- 2.1. Introduction
- 3. Market Dynamics
- 3.1. Introduction
- 3.2. Market Drivers
- 3.2.1. Increasing Usage in the Industrial Applications; Growing Demand for Applications in the Automotive Industry
- 3.3. Market Restrains
- 3.3.1. High Product Prices
- 3.4. Market Trends
- 3.4.1. Growing Demand for Exhaust Systems in Automobile Industry
- 4. Market Factor Analysis
- 4.1. Porters Five Forces
- 4.2. Supply/Value Chain
- 4.3. PESTEL analysis
- 4.4. Market Entropy
- 4.5. Patent/Trademark Analysis
- 5. Global Platinum Industry Analysis, Insights and Forecast, 2019-2031
- 5.1. Market Analysis, Insights and Forecast - by Application
- 5.1.1. Exhaust Systems
- 5.1.2. Jewelry
- 5.1.3. Chemical Catalysts
- 5.1.4. Glass Production
- 5.1.5. Electronics
- 5.1.6. Other Applications
- 5.2. Market Analysis, Insights and Forecast - by Region
- 5.2.1. Asia Pacific
- 5.2.2. North America
- 5.2.3. Europe
- 5.2.4. Rest Of The World
- 5.1. Market Analysis, Insights and Forecast - by Application
- 6. Asia Pacific Platinum Industry Analysis, Insights and Forecast, 2019-2031
- 6.1. Market Analysis, Insights and Forecast - by Application
- 6.1.1. Exhaust Systems
- 6.1.2. Jewelry
- 6.1.3. Chemical Catalysts
- 6.1.4. Glass Production
- 6.1.5. Electronics
- 6.1.6. Other Applications
- 6.1. Market Analysis, Insights and Forecast - by Application
- 7. North America Platinum Industry Analysis, Insights and Forecast, 2019-2031
- 7.1. Market Analysis, Insights and Forecast - by Application
- 7.1.1. Exhaust Systems
- 7.1.2. Jewelry
- 7.1.3. Chemical Catalysts
- 7.1.4. Glass Production
- 7.1.5. Electronics
- 7.1.6. Other Applications
- 7.1. Market Analysis, Insights and Forecast - by Application
- 8. Europe Platinum Industry Analysis, Insights and Forecast, 2019-2031
- 8.1. Market Analysis, Insights and Forecast - by Application
- 8.1.1. Exhaust Systems
- 8.1.2. Jewelry
- 8.1.3. Chemical Catalysts
- 8.1.4. Glass Production
- 8.1.5. Electronics
- 8.1.6. Other Applications
- 8.1. Market Analysis, Insights and Forecast - by Application
- 9. Rest Of The World Platinum Industry Analysis, Insights and Forecast, 2019-2031
- 9.1. Market Analysis, Insights and Forecast - by Application
- 9.1.1. Exhaust Systems
- 9.1.2. Jewelry
- 9.1.3. Chemical Catalysts
- 9.1.4. Glass Production
- 9.1.5. Electronics
- 9.1.6. Other Applications
- 9.1. Market Analysis, Insights and Forecast - by Application
- 10. North America Platinum Industry Analysis, Insights and Forecast, 2019-2031
- 10.1. Market Analysis, Insights and Forecast - By Country/Sub-region
- 10.1.1 United States
- 10.1.2 Canada
- 10.1.3 Mexico
- 11. Europe Platinum Industry Analysis, Insights and Forecast, 2019-2031
- 11.1. Market Analysis, Insights and Forecast - By Country/Sub-region
- 11.1.1 Germany
- 11.1.2 France
- 11.1.3 Italy
- 11.1.4 United Kingdom
- 11.1.5 Netherlands
- 11.1.6 Rest of Europe
- 12. Asia Pacific Platinum Industry Analysis, Insights and Forecast, 2019-2031
- 12.1. Market Analysis, Insights and Forecast - By Country/Sub-region
- 12.1.1 China
- 12.1.2 Japan
- 12.1.3 India
- 12.1.4 South Korea
- 12.1.5 Taiwan
- 12.1.6 Australia
- 12.1.7 Rest of Asia-Pacific
- 13. South America Platinum Industry Analysis, Insights and Forecast, 2019-2031
- 13.1. Market Analysis, Insights and Forecast - By Country/Sub-region
- 13.1.1 Brazil
- 13.1.2 Argentina
- 13.1.3 Rest of South America
- 14. MEA Platinum Industry Analysis, Insights and Forecast, 2019-2031
- 14.1. Market Analysis, Insights and Forecast - By Country/Sub-region
- 14.1.1 Middle East
- 14.1.2 Africa
- 15. Competitive Analysis
- 15.1. Global Market Share Analysis 2024
- 15.2. Company Profiles
- 15.2.1 Heraeus Holding
- 15.2.1.1. Overview
- 15.2.1.2. Products
- 15.2.1.3. SWOT Analysis
- 15.2.1.4. Recent Developments
- 15.2.1.5. Financials (Based on Availability)
- 15.2.2 Chimet Spa
- 15.2.2.1. Overview
- 15.2.2.2. Products
- 15.2.2.3. SWOT Analysis
- 15.2.2.4. Recent Developments
- 15.2.2.5. Financials (Based on Availability)
- 15.2.3 Hindustan Platinum
- 15.2.3.1. Overview
- 15.2.3.2. Products
- 15.2.3.3. SWOT Analysis
- 15.2.3.4. Recent Developments
- 15.2.3.5. Financials (Based on Availability)
- 15.2.4 Heesung Pmtech
- 15.2.4.1. Overview
- 15.2.4.2. Products
- 15.2.4.3. SWOT Analysis
- 15.2.4.4. Recent Developments
- 15.2.4.5. Financials (Based on Availability)
- 15.2.5 Norilsk Nickel
- 15.2.5.1. Overview
- 15.2.5.2. Products
- 15.2.5.3. SWOT Analysis
- 15.2.5.4. Recent Developments
- 15.2.5.5. Financials (Based on Availability)
- 15.2.6 Impala Platinum Holdings Limited
- 15.2.6.1. Overview
- 15.2.6.2. Products
- 15.2.6.3. SWOT Analysis
- 15.2.6.4. Recent Developments
- 15.2.6.5. Financials (Based on Availability)
- 15.2.7 Northam Platinum Holdings Limited
- 15.2.7.1. Overview
- 15.2.7.2. Products
- 15.2.7.3. SWOT Analysis
- 15.2.7.4. Recent Developments
- 15.2.7.5. Financials (Based on Availability)
- 15.2.8 Nihon Material Co Ltd
- 15.2.8.1. Overview
- 15.2.8.2. Products
- 15.2.8.3. SWOT Analysis
- 15.2.8.4. Recent Developments
- 15.2.8.5. Financials (Based on Availability)
- 15.2.9 Johnson Matthey
- 15.2.9.1. Overview
- 15.2.9.2. Products
- 15.2.9.3. SWOT Analysis
- 15.2.9.4. Recent Developments
- 15.2.9.5. Financials (Based on Availability)
- 15.2.10 Sibanye-stillwater
- 15.2.10.1. Overview
- 15.2.10.2. Products
- 15.2.10.3. SWOT Analysis
- 15.2.10.4. Recent Developments
- 15.2.10.5. Financials (Based on Availability)
- 15.2.11 Anglo American Platinum Limited
- 15.2.11.1. Overview
- 15.2.11.2. Products
- 15.2.11.3. SWOT Analysis
- 15.2.11.4. Recent Developments
- 15.2.11.5. Financials (Based on Availability)
- 15.2.1 Heraeus Holding
List of Figures
- Figure 1: Global Platinum Industry Revenue Breakdown (Billion, %) by Region 2024 & 2032
- Figure 2: Global Platinum Industry Volume Breakdown (K Tons, %) by Region 2024 & 2032
- Figure 3: North America Platinum Industry Revenue (Billion), by Country 2024 & 2032
- Figure 4: North America Platinum Industry Volume (K Tons), by Country 2024 & 2032
- Figure 5: North America Platinum Industry Revenue Share (%), by Country 2024 & 2032
- Figure 6: North America Platinum Industry Volume Share (%), by Country 2024 & 2032
- Figure 7: Europe Platinum Industry Revenue (Billion), by Country 2024 & 2032
- Figure 8: Europe Platinum Industry Volume (K Tons), by Country 2024 & 2032
- Figure 9: Europe Platinum Industry Revenue Share (%), by Country 2024 & 2032
- Figure 10: Europe Platinum Industry Volume Share (%), by Country 2024 & 2032
- Figure 11: Asia Pacific Platinum Industry Revenue (Billion), by Country 2024 & 2032
- Figure 12: Asia Pacific Platinum Industry Volume (K Tons), by Country 2024 & 2032
- Figure 13: Asia Pacific Platinum Industry Revenue Share (%), by Country 2024 & 2032
- Figure 14: Asia Pacific Platinum Industry Volume Share (%), by Country 2024 & 2032
- Figure 15: South America Platinum Industry Revenue (Billion), by Country 2024 & 2032
- Figure 16: South America Platinum Industry Volume (K Tons), by Country 2024 & 2032
- Figure 17: South America Platinum Industry Revenue Share (%), by Country 2024 & 2032
- Figure 18: South America Platinum Industry Volume Share (%), by Country 2024 & 2032
- Figure 19: MEA Platinum Industry Revenue (Billion), by Country 2024 & 2032
- Figure 20: MEA Platinum Industry Volume (K Tons), by Country 2024 & 2032
- Figure 21: MEA Platinum Industry Revenue Share (%), by Country 2024 & 2032
- Figure 22: MEA Platinum Industry Volume Share (%), by Country 2024 & 2032
- Figure 23: Asia Pacific Platinum Industry Revenue (Billion), by Application 2024 & 2032
- Figure 24: Asia Pacific Platinum Industry Volume (K Tons), by Application 2024 & 2032
- Figure 25: Asia Pacific Platinum Industry Revenue Share (%), by Application 2024 & 2032
- Figure 26: Asia Pacific Platinum Industry Volume Share (%), by Application 2024 & 2032
- Figure 27: Asia Pacific Platinum Industry Revenue (Billion), by Country 2024 & 2032
- Figure 28: Asia Pacific Platinum Industry Volume (K Tons), by Country 2024 & 2032
- Figure 29: Asia Pacific Platinum Industry Revenue Share (%), by Country 2024 & 2032
- Figure 30: Asia Pacific Platinum Industry Volume Share (%), by Country 2024 & 2032
- Figure 31: North America Platinum Industry Revenue (Billion), by Application 2024 & 2032
- Figure 32: North America Platinum Industry Volume (K Tons), by Application 2024 & 2032
- Figure 33: North America Platinum Industry Revenue Share (%), by Application 2024 & 2032
- Figure 34: North America Platinum Industry Volume Share (%), by Application 2024 & 2032
- Figure 35: North America Platinum Industry Revenue (Billion), by Country 2024 & 2032
- Figure 36: North America Platinum Industry Volume (K Tons), by Country 2024 & 2032
- Figure 37: North America Platinum Industry Revenue Share (%), by Country 2024 & 2032
- Figure 38: North America Platinum Industry Volume Share (%), by Country 2024 & 2032
- Figure 39: Europe Platinum Industry Revenue (Billion), by Application 2024 & 2032
- Figure 40: Europe Platinum Industry Volume (K Tons), by Application 2024 & 2032
- Figure 41: Europe Platinum Industry Revenue Share (%), by Application 2024 & 2032
- Figure 42: Europe Platinum Industry Volume Share (%), by Application 2024 & 2032
- Figure 43: Europe Platinum Industry Revenue (Billion), by Country 2024 & 2032
- Figure 44: Europe Platinum Industry Volume (K Tons), by Country 2024 & 2032
- Figure 45: Europe Platinum Industry Revenue Share (%), by Country 2024 & 2032
- Figure 46: Europe Platinum Industry Volume Share (%), by Country 2024 & 2032
- Figure 47: Rest Of The World Platinum Industry Revenue (Billion), by Application 2024 & 2032
- Figure 48: Rest Of The World Platinum Industry Volume (K Tons), by Application 2024 & 2032
- Figure 49: Rest Of The World Platinum Industry Revenue Share (%), by Application 2024 & 2032
- Figure 50: Rest Of The World Platinum Industry Volume Share (%), by Application 2024 & 2032
- Figure 51: Rest Of The World Platinum Industry Revenue (Billion), by Country 2024 & 2032
- Figure 52: Rest Of The World Platinum Industry Volume (K Tons), by Country 2024 & 2032
- Figure 53: Rest Of The World Platinum Industry Revenue Share (%), by Country 2024 & 2032
- Figure 54: Rest Of The World Platinum Industry Volume Share (%), by Country 2024 & 2032
List of Tables
- Table 1: Global Platinum Industry Revenue Billion Forecast, by Region 2019 & 2032
- Table 2: Global Platinum Industry Volume K Tons Forecast, by Region 2019 & 2032
- Table 3: Global Platinum Industry Revenue Billion Forecast, by Application 2019 & 2032
- Table 4: Global Platinum Industry Volume K Tons Forecast, by Application 2019 & 2032
- Table 5: Global Platinum Industry Revenue Billion Forecast, by Region 2019 & 2032
- Table 6: Global Platinum Industry Volume K Tons Forecast, by Region 2019 & 2032
- Table 7: Global Platinum Industry Revenue Billion Forecast, by Country 2019 & 2032
- Table 8: Global Platinum Industry Volume K Tons Forecast, by Country 2019 & 2032
- Table 9: United States Platinum Industry Revenue (Billion) Forecast, by Application 2019 & 2032
- Table 10: United States Platinum Industry Volume (K Tons) Forecast, by Application 2019 & 2032
- Table 11: Canada Platinum Industry Revenue (Billion) Forecast, by Application 2019 & 2032
- Table 12: Canada Platinum Industry Volume (K Tons) Forecast, by Application 2019 & 2032
- Table 13: Mexico Platinum Industry Revenue (Billion) Forecast, by Application 2019 & 2032
- Table 14: Mexico Platinum Industry Volume (K Tons) Forecast, by Application 2019 & 2032
- Table 15: Global Platinum Industry Revenue Billion Forecast, by Country 2019 & 2032
- Table 16: Global Platinum Industry Volume K Tons Forecast, by Country 2019 & 2032
- Table 17: Germany Platinum Industry Revenue (Billion) Forecast, by Application 2019 & 2032
- Table 18: Germany Platinum Industry Volume (K Tons) Forecast, by Application 2019 & 2032
- Table 19: France Platinum Industry Revenue (Billion) Forecast, by Application 2019 & 2032
- Table 20: France Platinum Industry Volume (K Tons) Forecast, by Application 2019 & 2032
- Table 21: Italy Platinum Industry Revenue (Billion) Forecast, by Application 2019 & 2032
- Table 22: Italy Platinum Industry Volume (K Tons) Forecast, by Application 2019 & 2032
- Table 23: United Kingdom Platinum Industry Revenue (Billion) Forecast, by Application 2019 & 2032
- Table 24: United Kingdom Platinum Industry Volume (K Tons) Forecast, by Application 2019 & 2032
- Table 25: Netherlands Platinum Industry Revenue (Billion) Forecast, by Application 2019 & 2032
- Table 26: Netherlands Platinum Industry Volume (K Tons) Forecast, by Application 2019 & 2032
- Table 27: Rest of Europe Platinum Industry Revenue (Billion) Forecast, by Application 2019 & 2032
- Table 28: Rest of Europe Platinum Industry Volume (K Tons) Forecast, by Application 2019 & 2032
- Table 29: Global Platinum Industry Revenue Billion Forecast, by Country 2019 & 2032
- Table 30: Global Platinum Industry Volume K Tons Forecast, by Country 2019 & 2032
- Table 31: China Platinum Industry Revenue (Billion) Forecast, by Application 2019 & 2032
- Table 32: China Platinum Industry Volume (K Tons) Forecast, by Application 2019 & 2032
- Table 33: Japan Platinum Industry Revenue (Billion) Forecast, by Application 2019 & 2032
- Table 34: Japan Platinum Industry Volume (K Tons) Forecast, by Application 2019 & 2032
- Table 35: India Platinum Industry Revenue (Billion) Forecast, by Application 2019 & 2032
- Table 36: India Platinum Industry Volume (K Tons) Forecast, by Application 2019 & 2032
- Table 37: South Korea Platinum Industry Revenue (Billion) Forecast, by Application 2019 & 2032
- Table 38: South Korea Platinum Industry Volume (K Tons) Forecast, by Application 2019 & 2032
- Table 39: Taiwan Platinum Industry Revenue (Billion) Forecast, by Application 2019 & 2032
- Table 40: Taiwan Platinum Industry Volume (K Tons) Forecast, by Application 2019 & 2032
- Table 41: Australia Platinum Industry Revenue (Billion) Forecast, by Application 2019 & 2032
- Table 42: Australia Platinum Industry Volume (K Tons) Forecast, by Application 2019 & 2032
- Table 43: Rest of Asia-Pacific Platinum Industry Revenue (Billion) Forecast, by Application 2019 & 2032
- Table 44: Rest of Asia-Pacific Platinum Industry Volume (K Tons) Forecast, by Application 2019 & 2032
- Table 45: Global Platinum Industry Revenue Billion Forecast, by Country 2019 & 2032
- Table 46: Global Platinum Industry Volume K Tons Forecast, by Country 2019 & 2032
- Table 47: Brazil Platinum Industry Revenue (Billion) Forecast, by Application 2019 & 2032
- Table 48: Brazil Platinum Industry Volume (K Tons) Forecast, by Application 2019 & 2032
- Table 49: Argentina Platinum Industry Revenue (Billion) Forecast, by Application 2019 & 2032
- Table 50: Argentina Platinum Industry Volume (K Tons) Forecast, by Application 2019 & 2032
- Table 51: Rest of South America Platinum Industry Revenue (Billion) Forecast, by Application 2019 & 2032
- Table 52: Rest of South America Platinum Industry Volume (K Tons) Forecast, by Application 2019 & 2032
- Table 53: Global Platinum Industry Revenue Billion Forecast, by Country 2019 & 2032
- Table 54: Global Platinum Industry Volume K Tons Forecast, by Country 2019 & 2032
- Table 55: Middle East Platinum Industry Revenue (Billion) Forecast, by Application 2019 & 2032
- Table 56: Middle East Platinum Industry Volume (K Tons) Forecast, by Application 2019 & 2032
- Table 57: Africa Platinum Industry Revenue (Billion) Forecast, by Application 2019 & 2032
- Table 58: Africa Platinum Industry Volume (K Tons) Forecast, by Application 2019 & 2032
- Table 59: Global Platinum Industry Revenue Billion Forecast, by Application 2019 & 2032
- Table 60: Global Platinum Industry Volume K Tons Forecast, by Application 2019 & 2032
- Table 61: Global Platinum Industry Revenue Billion Forecast, by Country 2019 & 2032
- Table 62: Global Platinum Industry Volume K Tons Forecast, by Country 2019 & 2032
- Table 63: China Platinum Industry Revenue (Billion) Forecast, by Application 2019 & 2032
- Table 64: China Platinum Industry Volume (K Tons) Forecast, by Application 2019 & 2032
- Table 65: India Platinum Industry Revenue (Billion) Forecast, by Application 2019 & 2032
- Table 66: India Platinum Industry Volume (K Tons) Forecast, by Application 2019 & 2032
- Table 67: Japan Platinum Industry Revenue (Billion) Forecast, by Application 2019 & 2032
- Table 68: Japan Platinum Industry Volume (K Tons) Forecast, by Application 2019 & 2032
- Table 69: South Korea Platinum Industry Revenue (Billion) Forecast, by Application 2019 & 2032
- Table 70: South Korea Platinum Industry Volume (K Tons) Forecast, by Application 2019 & 2032
- Table 71: Rest of Asia Pacific Platinum Industry Revenue (Billion) Forecast, by Application 2019 & 2032
- Table 72: Rest of Asia Pacific Platinum Industry Volume (K Tons) Forecast, by Application 2019 & 2032
- Table 73: Global Platinum Industry Revenue Billion Forecast, by Application 2019 & 2032
- Table 74: Global Platinum Industry Volume K Tons Forecast, by Application 2019 & 2032
- Table 75: Global Platinum Industry Revenue Billion Forecast, by Country 2019 & 2032
- Table 76: Global Platinum Industry Volume K Tons Forecast, by Country 2019 & 2032
- Table 77: United States Platinum Industry Revenue (Billion) Forecast, by Application 2019 & 2032
- Table 78: United States Platinum Industry Volume (K Tons) Forecast, by Application 2019 & 2032
- Table 79: Canada Platinum Industry Revenue (Billion) Forecast, by Application 2019 & 2032
- Table 80: Canada Platinum Industry Volume (K Tons) Forecast, by Application 2019 & 2032
- Table 81: Mexico Platinum Industry Revenue (Billion) Forecast, by Application 2019 & 2032
- Table 82: Mexico Platinum Industry Volume (K Tons) Forecast, by Application 2019 & 2032
- Table 83: Global Platinum Industry Revenue Billion Forecast, by Application 2019 & 2032
- Table 84: Global Platinum Industry Volume K Tons Forecast, by Application 2019 & 2032
- Table 85: Global Platinum Industry Revenue Billion Forecast, by Country 2019 & 2032
- Table 86: Global Platinum Industry Volume K Tons Forecast, by Country 2019 & 2032
- Table 87: Germany Platinum Industry Revenue (Billion) Forecast, by Application 2019 & 2032
- Table 88: Germany Platinum Industry Volume (K Tons) Forecast, by Application 2019 & 2032
- Table 89: United Kingdom Platinum Industry Revenue (Billion) Forecast, by Application 2019 & 2032
- Table 90: United Kingdom Platinum Industry Volume (K Tons) Forecast, by Application 2019 & 2032
- Table 91: Italy Platinum Industry Revenue (Billion) Forecast, by Application 2019 & 2032
- Table 92: Italy Platinum Industry Volume (K Tons) Forecast, by Application 2019 & 2032
- Table 93: France Platinum Industry Revenue (Billion) Forecast, by Application 2019 & 2032
- Table 94: France Platinum Industry Volume (K Tons) Forecast, by Application 2019 & 2032
- Table 95: Rest of Europe Platinum Industry Revenue (Billion) Forecast, by Application 2019 & 2032
- Table 96: Rest of Europe Platinum Industry Volume (K Tons) Forecast, by Application 2019 & 2032
- Table 97: Global Platinum Industry Revenue Billion Forecast, by Application 2019 & 2032
- Table 98: Global Platinum Industry Volume K Tons Forecast, by Application 2019 & 2032
- Table 99: Global Platinum Industry Revenue Billion Forecast, by Country 2019 & 2032
- Table 100: Global Platinum Industry Volume K Tons Forecast, by Country 2019 & 2032
- Table 101: South America Platinum Industry Revenue (Billion) Forecast, by Application 2019 & 2032
- Table 102: South America Platinum Industry Volume (K Tons) Forecast, by Application 2019 & 2032
- Table 103: Middle East and Africa Platinum Industry Revenue (Billion) Forecast, by Application 2019 & 2032
- Table 104: Middle East and Africa Platinum Industry Volume (K Tons) Forecast, by Application 2019 & 2032
Frequently Asked Questions
1. What is the projected Compound Annual Growth Rate (CAGR) of the Platinum Industry?
The projected CAGR is approximately 5.2%.
2. Which companies are prominent players in the Platinum Industry?
Key companies in the market include Heraeus Holding, Chimet Spa, Hindustan Platinum, Heesung Pmtech, Norilsk Nickel, Impala Platinum Holdings Limited, Northam Platinum Holdings Limited, Nihon Material Co Ltd, Johnson Matthey, Sibanye-stillwater, Anglo American Platinum Limited.
3. What are the main segments of the Platinum Industry?
The market segments include Application.
4. Can you provide details about the market size?
The market size is estimated to be USD 7.9 Billion as of 2022.
5. What are some drivers contributing to market growth?
Increasing Usage in the Industrial Applications; Growing Demand for Applications in the Automotive Industry.
6. What are the notable trends driving market growth?
Growing Demand for Exhaust Systems in Automobile Industry.
7. Are there any restraints impacting market growth?
High Product Prices.
8. Can you provide examples of recent developments in the market?
April 2022: Impala Platinum Holdings Limited plans to acquire a 100% stake in the South Africa-based platinum manufacturer Royal Bafokeng Platinum. It already owns 35.3% of the shares of Royal Bafokeng Platinum. The 100% acquisition will pave the way for creating one of the biggest platinum metal miners worldwide. It will also help Impala consolidate its market position.
9. What pricing options are available for accessing the report?
Pricing options include single-user, multi-user, and enterprise licenses priced at USD 4750, USD 5250, and USD 8750 respectively.
10. Is the market size provided in terms of value or volume?
The market size is provided in terms of value, measured in Billion and volume, measured in K Tons.
11. Are there any specific market keywords associated with the report?
Yes, the market keyword associated with the report is "Platinum Industry," which aids in identifying and referencing the specific market segment covered.
12. How do I determine which pricing option suits my needs best?
The pricing options vary based on user requirements and access needs. Individual users may opt for single-user licenses, while businesses requiring broader access may choose multi-user or enterprise licenses for cost-effective access to the report.
13. Are there any additional resources or data provided in the Platinum Industry report?
While the report offers comprehensive insights, it's advisable to review the specific contents or supplementary materials provided to ascertain if additional resources or data are available.
14. How can I stay updated on further developments or reports in the Platinum Industry?
To stay informed about further developments, trends, and reports in the Platinum Industry, consider subscribing to industry newsletters, following relevant companies and organizations, or regularly checking reputable industry news sources and publications.
Methodology
Step 1 - Identification of Relevant Samples Size from Population Database


Step 2 - Approaches for Defining Global Market Size (Value, Volume* & Price*)

Note*: In applicable scenarios
Step 3 - Data Sources
Primary Research
- Web Analytics
- Survey Reports
- Research Institute
- Latest Research Reports
- Opinion Leaders
Secondary Research
- Annual Reports
- White Paper
- Latest Press Release
- Industry Association
- Paid Database
- Investor Presentations

Step 4 - Data Triangulation
Involves using different sources of information in order to increase the validity of a study
These sources are likely to be stakeholders in a program - participants, other researchers, program staff, other community members, and so on.
Then we put all data in single framework & apply various statistical tools to find out the dynamic on the market.
During the analysis stage, feedback from the stakeholder groups would be compared to determine areas of agreement as well as areas of divergence


