
Key Insights
The global production testing market, encompassing well testing, reservoir testing, and fluid analysis services across the oil and gas, mining, and geothermal industries, is experiencing robust growth. Driven by increasing exploration and production activities, particularly in unconventional resources like shale gas and tight oil, the market is projected to maintain a Compound Annual Growth Rate (CAGR) exceeding 2.54% from 2025 to 2033. This expansion is fueled by the critical need for accurate data acquisition during drilling and production to optimize reservoir management, enhance recovery rates, and ensure operational efficiency. Technological advancements, including the adoption of automated systems, advanced sensors, and data analytics, are further boosting market growth, allowing for more efficient and precise testing processes. While regulatory compliance and environmental concerns present some restraints, the overall market outlook remains positive, driven by the long-term demand for energy resources and the continuous push for improved efficiency in resource extraction.
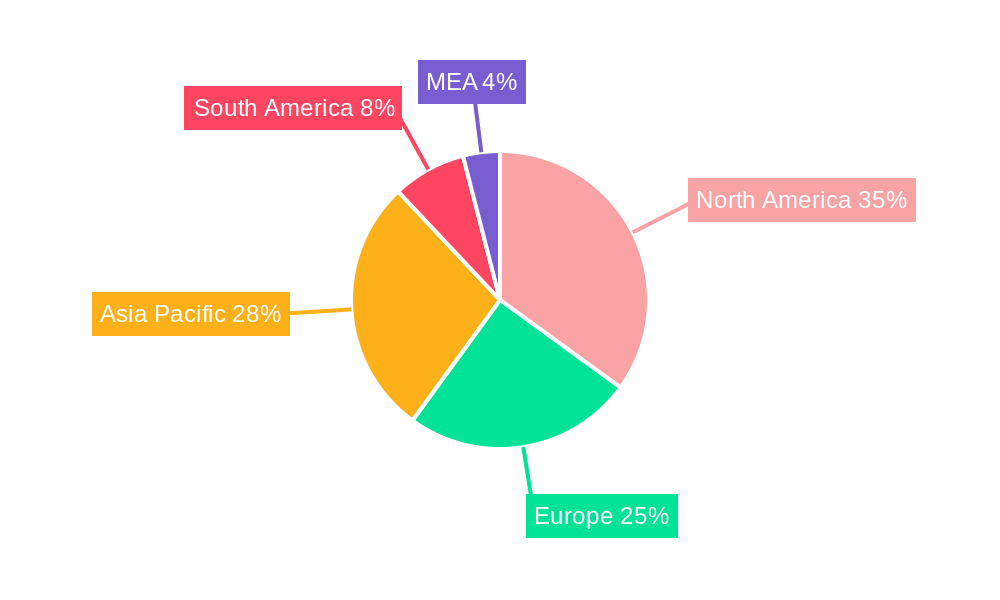
Specific segment growth varies; well testing is anticipated to dominate due to its indispensable role in verifying well integrity and production capacity. Reservoir testing, although a smaller segment, is showing significant growth owing to its value in characterizing subsurface formations and informing reservoir management strategies. The demand for fluid analysis is intrinsically linked to both well and reservoir testing and is expected to follow similar growth trajectories. Geographically, North America and the Asia-Pacific region are projected to be key growth drivers due to substantial energy exploration and production activities. The established presence of major oil and gas companies and increasing investments in renewable energy sources in these regions fuels continued demand. Europe, while a mature market, remains an important player owing to the ongoing efforts towards energy diversification and enhanced exploration in offshore areas. The competitive landscape features both large multinational corporations like Schlumberger, Halliburton, and Baker Hughes, and specialized smaller companies, fostering both innovation and price competition.
Production Testing Market: A Comprehensive Analysis (2019-2033)
This in-depth report provides a comprehensive analysis of the Production Testing Market, offering invaluable insights for industry stakeholders, investors, and strategic decision-makers. The study covers the period from 2019 to 2033, with 2025 as the base and estimated year. The report meticulously examines market segmentation, competitive dynamics, growth drivers, challenges, and emerging opportunities, providing a 360-degree view of this dynamic sector. The global market size is projected to reach xx Million by 2033, exhibiting a CAGR of xx% during the forecast period (2025-2033).
Production Testing Market Market Concentration & Innovation
The Production Testing Market exhibits a moderately concentrated landscape, with key players such as Baker Hughes Company, Halliburton Company, and Schlumberger Limited holding significant market share. However, the presence of several regional and specialized players introduces competitive dynamism. Market share calculations for 2024 suggest that the top three players collectively account for approximately xx% of the market. Innovation in the sector is primarily driven by the need for enhanced efficiency, improved data acquisition and analysis, and the development of sustainable technologies. Stringent regulatory frameworks, particularly concerning environmental protection and safety, are shaping product development and market practices. M&A activity in the sector has been relatively moderate in recent years, with deal values averaging xx Million per transaction during the historical period (2019-2024). The emergence of substitute technologies, particularly in data analytics and remote sensing, presents a challenge but also an opportunity for market innovation. End-user trends indicate a growing preference for integrated solutions and data-driven decision-making in production optimization.
- Market Concentration: Top 3 players hold approximately xx% market share in 2024.
- Innovation Drivers: Enhanced efficiency, improved data analysis, sustainable technologies.
- M&A Activity: Average deal value xx Million (2019-2024).
- Regulatory Frameworks: Stringent environmental and safety regulations.
- Substitute Technologies: Data analytics and remote sensing.
Production Testing Market Industry Trends & Insights
The Production Testing Market is experiencing robust growth, propelled by increasing global energy demand, particularly in the oil and gas sector. The market's expansion is further fueled by advancements in drilling technologies, leading to exploration in more challenging environments. Technological disruptions, such as the integration of artificial intelligence (AI) and machine learning (ML) in data analysis, are significantly enhancing efficiency and accuracy. Consumer preferences are shifting towards comprehensive solutions offering integrated data management and advanced analytical capabilities. Competitive dynamics are characterized by both consolidation and innovation, with established players investing in research and development while new entrants leverage technological advancements to gain market share. The market exhibits a high degree of dependence on upstream oil and gas activities, making it susceptible to fluctuations in energy prices and exploration investment. The CAGR is projected at xx% from 2025-2033. Market penetration within the mining and geothermal sectors remains relatively low, signifying significant untapped potential.
Dominant Markets & Segments in Production Testing Market
The Oil and Gas industry segment dominates the Production Testing market, accounting for approximately xx% of the overall market revenue in 2024. This dominance is driven by the extensive use of well testing, reservoir testing, and fluid analysis in optimizing production from oil and gas wells. The North American region emerges as the leading market, fueled by significant exploration activities and technological advancements.
Key Drivers for Oil and Gas Industry Dominance:
- High demand for efficient production optimization techniques.
- Extensive exploration activities leading to increased testing needs.
- Technological advancements providing increased accuracy and efficiency.
Key Drivers for North American Regional Dominance:
- Abundant oil and gas reserves.
- Strong regulatory framework supporting technological innovation.
- Significant investments in R&D activities.
Well Testing Segment: This segment commands a large market share due to its essential role in assessing well productivity and optimizing production strategies. Technological advancements such as automated testing systems and remote monitoring are further driving its growth.
Reservoir Testing Segment: This segment benefits from the increasing need to accurately characterize reservoir properties for efficient hydrocarbon recovery. Advanced imaging and simulation techniques are enhancing its applications.
Fluid Analysis Segment: Growth is fueled by demand for detailed characterization of produced fluids to optimize production and reduce operational costs. Real-time monitoring and advanced analytical techniques are key drivers.
Production Testing Market Product Developments
Recent product innovations focus on improving data acquisition speed and accuracy, integrating AI-powered analytics, and enhancing remote operation capabilities. Miniaturization of testing equipment, the development of robust sensors, and the use of advanced materials are key technological trends driving these advancements. These improvements contribute to reduced operational costs and enhanced safety measures. The market fit of these new products is strong, driven by the industry’s demand for increased efficiency and data-driven decision-making.
Report Scope & Segmentation Analysis
The report segments the Production Testing Market by Type (Well testing, Reservoir testing, Fluid analysis) and Application (Oil and gas industry, Mining industry, Geothermal industry). Each segment is comprehensively analyzed, covering market size, growth projections, and competitive dynamics. The Oil and Gas segment is currently the largest, followed by the Mining industry segment. Well testing is the dominant type segment, owing to its ubiquitous application in the production process. Growth projections indicate significant expansion in all segments over the forecast period, with specific growth rates detailed within the report itself.
Key Drivers of Production Testing Market Growth
Several factors contribute to the Production Testing Market's growth. Increased exploration and production activities in the oil and gas sector drive demand for accurate reservoir characterization and production optimization. Technological advancements, including automation, AI, and improved sensor technology, enhance efficiency and data analysis. Favorable government policies in certain regions promoting energy exploration further fuel market growth.
Challenges in the Production Testing Market Sector
The Production Testing Market faces challenges, including volatile energy prices impacting investment levels, supply chain disruptions impacting equipment availability and costs, and intense competition among established and emerging players. Stringent environmental regulations can also increase testing costs. These factors can lead to uncertainty in market growth.
Emerging Opportunities in Production Testing Market
Emerging opportunities include expansion into new geographic areas with significant exploration potential, particularly in developing economies. The integration of advanced technologies such as IoT and big data analytics creates new possibilities for data-driven decision making and enhanced operational efficiency. The growing adoption of sustainable production methods creates opportunities for environmentally friendly testing solutions.
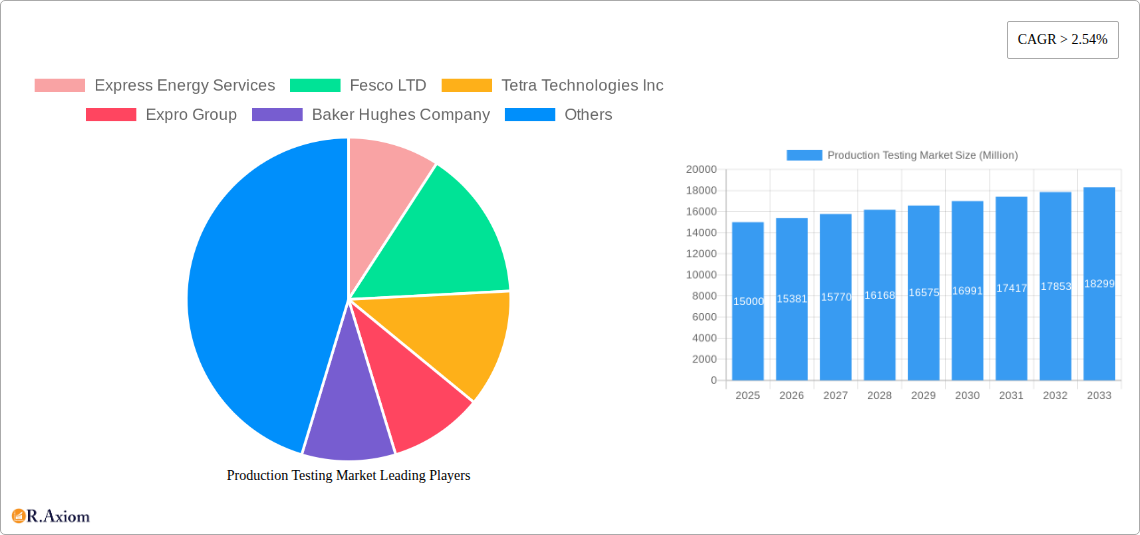
Leading Players in the Production Testing Market Market
- Express Energy Services
- Fesco LTD
- Tetra Technologies Inc
- Expro Group
- Baker Hughes Company
- Halliburton Company
- Schlumberger Limited
Key Developments in Production Testing Market Industry
- January 2023: Baker Hughes launched a new automated well testing system.
- March 2022: Halliburton acquired a smaller testing services company, expanding its market presence.
- June 2021: Schlumberger introduced AI-powered data analytics for optimized production testing.
- (Further developments will be included in the full report)
Strategic Outlook for Production Testing Market Market
The Production Testing Market is poised for substantial growth, driven by technological innovations and expanding energy demands. Opportunities abound in integrating advanced analytics and automation, expanding into new applications like geothermal energy, and addressing the growing need for sustainable solutions. Strategic investments in R&D and strategic partnerships will be crucial for companies to capitalize on this expanding market.
Production Testing Market Segmentation
- 1. Production Analysis
- 2. Consumption Analysis
- 3. Import Market Analysis (Value & Volume)
- 4. Export Market Analysis (Value & Volume)
- 5. Price Trend Analysis
Production Testing Market Segmentation By Geography
- 1. North America
- 2. Europe
- 3. Asia Pacific
- 4. South America
- 5. Middle East and Africa
Production Testing Market REPORT HIGHLIGHTS
| Aspects | Details |
|---|---|
| Study Period | 2019-2033 |
| Base Year | 2024 |
| Estimated Year | 2025 |
| Forecast Period | 2025-2033 |
| Historical Period | 2019-2024 |
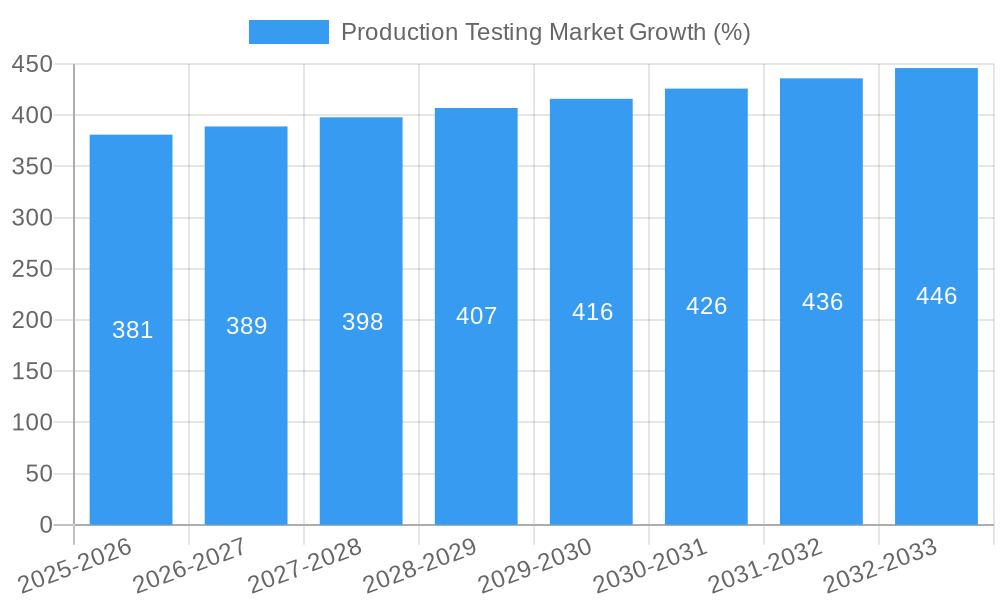
| Growth Rate | CAGR of > 2.54% from 2019-2033 |
| Segmentation |
|
Table of Contents
- 1. Introduction
- 1.1. Research Scope
- 1.2. Market Segmentation
- 1.3. Research Methodology
- 1.4. Definitions and Assumptions
- 2. Executive Summary
- 2.1. Introduction
- 3. Market Dynamics
- 3.1. Introduction
- 3.2. Market Drivers
- 3.2.1 Increasing Exploration in Offshore Areas4.; The Strengthening of Crude Oil Prices
- 3.2.2 Making the Upstream Activities Economically Feasible
- 3.3. Market Restrains
- 3.3.1. Shifting to Renewable Energy Sources
- 3.4. Market Trends
- 3.4.1. Rising Deepwater Offshore Development Activity
- 4. Market Factor Analysis
- 4.1. Porters Five Forces
- 4.2. Supply/Value Chain
- 4.3. PESTEL analysis
- 4.4. Market Entropy
- 4.5. Patent/Trademark Analysis
- 5. Global Production Testing Market Analysis, Insights and Forecast, 2019-2031
- 5.1. Market Analysis, Insights and Forecast - by Production Analysis
- 5.2. Market Analysis, Insights and Forecast - by Consumption Analysis
- 5.3. Market Analysis, Insights and Forecast - by Import Market Analysis (Value & Volume)
- 5.4. Market Analysis, Insights and Forecast - by Export Market Analysis (Value & Volume)
- 5.5. Market Analysis, Insights and Forecast - by Price Trend Analysis
- 5.6. Market Analysis, Insights and Forecast - by Region
- 5.6.1. North America
- 5.6.2. Europe
- 5.6.3. Asia Pacific
- 5.6.4. South America
- 5.6.5. Middle East and Africa
- 5.1. Market Analysis, Insights and Forecast - by Production Analysis
- 6. North America Production Testing Market Analysis, Insights and Forecast, 2019-2031
- 6.1. Market Analysis, Insights and Forecast - by Production Analysis
- 6.2. Market Analysis, Insights and Forecast - by Consumption Analysis
- 6.3. Market Analysis, Insights and Forecast - by Import Market Analysis (Value & Volume)
- 6.4. Market Analysis, Insights and Forecast - by Export Market Analysis (Value & Volume)
- 6.5. Market Analysis, Insights and Forecast - by Price Trend Analysis
- 6.1. Market Analysis, Insights and Forecast - by Production Analysis
- 7. Europe Production Testing Market Analysis, Insights and Forecast, 2019-2031
- 7.1. Market Analysis, Insights and Forecast - by Production Analysis
- 7.2. Market Analysis, Insights and Forecast - by Consumption Analysis
- 7.3. Market Analysis, Insights and Forecast - by Import Market Analysis (Value & Volume)
- 7.4. Market Analysis, Insights and Forecast - by Export Market Analysis (Value & Volume)
- 7.5. Market Analysis, Insights and Forecast - by Price Trend Analysis
- 7.1. Market Analysis, Insights and Forecast - by Production Analysis
- 8. Asia Pacific Production Testing Market Analysis, Insights and Forecast, 2019-2031
- 8.1. Market Analysis, Insights and Forecast - by Production Analysis
- 8.2. Market Analysis, Insights and Forecast - by Consumption Analysis
- 8.3. Market Analysis, Insights and Forecast - by Import Market Analysis (Value & Volume)
- 8.4. Market Analysis, Insights and Forecast - by Export Market Analysis (Value & Volume)
- 8.5. Market Analysis, Insights and Forecast - by Price Trend Analysis
- 8.1. Market Analysis, Insights and Forecast - by Production Analysis
- 9. South America Production Testing Market Analysis, Insights and Forecast, 2019-2031
- 9.1. Market Analysis, Insights and Forecast - by Production Analysis
- 9.2. Market Analysis, Insights and Forecast - by Consumption Analysis
- 9.3. Market Analysis, Insights and Forecast - by Import Market Analysis (Value & Volume)
- 9.4. Market Analysis, Insights and Forecast - by Export Market Analysis (Value & Volume)
- 9.5. Market Analysis, Insights and Forecast - by Price Trend Analysis
- 9.1. Market Analysis, Insights and Forecast - by Production Analysis
- 10. Middle East and Africa Production Testing Market Analysis, Insights and Forecast, 2019-2031
- 10.1. Market Analysis, Insights and Forecast - by Production Analysis
- 10.2. Market Analysis, Insights and Forecast - by Consumption Analysis
- 10.3. Market Analysis, Insights and Forecast - by Import Market Analysis (Value & Volume)
- 10.4. Market Analysis, Insights and Forecast - by Export Market Analysis (Value & Volume)
- 10.5. Market Analysis, Insights and Forecast - by Price Trend Analysis
- 10.1. Market Analysis, Insights and Forecast - by Production Analysis
- 11. North America Production Testing Market Analysis, Insights and Forecast, 2019-2031
- 11.1. Market Analysis, Insights and Forecast - By Country/Sub-region
- 11.1.1 United States
- 11.1.2 Canada
- 11.1.3 Mexico
- 12. Europe Production Testing Market Analysis, Insights and Forecast, 2019-2031
- 12.1. Market Analysis, Insights and Forecast - By Country/Sub-region
- 12.1.1 Germany
- 12.1.2 United Kingdom
- 12.1.3 France
- 12.1.4 Spain
- 12.1.5 Italy
- 12.1.6 Spain
- 12.1.7 Belgium
- 12.1.8 Netherland
- 12.1.9 Nordics
- 12.1.10 Rest of Europe
- 13. Asia Pacific Production Testing Market Analysis, Insights and Forecast, 2019-2031
- 13.1. Market Analysis, Insights and Forecast - By Country/Sub-region
- 13.1.1 China
- 13.1.2 Japan
- 13.1.3 India
- 13.1.4 South Korea
- 13.1.5 Southeast Asia
- 13.1.6 Australia
- 13.1.7 Indonesia
- 13.1.8 Phillipes
- 13.1.9 Singapore
- 13.1.10 Thailandc
- 13.1.11 Rest of Asia Pacific
- 14. South America Production Testing Market Analysis, Insights and Forecast, 2019-2031
- 14.1. Market Analysis, Insights and Forecast - By Country/Sub-region
- 14.1.1 Brazil
- 14.1.2 Argentina
- 14.1.3 Peru
- 14.1.4 Chile
- 14.1.5 Colombia
- 14.1.6 Ecuador
- 14.1.7 Venezuela
- 14.1.8 Rest of South America
- 15. MEA Production Testing Market Analysis, Insights and Forecast, 2019-2031
- 15.1. Market Analysis, Insights and Forecast - By Country/Sub-region
- 15.1.1 United Arab Emirates
- 15.1.2 Saudi Arabia
- 15.1.3 South Africa
- 15.1.4 Rest of Middle East and Africa
- 16. Competitive Analysis
- 16.1. Global Market Share Analysis 2024
- 16.2. Company Profiles
- 16.2.1 Express Energy Services
- 16.2.1.1. Overview
- 16.2.1.2. Products
- 16.2.1.3. SWOT Analysis
- 16.2.1.4. Recent Developments
- 16.2.1.5. Financials (Based on Availability)
- 16.2.2 Fesco LTD
- 16.2.2.1. Overview
- 16.2.2.2. Products
- 16.2.2.3. SWOT Analysis
- 16.2.2.4. Recent Developments
- 16.2.2.5. Financials (Based on Availability)
- 16.2.3 Tetra Technologies Inc
- 16.2.3.1. Overview
- 16.2.3.2. Products
- 16.2.3.3. SWOT Analysis
- 16.2.3.4. Recent Developments
- 16.2.3.5. Financials (Based on Availability)
- 16.2.4 Expro Group
- 16.2.4.1. Overview
- 16.2.4.2. Products
- 16.2.4.3. SWOT Analysis
- 16.2.4.4. Recent Developments
- 16.2.4.5. Financials (Based on Availability)
- 16.2.5 Baker Hughes Company
- 16.2.5.1. Overview
- 16.2.5.2. Products
- 16.2.5.3. SWOT Analysis
- 16.2.5.4. Recent Developments
- 16.2.5.5. Financials (Based on Availability)
- 16.2.6 Halliburton Company
- 16.2.6.1. Overview
- 16.2.6.2. Products
- 16.2.6.3. SWOT Analysis
- 16.2.6.4. Recent Developments
- 16.2.6.5. Financials (Based on Availability)
- 16.2.7 Schlumberger Limited
- 16.2.7.1. Overview
- 16.2.7.2. Products
- 16.2.7.3. SWOT Analysis
- 16.2.7.4. Recent Developments
- 16.2.7.5. Financials (Based on Availability)
- 16.2.1 Express Energy Services
List of Figures
- Figure 1: Global Production Testing Market Revenue Breakdown (Million, %) by Region 2024 & 2032
- Figure 2: North America Production Testing Market Revenue (Million), by Country 2024 & 2032
- Figure 3: North America Production Testing Market Revenue Share (%), by Country 2024 & 2032
- Figure 4: Europe Production Testing Market Revenue (Million), by Country 2024 & 2032
- Figure 5: Europe Production Testing Market Revenue Share (%), by Country 2024 & 2032
- Figure 6: Asia Pacific Production Testing Market Revenue (Million), by Country 2024 & 2032
- Figure 7: Asia Pacific Production Testing Market Revenue Share (%), by Country 2024 & 2032
- Figure 8: South America Production Testing Market Revenue (Million), by Country 2024 & 2032
- Figure 9: South America Production Testing Market Revenue Share (%), by Country 2024 & 2032
- Figure 10: MEA Production Testing Market Revenue (Million), by Country 2024 & 2032
- Figure 11: MEA Production Testing Market Revenue Share (%), by Country 2024 & 2032
- Figure 12: North America Production Testing Market Revenue (Million), by Production Analysis 2024 & 2032
- Figure 13: North America Production Testing Market Revenue Share (%), by Production Analysis 2024 & 2032
- Figure 14: North America Production Testing Market Revenue (Million), by Consumption Analysis 2024 & 2032
- Figure 15: North America Production Testing Market Revenue Share (%), by Consumption Analysis 2024 & 2032
- Figure 16: North America Production Testing Market Revenue (Million), by Import Market Analysis (Value & Volume) 2024 & 2032
- Figure 17: North America Production Testing Market Revenue Share (%), by Import Market Analysis (Value & Volume) 2024 & 2032
- Figure 18: North America Production Testing Market Revenue (Million), by Export Market Analysis (Value & Volume) 2024 & 2032
- Figure 19: North America Production Testing Market Revenue Share (%), by Export Market Analysis (Value & Volume) 2024 & 2032
- Figure 20: North America Production Testing Market Revenue (Million), by Price Trend Analysis 2024 & 2032
- Figure 21: North America Production Testing Market Revenue Share (%), by Price Trend Analysis 2024 & 2032
- Figure 22: North America Production Testing Market Revenue (Million), by Country 2024 & 2032
- Figure 23: North America Production Testing Market Revenue Share (%), by Country 2024 & 2032
- Figure 24: Europe Production Testing Market Revenue (Million), by Production Analysis 2024 & 2032
- Figure 25: Europe Production Testing Market Revenue Share (%), by Production Analysis 2024 & 2032
- Figure 26: Europe Production Testing Market Revenue (Million), by Consumption Analysis 2024 & 2032
- Figure 27: Europe Production Testing Market Revenue Share (%), by Consumption Analysis 2024 & 2032
- Figure 28: Europe Production Testing Market Revenue (Million), by Import Market Analysis (Value & Volume) 2024 & 2032
- Figure 29: Europe Production Testing Market Revenue Share (%), by Import Market Analysis (Value & Volume) 2024 & 2032
- Figure 30: Europe Production Testing Market Revenue (Million), by Export Market Analysis (Value & Volume) 2024 & 2032
- Figure 31: Europe Production Testing Market Revenue Share (%), by Export Market Analysis (Value & Volume) 2024 & 2032
- Figure 32: Europe Production Testing Market Revenue (Million), by Price Trend Analysis 2024 & 2032
- Figure 33: Europe Production Testing Market Revenue Share (%), by Price Trend Analysis 2024 & 2032
- Figure 34: Europe Production Testing Market Revenue (Million), by Country 2024 & 2032
- Figure 35: Europe Production Testing Market Revenue Share (%), by Country 2024 & 2032
- Figure 36: Asia Pacific Production Testing Market Revenue (Million), by Production Analysis 2024 & 2032
- Figure 37: Asia Pacific Production Testing Market Revenue Share (%), by Production Analysis 2024 & 2032
- Figure 38: Asia Pacific Production Testing Market Revenue (Million), by Consumption Analysis 2024 & 2032
- Figure 39: Asia Pacific Production Testing Market Revenue Share (%), by Consumption Analysis 2024 & 2032
- Figure 40: Asia Pacific Production Testing Market Revenue (Million), by Import Market Analysis (Value & Volume) 2024 & 2032
- Figure 41: Asia Pacific Production Testing Market Revenue Share (%), by Import Market Analysis (Value & Volume) 2024 & 2032
- Figure 42: Asia Pacific Production Testing Market Revenue (Million), by Export Market Analysis (Value & Volume) 2024 & 2032
- Figure 43: Asia Pacific Production Testing Market Revenue Share (%), by Export Market Analysis (Value & Volume) 2024 & 2032
- Figure 44: Asia Pacific Production Testing Market Revenue (Million), by Price Trend Analysis 2024 & 2032
- Figure 45: Asia Pacific Production Testing Market Revenue Share (%), by Price Trend Analysis 2024 & 2032
- Figure 46: Asia Pacific Production Testing Market Revenue (Million), by Country 2024 & 2032
- Figure 47: Asia Pacific Production Testing Market Revenue Share (%), by Country 2024 & 2032
- Figure 48: South America Production Testing Market Revenue (Million), by Production Analysis 2024 & 2032
- Figure 49: South America Production Testing Market Revenue Share (%), by Production Analysis 2024 & 2032
- Figure 50: South America Production Testing Market Revenue (Million), by Consumption Analysis 2024 & 2032
- Figure 51: South America Production Testing Market Revenue Share (%), by Consumption Analysis 2024 & 2032
- Figure 52: South America Production Testing Market Revenue (Million), by Import Market Analysis (Value & Volume) 2024 & 2032
- Figure 53: South America Production Testing Market Revenue Share (%), by Import Market Analysis (Value & Volume) 2024 & 2032
- Figure 54: South America Production Testing Market Revenue (Million), by Export Market Analysis (Value & Volume) 2024 & 2032
- Figure 55: South America Production Testing Market Revenue Share (%), by Export Market Analysis (Value & Volume) 2024 & 2032
- Figure 56: South America Production Testing Market Revenue (Million), by Price Trend Analysis 2024 & 2032
- Figure 57: South America Production Testing Market Revenue Share (%), by Price Trend Analysis 2024 & 2032
- Figure 58: South America Production Testing Market Revenue (Million), by Country 2024 & 2032
- Figure 59: South America Production Testing Market Revenue Share (%), by Country 2024 & 2032
- Figure 60: Middle East and Africa Production Testing Market Revenue (Million), by Production Analysis 2024 & 2032
- Figure 61: Middle East and Africa Production Testing Market Revenue Share (%), by Production Analysis 2024 & 2032
- Figure 62: Middle East and Africa Production Testing Market Revenue (Million), by Consumption Analysis 2024 & 2032
- Figure 63: Middle East and Africa Production Testing Market Revenue Share (%), by Consumption Analysis 2024 & 2032
- Figure 64: Middle East and Africa Production Testing Market Revenue (Million), by Import Market Analysis (Value & Volume) 2024 & 2032
- Figure 65: Middle East and Africa Production Testing Market Revenue Share (%), by Import Market Analysis (Value & Volume) 2024 & 2032
- Figure 66: Middle East and Africa Production Testing Market Revenue (Million), by Export Market Analysis (Value & Volume) 2024 & 2032
- Figure 67: Middle East and Africa Production Testing Market Revenue Share (%), by Export Market Analysis (Value & Volume) 2024 & 2032
- Figure 68: Middle East and Africa Production Testing Market Revenue (Million), by Price Trend Analysis 2024 & 2032
- Figure 69: Middle East and Africa Production Testing Market Revenue Share (%), by Price Trend Analysis 2024 & 2032
- Figure 70: Middle East and Africa Production Testing Market Revenue (Million), by Country 2024 & 2032
- Figure 71: Middle East and Africa Production Testing Market Revenue Share (%), by Country 2024 & 2032
List of Tables
- Table 1: Global Production Testing Market Revenue Million Forecast, by Region 2019 & 2032
- Table 2: Global Production Testing Market Revenue Million Forecast, by Production Analysis 2019 & 2032
- Table 3: Global Production Testing Market Revenue Million Forecast, by Consumption Analysis 2019 & 2032
- Table 4: Global Production Testing Market Revenue Million Forecast, by Import Market Analysis (Value & Volume) 2019 & 2032
- Table 5: Global Production Testing Market Revenue Million Forecast, by Export Market Analysis (Value & Volume) 2019 & 2032
- Table 6: Global Production Testing Market Revenue Million Forecast, by Price Trend Analysis 2019 & 2032
- Table 7: Global Production Testing Market Revenue Million Forecast, by Region 2019 & 2032
- Table 8: Global Production Testing Market Revenue Million Forecast, by Country 2019 & 2032
- Table 9: United States Production Testing Market Revenue (Million) Forecast, by Application 2019 & 2032
- Table 10: Canada Production Testing Market Revenue (Million) Forecast, by Application 2019 & 2032
- Table 11: Mexico Production Testing Market Revenue (Million) Forecast, by Application 2019 & 2032
- Table 12: Global Production Testing Market Revenue Million Forecast, by Country 2019 & 2032
- Table 13: Germany Production Testing Market Revenue (Million) Forecast, by Application 2019 & 2032
- Table 14: United Kingdom Production Testing Market Revenue (Million) Forecast, by Application 2019 & 2032
- Table 15: France Production Testing Market Revenue (Million) Forecast, by Application 2019 & 2032
- Table 16: Spain Production Testing Market Revenue (Million) Forecast, by Application 2019 & 2032
- Table 17: Italy Production Testing Market Revenue (Million) Forecast, by Application 2019 & 2032
- Table 18: Spain Production Testing Market Revenue (Million) Forecast, by Application 2019 & 2032
- Table 19: Belgium Production Testing Market Revenue (Million) Forecast, by Application 2019 & 2032
- Table 20: Netherland Production Testing Market Revenue (Million) Forecast, by Application 2019 & 2032
- Table 21: Nordics Production Testing Market Revenue (Million) Forecast, by Application 2019 & 2032
- Table 22: Rest of Europe Production Testing Market Revenue (Million) Forecast, by Application 2019 & 2032
- Table 23: Global Production Testing Market Revenue Million Forecast, by Country 2019 & 2032
- Table 24: China Production Testing Market Revenue (Million) Forecast, by Application 2019 & 2032
- Table 25: Japan Production Testing Market Revenue (Million) Forecast, by Application 2019 & 2032
- Table 26: India Production Testing Market Revenue (Million) Forecast, by Application 2019 & 2032
- Table 27: South Korea Production Testing Market Revenue (Million) Forecast, by Application 2019 & 2032
- Table 28: Southeast Asia Production Testing Market Revenue (Million) Forecast, by Application 2019 & 2032
- Table 29: Australia Production Testing Market Revenue (Million) Forecast, by Application 2019 & 2032
- Table 30: Indonesia Production Testing Market Revenue (Million) Forecast, by Application 2019 & 2032
- Table 31: Phillipes Production Testing Market Revenue (Million) Forecast, by Application 2019 & 2032
- Table 32: Singapore Production Testing Market Revenue (Million) Forecast, by Application 2019 & 2032
- Table 33: Thailandc Production Testing Market Revenue (Million) Forecast, by Application 2019 & 2032
- Table 34: Rest of Asia Pacific Production Testing Market Revenue (Million) Forecast, by Application 2019 & 2032
- Table 35: Global Production Testing Market Revenue Million Forecast, by Country 2019 & 2032
- Table 36: Brazil Production Testing Market Revenue (Million) Forecast, by Application 2019 & 2032
- Table 37: Argentina Production Testing Market Revenue (Million) Forecast, by Application 2019 & 2032
- Table 38: Peru Production Testing Market Revenue (Million) Forecast, by Application 2019 & 2032
- Table 39: Chile Production Testing Market Revenue (Million) Forecast, by Application 2019 & 2032
- Table 40: Colombia Production Testing Market Revenue (Million) Forecast, by Application 2019 & 2032
- Table 41: Ecuador Production Testing Market Revenue (Million) Forecast, by Application 2019 & 2032
- Table 42: Venezuela Production Testing Market Revenue (Million) Forecast, by Application 2019 & 2032
- Table 43: Rest of South America Production Testing Market Revenue (Million) Forecast, by Application 2019 & 2032
- Table 44: Global Production Testing Market Revenue Million Forecast, by Country 2019 & 2032
- Table 45: United Arab Emirates Production Testing Market Revenue (Million) Forecast, by Application 2019 & 2032
- Table 46: Saudi Arabia Production Testing Market Revenue (Million) Forecast, by Application 2019 & 2032
- Table 47: South Africa Production Testing Market Revenue (Million) Forecast, by Application 2019 & 2032
- Table 48: Rest of Middle East and Africa Production Testing Market Revenue (Million) Forecast, by Application 2019 & 2032
- Table 49: Global Production Testing Market Revenue Million Forecast, by Production Analysis 2019 & 2032
- Table 50: Global Production Testing Market Revenue Million Forecast, by Consumption Analysis 2019 & 2032
- Table 51: Global Production Testing Market Revenue Million Forecast, by Import Market Analysis (Value & Volume) 2019 & 2032
- Table 52: Global Production Testing Market Revenue Million Forecast, by Export Market Analysis (Value & Volume) 2019 & 2032
- Table 53: Global Production Testing Market Revenue Million Forecast, by Price Trend Analysis 2019 & 2032
- Table 54: Global Production Testing Market Revenue Million Forecast, by Country 2019 & 2032
- Table 55: Global Production Testing Market Revenue Million Forecast, by Production Analysis 2019 & 2032
- Table 56: Global Production Testing Market Revenue Million Forecast, by Consumption Analysis 2019 & 2032
- Table 57: Global Production Testing Market Revenue Million Forecast, by Import Market Analysis (Value & Volume) 2019 & 2032
- Table 58: Global Production Testing Market Revenue Million Forecast, by Export Market Analysis (Value & Volume) 2019 & 2032
- Table 59: Global Production Testing Market Revenue Million Forecast, by Price Trend Analysis 2019 & 2032
- Table 60: Global Production Testing Market Revenue Million Forecast, by Country 2019 & 2032
- Table 61: Global Production Testing Market Revenue Million Forecast, by Production Analysis 2019 & 2032
- Table 62: Global Production Testing Market Revenue Million Forecast, by Consumption Analysis 2019 & 2032
- Table 63: Global Production Testing Market Revenue Million Forecast, by Import Market Analysis (Value & Volume) 2019 & 2032
- Table 64: Global Production Testing Market Revenue Million Forecast, by Export Market Analysis (Value & Volume) 2019 & 2032
- Table 65: Global Production Testing Market Revenue Million Forecast, by Price Trend Analysis 2019 & 2032
- Table 66: Global Production Testing Market Revenue Million Forecast, by Country 2019 & 2032
- Table 67: Global Production Testing Market Revenue Million Forecast, by Production Analysis 2019 & 2032
- Table 68: Global Production Testing Market Revenue Million Forecast, by Consumption Analysis 2019 & 2032
- Table 69: Global Production Testing Market Revenue Million Forecast, by Import Market Analysis (Value & Volume) 2019 & 2032
- Table 70: Global Production Testing Market Revenue Million Forecast, by Export Market Analysis (Value & Volume) 2019 & 2032
- Table 71: Global Production Testing Market Revenue Million Forecast, by Price Trend Analysis 2019 & 2032
- Table 72: Global Production Testing Market Revenue Million Forecast, by Country 2019 & 2032
- Table 73: Global Production Testing Market Revenue Million Forecast, by Production Analysis 2019 & 2032
- Table 74: Global Production Testing Market Revenue Million Forecast, by Consumption Analysis 2019 & 2032
- Table 75: Global Production Testing Market Revenue Million Forecast, by Import Market Analysis (Value & Volume) 2019 & 2032
- Table 76: Global Production Testing Market Revenue Million Forecast, by Export Market Analysis (Value & Volume) 2019 & 2032
- Table 77: Global Production Testing Market Revenue Million Forecast, by Price Trend Analysis 2019 & 2032
- Table 78: Global Production Testing Market Revenue Million Forecast, by Country 2019 & 2032
Frequently Asked Questions
1. What is the projected Compound Annual Growth Rate (CAGR) of the Production Testing Market?
The projected CAGR is approximately > 2.54%.
2. Which companies are prominent players in the Production Testing Market?
Key companies in the market include Express Energy Services, Fesco LTD, Tetra Technologies Inc, Expro Group, Baker Hughes Company, Halliburton Company, Schlumberger Limited.
3. What are the main segments of the Production Testing Market?
The market segments include Production Analysis, Consumption Analysis, Import Market Analysis (Value & Volume), Export Market Analysis (Value & Volume), Price Trend Analysis.
4. Can you provide details about the market size?
The market size is estimated to be USD XX Million as of 2022.
5. What are some drivers contributing to market growth?
Increasing Exploration in Offshore Areas4.; The Strengthening of Crude Oil Prices. Making the Upstream Activities Economically Feasible.
6. What are the notable trends driving market growth?
Rising Deepwater Offshore Development Activity.
7. Are there any restraints impacting market growth?
Shifting to Renewable Energy Sources.
8. Can you provide examples of recent developments in the market?
N/A
9. What pricing options are available for accessing the report?
Pricing options include single-user, multi-user, and enterprise licenses priced at USD 4750, USD 5250, and USD 8750 respectively.
10. Is the market size provided in terms of value or volume?
The market size is provided in terms of value, measured in Million.
11. Are there any specific market keywords associated with the report?
Yes, the market keyword associated with the report is "Production Testing Market," which aids in identifying and referencing the specific market segment covered.
12. How do I determine which pricing option suits my needs best?
The pricing options vary based on user requirements and access needs. Individual users may opt for single-user licenses, while businesses requiring broader access may choose multi-user or enterprise licenses for cost-effective access to the report.
13. Are there any additional resources or data provided in the Production Testing Market report?
While the report offers comprehensive insights, it's advisable to review the specific contents or supplementary materials provided to ascertain if additional resources or data are available.
14. How can I stay updated on further developments or reports in the Production Testing Market?
To stay informed about further developments, trends, and reports in the Production Testing Market, consider subscribing to industry newsletters, following relevant companies and organizations, or regularly checking reputable industry news sources and publications.
Methodology
Step 1 - Identification of Relevant Samples Size from Population Database


Step 2 - Approaches for Defining Global Market Size (Value, Volume* & Price*)

Note*: In applicable scenarios
Step 3 - Data Sources
Primary Research
- Web Analytics
- Survey Reports
- Research Institute
- Latest Research Reports
- Opinion Leaders
Secondary Research
- Annual Reports
- White Paper
- Latest Press Release
- Industry Association
- Paid Database
- Investor Presentations

Step 4 - Data Triangulation
Involves using different sources of information in order to increase the validity of a study
These sources are likely to be stakeholders in a program - participants, other researchers, program staff, other community members, and so on.
Then we put all data in single framework & apply various statistical tools to find out the dynamic on the market.
During the analysis stage, feedback from the stakeholder groups would be compared to determine areas of agreement as well as areas of divergence


