
Key Insights
The US Property and Casualty (P&C) insurance market, a cornerstone of the American financial system, demonstrates robust growth potential. Analyzing the period from 2019 to 2033, we observe a significant market expansion fueled by several key factors. The increasing frequency and severity of natural disasters, including hurricanes, wildfires, and floods, drive demand for comprehensive coverage. Simultaneously, a rising population and expanding economy contribute to a larger insured asset base, particularly in commercial real estate and personal property. Technological advancements, such as advanced analytics and telematics, are transforming risk assessment and claims processing, leading to increased efficiency and potentially lower premiums. However, the market faces challenges like inflation, fluctuating interest rates, and increasing regulatory scrutiny. These factors impact profitability and necessitate strategic adaptations by insurers. Furthermore, evolving consumer preferences and the rise of Insurtech companies are reshaping the competitive landscape, demanding innovation and adaptation to remain competitive.
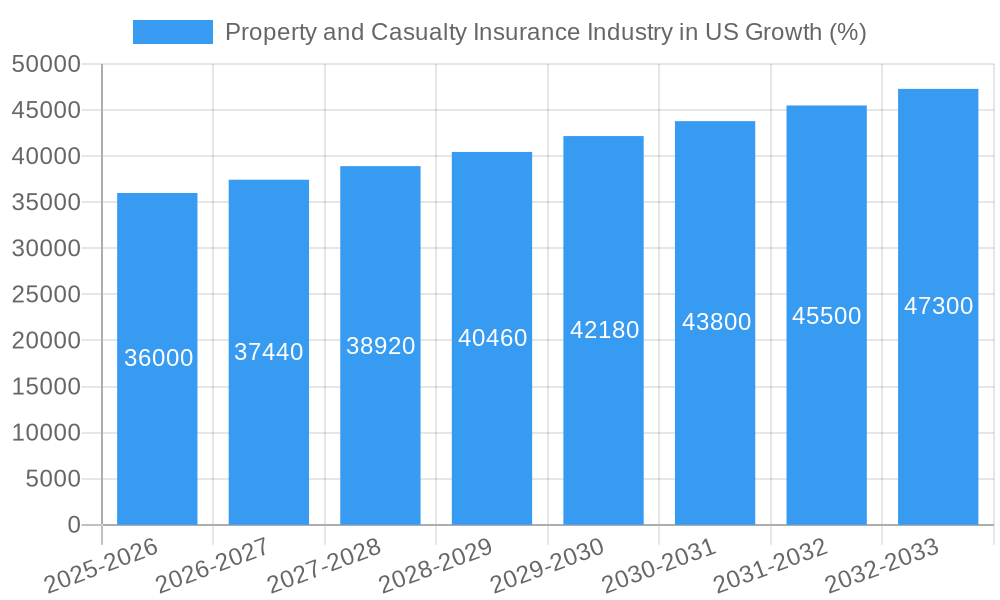
The projected Compound Annual Growth Rate (CAGR) over the forecast period (2025-2033), while not explicitly provided, can be reasonably estimated based on historical data and industry trends. Considering the factors mentioned above, a conservative estimate of the CAGR for the US P&C insurance market during this period would be between 3% and 5%. This implies a steady, albeit moderate, expansion. This growth is expected to be driven primarily by the commercial lines segment, reflecting the continued expansion of the US economy and associated increase in insurable assets. The personal lines segment will also see growth, though potentially at a slightly slower rate, influenced by factors such as demographic shifts and evolving consumer needs. The market will witness further consolidation, with larger players potentially acquiring smaller firms to enhance market share and operational efficiencies.
Property and Casualty Insurance Industry in US: A Comprehensive Market Report (2019-2033)
This comprehensive report provides a detailed analysis of the US Property and Casualty (P&C) insurance industry, offering invaluable insights for stakeholders including insurers, investors, and regulators. The report covers the period from 2019 to 2033, with a focus on the base year 2025 and a forecast period from 2025 to 2033. The historical period analyzed is 2019-2024. Market sizing is expressed in millions of USD.
Property and Casualty Insurance Industry in US Market Concentration & Innovation
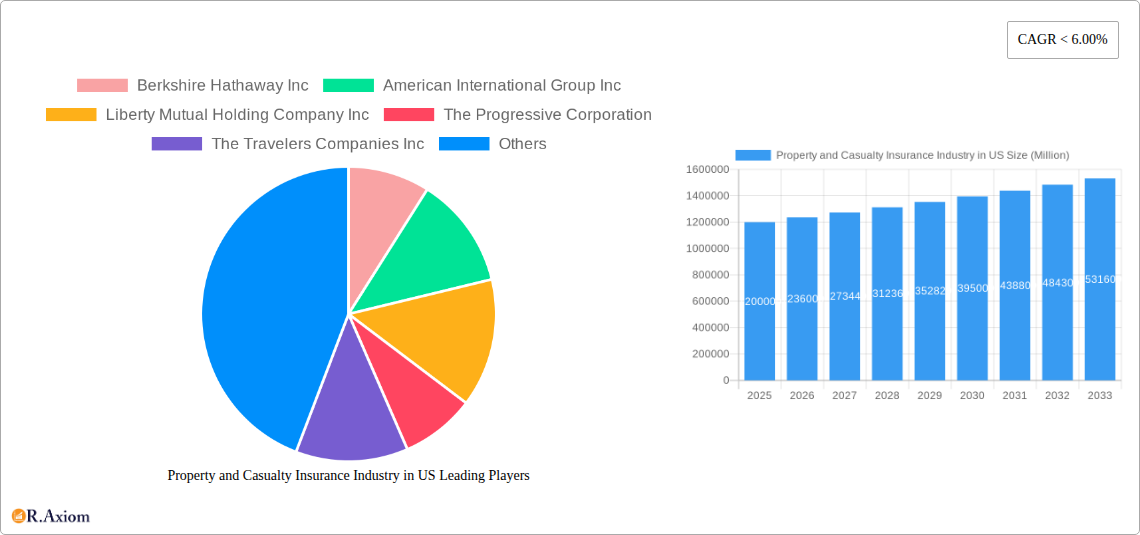
This section analyzes the market concentration, innovation drivers, regulatory landscape, and competitive dynamics within the US P&C insurance sector. We examine the market share of key players like Berkshire Hathaway Inc, American International Group Inc (AIG), Liberty Mutual Holding Company Inc, The Progressive Corporation, The Travelers Companies Inc, United Services Automobile Association (USAA), Farmers Group Inc, American Family Mutual Insurance Company, W. R. Berkley Corporation, and American Financial Group Inc, alongside other significant players. The report also details mergers and acquisitions (M&A) activities, analyzing deal values and their impact on market consolidation. We explore the role of technological innovation, including AI, big data analytics, and Insurtech, in driving efficiency and product development. Furthermore, the influence of regulatory frameworks, such as those governing data privacy and cybersecurity, and the presence of substitute products and evolving end-user trends will be examined.
- Market Share Analysis: Berkshire Hathaway holds an estimated xx% market share in 2025, followed by AIG at xx%, and other major players with respective shares.
- M&A Activity: Total M&A deal value in the P&C industry from 2019-2024 is estimated at $xx Billion. The report will analyze key deals and their impact on market structure.
- Innovation Drivers: The adoption of AI and machine learning is a key driver, leading to improved risk assessment, fraud detection, and customer service.
- Regulatory Landscape: The report analyzes the impact of regulations like the CCPA and GDPR on data privacy and security practices within the industry.
Property and Casualty Insurance Industry in US Industry Trends & Insights
This section delves into the key trends shaping the US P&C insurance market. We analyze market growth drivers, including economic expansion, increasing urbanization, and evolving risk profiles. The impact of technological disruptions, such as the rise of Insurtech and digital distribution channels, will be explored. Consumer preferences, including the demand for personalized products and seamless digital experiences, will be examined. We will also investigate the competitive dynamics among established players and emerging Insurtech companies. The report includes a forecast for market growth, expressed as Compound Annual Growth Rate (CAGR), and explores market penetration rates for various product segments.
- Market growth drivers: Increasing awareness of insurance needs, growing middle class, and rising property values.
- Technological disruptions: Insurtech advancements lead to automation, personalized offerings, and faster claims processing.
- Consumer preferences: Demand for personalized policies, digital-first experiences and transparent pricing models.
- Competitive dynamics: Intense competition among established players and emerging Insurtech companies.
- CAGR projection: The US P&C insurance market is projected to experience a CAGR of xx% during 2025-2033.
- Market penetration: The market penetration of specific insurance products such as auto insurance, homeowner's insurance etc will be presented.
Dominant Markets & Segments in Property and Casualty Insurance Industry in US
This section identifies the leading segments within the US P&C insurance market. The analysis will focus on the key drivers behind the dominance of these segments, considering macroeconomic factors such as economic policies, infrastructure development, and demographic shifts.
Key Drivers of Dominance:
- Strong economic growth in specific regions driving demand for property and casualty insurance.
- Favorable regulatory environments promoting industry growth.
- High population density and urbanization leading to increased risk exposure.
- Advanced infrastructure supporting efficient insurance operations.
Dominant Segment Analysis: A detailed analysis of the leading segment(s) will be provided, explaining factors contributing to its superior growth and market share. (e.g., Auto Insurance potentially being the dominant segment due to high vehicle ownership.)
Property and Casualty Insurance Industry in US Product Developments
This section summarizes recent product innovations within the US P&C insurance market. We will analyze the applications of these products and their competitive advantages, highlighting technological trends driving their development and assessing their market fit. Emphasis will be placed on how these innovations address evolving consumer needs and preferences. For example, the increasing use of telematics in auto insurance or the development of parametric insurance products for specific risks will be analyzed.
Report Scope & Segmentation Analysis
This report segments the US P&C insurance market based on various criteria including product type (e.g., auto, home, commercial), distribution channel (e.g., online, agents, brokers), and customer demographics (e.g., age, income). Each segment will be characterized by its growth projections, market size in 2025, and competitive dynamics.
Key Drivers of Property and Casualty Insurance Industry in US Growth
Several factors contribute to the growth of the US P&C insurance market. Technological advancements are improving efficiency and personalization. Economic growth leads to increased demand for insurance products, while favorable regulatory environments foster innovation. Specific examples will be provided to illustrate each driver's impact.
Challenges in the Property and Casualty Insurance Industry in US Sector
The US P&C insurance industry faces significant challenges. Stringent regulations and compliance requirements increase operational costs. Supply chain disruptions can impact the availability of insurance services. Intense competition, particularly from Insurtech companies, puts pressure on profit margins. These challenges are analyzed with quantifiable impacts and projections.
Emerging Opportunities in Property and Casualty Insurance Industry in US
The US P&C insurance market presents substantial emerging opportunities. New technologies, such as AI and blockchain, offer the potential to transform the industry. Untapped markets, both geographically and demographically, offer significant growth potential. Evolving consumer preferences create opportunities for innovative product development and customer service improvements.
Leading Players in the Property and Casualty Insurance Industry in US Market
- Berkshire Hathaway Inc
- American International Group Inc
- Liberty Mutual Holding Company Inc
- The Progressive Corporation
- The Travelers Companies Inc
- United Services Automobile Association
- Farmers Group Inc
- American Family Mutual Insurance Company
- W R Berkley Corporation
- American Financial Group Inc
Key Developments in Property and Casualty Insurance Industry in US Industry
- [Month, Year]: [Description of key development and its impact on the market, e.g., "Progressive launched a new telematics-based auto insurance product, leading to increased market share."]
- [Month, Year]: [Description of key development and its impact on the market]
- [Month, Year]: [Description of key development and its impact on the market]
- …and more
Strategic Outlook for Property and Casualty Insurance Industry in US Market
The US P&C insurance market is poised for continued growth driven by technological innovation, evolving consumer needs, and economic expansion. Opportunities exist for companies to leverage data analytics, AI, and Insurtech solutions to improve efficiency, personalize products, and enhance customer experience. The future success of players will depend on their ability to adapt to changing market dynamics and embrace innovative strategies.
Property and Casualty Insurance Industry in US Segmentation
-
1. Insurance Type
- 1.1. Home
- 1.2. Motor
- 1.3. Others
-
2. Channel of Distribution
- 2.1. Direct
- 2.2. Agency
- 2.3. Banks
- 2.4. Others
Property and Casualty Insurance Industry in US Segmentation By Geography
-
1. North America
- 1.1. United States
- 1.2. Canada
- 1.3. Mexico
-
2. South America
- 2.1. Brazil
- 2.2. Argentina
- 2.3. Rest of South America
-
3. Europe
- 3.1. United Kingdom
- 3.2. Germany
- 3.3. France
- 3.4. Italy
- 3.5. Spain
- 3.6. Russia
- 3.7. Benelux
- 3.8. Nordics
- 3.9. Rest of Europe
-
4. Middle East & Africa
- 4.1. Turkey
- 4.2. Israel
- 4.3. GCC
- 4.4. North Africa
- 4.5. South Africa
- 4.6. Rest of Middle East & Africa
-
5. Asia Pacific
- 5.1. China
- 5.2. India
- 5.3. Japan
- 5.4. South Korea
- 5.5. ASEAN
- 5.6. Oceania
- 5.7. Rest of Asia Pacific
Property and Casualty Insurance Industry in US REPORT HIGHLIGHTS
| Aspects | Details |
|---|---|
| Study Period | 2019-2033 |
| Base Year | 2024 |
| Estimated Year | 2025 |
| Forecast Period | 2025-2033 |
| Historical Period | 2019-2024 |
| Growth Rate | CAGR of < 6.00% from 2019-2033 |
| Segmentation |
|
Table of Contents
- 1. Introduction
- 1.1. Research Scope
- 1.2. Market Segmentation
- 1.3. Research Methodology
- 1.4. Definitions and Assumptions
- 2. Executive Summary
- 2.1. Introduction
- 3. Market Dynamics
- 3.1. Introduction
- 3.2. Market Drivers
- 3.3. Market Restrains
- 3.4. Market Trends
- 3.4.1. RPA is Going to Help in Quick Process
- 4. Market Factor Analysis
- 4.1. Porters Five Forces
- 4.2. Supply/Value Chain
- 4.3. PESTEL analysis
- 4.4. Market Entropy
- 4.5. Patent/Trademark Analysis
- 5. Global Property and Casualty Insurance Industry in US Analysis, Insights and Forecast, 2019-2031
- 5.1. Market Analysis, Insights and Forecast - by Insurance Type
- 5.1.1. Home
- 5.1.2. Motor
- 5.1.3. Others
- 5.2. Market Analysis, Insights and Forecast - by Channel of Distribution
- 5.2.1. Direct
- 5.2.2. Agency
- 5.2.3. Banks
- 5.2.4. Others
- 5.3. Market Analysis, Insights and Forecast - by Region
- 5.3.1. North America
- 5.3.2. South America
- 5.3.3. Europe
- 5.3.4. Middle East & Africa
- 5.3.5. Asia Pacific
- 5.1. Market Analysis, Insights and Forecast - by Insurance Type
- 6. North America Property and Casualty Insurance Industry in US Analysis, Insights and Forecast, 2019-2031
- 6.1. Market Analysis, Insights and Forecast - by Insurance Type
- 6.1.1. Home
- 6.1.2. Motor
- 6.1.3. Others
- 6.2. Market Analysis, Insights and Forecast - by Channel of Distribution
- 6.2.1. Direct
- 6.2.2. Agency
- 6.2.3. Banks
- 6.2.4. Others
- 6.1. Market Analysis, Insights and Forecast - by Insurance Type
- 7. South America Property and Casualty Insurance Industry in US Analysis, Insights and Forecast, 2019-2031
- 7.1. Market Analysis, Insights and Forecast - by Insurance Type
- 7.1.1. Home
- 7.1.2. Motor
- 7.1.3. Others
- 7.2. Market Analysis, Insights and Forecast - by Channel of Distribution
- 7.2.1. Direct
- 7.2.2. Agency
- 7.2.3. Banks
- 7.2.4. Others
- 7.1. Market Analysis, Insights and Forecast - by Insurance Type
- 8. Europe Property and Casualty Insurance Industry in US Analysis, Insights and Forecast, 2019-2031
- 8.1. Market Analysis, Insights and Forecast - by Insurance Type
- 8.1.1. Home
- 8.1.2. Motor
- 8.1.3. Others
- 8.2. Market Analysis, Insights and Forecast - by Channel of Distribution
- 8.2.1. Direct
- 8.2.2. Agency
- 8.2.3. Banks
- 8.2.4. Others
- 8.1. Market Analysis, Insights and Forecast - by Insurance Type
- 9. Middle East & Africa Property and Casualty Insurance Industry in US Analysis, Insights and Forecast, 2019-2031
- 9.1. Market Analysis, Insights and Forecast - by Insurance Type
- 9.1.1. Home
- 9.1.2. Motor
- 9.1.3. Others
- 9.2. Market Analysis, Insights and Forecast - by Channel of Distribution
- 9.2.1. Direct
- 9.2.2. Agency
- 9.2.3. Banks
- 9.2.4. Others
- 9.1. Market Analysis, Insights and Forecast - by Insurance Type
- 10. Asia Pacific Property and Casualty Insurance Industry in US Analysis, Insights and Forecast, 2019-2031
- 10.1. Market Analysis, Insights and Forecast - by Insurance Type
- 10.1.1. Home
- 10.1.2. Motor
- 10.1.3. Others
- 10.2. Market Analysis, Insights and Forecast - by Channel of Distribution
- 10.2.1. Direct
- 10.2.2. Agency
- 10.2.3. Banks
- 10.2.4. Others
- 10.1. Market Analysis, Insights and Forecast - by Insurance Type
- 11. Competitive Analysis
- 11.1. Global Market Share Analysis 2024
- 11.2. Company Profiles
- 11.2.1 Berkshire Hathaway Inc
- 11.2.1.1. Overview
- 11.2.1.2. Products
- 11.2.1.3. SWOT Analysis
- 11.2.1.4. Recent Developments
- 11.2.1.5. Financials (Based on Availability)
- 11.2.2 American International Group Inc
- 11.2.2.1. Overview
- 11.2.2.2. Products
- 11.2.2.3. SWOT Analysis
- 11.2.2.4. Recent Developments
- 11.2.2.5. Financials (Based on Availability)
- 11.2.3 Liberty Mutual Holding Company Inc
- 11.2.3.1. Overview
- 11.2.3.2. Products
- 11.2.3.3. SWOT Analysis
- 11.2.3.4. Recent Developments
- 11.2.3.5. Financials (Based on Availability)
- 11.2.4 The Progressive Corporation
- 11.2.4.1. Overview
- 11.2.4.2. Products
- 11.2.4.3. SWOT Analysis
- 11.2.4.4. Recent Developments
- 11.2.4.5. Financials (Based on Availability)
- 11.2.5 The Travelers Companies Inc
- 11.2.5.1. Overview
- 11.2.5.2. Products
- 11.2.5.3. SWOT Analysis
- 11.2.5.4. Recent Developments
- 11.2.5.5. Financials (Based on Availability)
- 11.2.6 United Services Automobile Association
- 11.2.6.1. Overview
- 11.2.6.2. Products
- 11.2.6.3. SWOT Analysis
- 11.2.6.4. Recent Developments
- 11.2.6.5. Financials (Based on Availability)
- 11.2.7 Farmers Group Inc
- 11.2.7.1. Overview
- 11.2.7.2. Products
- 11.2.7.3. SWOT Analysis
- 11.2.7.4. Recent Developments
- 11.2.7.5. Financials (Based on Availability)
- 11.2.8 American Family Mutual Insurance Company S I
- 11.2.8.1. Overview
- 11.2.8.2. Products
- 11.2.8.3. SWOT Analysis
- 11.2.8.4. Recent Developments
- 11.2.8.5. Financials (Based on Availability)
- 11.2.9 W R Berkley Corporation
- 11.2.9.1. Overview
- 11.2.9.2. Products
- 11.2.9.3. SWOT Analysis
- 11.2.9.4. Recent Developments
- 11.2.9.5. Financials (Based on Availability)
- 11.2.10 American Financial Group Inc *List Not Exhaustive
- 11.2.10.1. Overview
- 11.2.10.2. Products
- 11.2.10.3. SWOT Analysis
- 11.2.10.4. Recent Developments
- 11.2.10.5. Financials (Based on Availability)
- 11.2.1 Berkshire Hathaway Inc
List of Figures
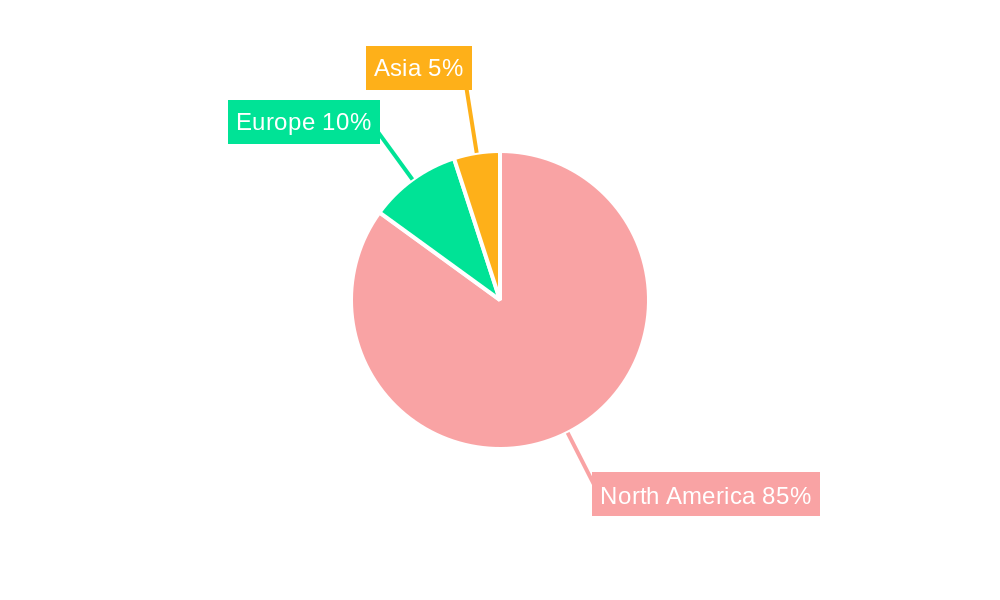
- Figure 1: Global Property and Casualty Insurance Industry in US Revenue Breakdown (Million, %) by Region 2024 & 2032
- Figure 2: North America Property and Casualty Insurance Industry in US Revenue (Million), by Insurance Type 2024 & 2032
- Figure 3: North America Property and Casualty Insurance Industry in US Revenue Share (%), by Insurance Type 2024 & 2032
- Figure 4: North America Property and Casualty Insurance Industry in US Revenue (Million), by Channel of Distribution 2024 & 2032
- Figure 5: North America Property and Casualty Insurance Industry in US Revenue Share (%), by Channel of Distribution 2024 & 2032
- Figure 6: North America Property and Casualty Insurance Industry in US Revenue (Million), by Country 2024 & 2032
- Figure 7: North America Property and Casualty Insurance Industry in US Revenue Share (%), by Country 2024 & 2032
- Figure 8: South America Property and Casualty Insurance Industry in US Revenue (Million), by Insurance Type 2024 & 2032
- Figure 9: South America Property and Casualty Insurance Industry in US Revenue Share (%), by Insurance Type 2024 & 2032
- Figure 10: South America Property and Casualty Insurance Industry in US Revenue (Million), by Channel of Distribution 2024 & 2032
- Figure 11: South America Property and Casualty Insurance Industry in US Revenue Share (%), by Channel of Distribution 2024 & 2032
- Figure 12: South America Property and Casualty Insurance Industry in US Revenue (Million), by Country 2024 & 2032
- Figure 13: South America Property and Casualty Insurance Industry in US Revenue Share (%), by Country 2024 & 2032
- Figure 14: Europe Property and Casualty Insurance Industry in US Revenue (Million), by Insurance Type 2024 & 2032
- Figure 15: Europe Property and Casualty Insurance Industry in US Revenue Share (%), by Insurance Type 2024 & 2032
- Figure 16: Europe Property and Casualty Insurance Industry in US Revenue (Million), by Channel of Distribution 2024 & 2032
- Figure 17: Europe Property and Casualty Insurance Industry in US Revenue Share (%), by Channel of Distribution 2024 & 2032
- Figure 18: Europe Property and Casualty Insurance Industry in US Revenue (Million), by Country 2024 & 2032
- Figure 19: Europe Property and Casualty Insurance Industry in US Revenue Share (%), by Country 2024 & 2032
- Figure 20: Middle East & Africa Property and Casualty Insurance Industry in US Revenue (Million), by Insurance Type 2024 & 2032
- Figure 21: Middle East & Africa Property and Casualty Insurance Industry in US Revenue Share (%), by Insurance Type 2024 & 2032
- Figure 22: Middle East & Africa Property and Casualty Insurance Industry in US Revenue (Million), by Channel of Distribution 2024 & 2032
- Figure 23: Middle East & Africa Property and Casualty Insurance Industry in US Revenue Share (%), by Channel of Distribution 2024 & 2032
- Figure 24: Middle East & Africa Property and Casualty Insurance Industry in US Revenue (Million), by Country 2024 & 2032
- Figure 25: Middle East & Africa Property and Casualty Insurance Industry in US Revenue Share (%), by Country 2024 & 2032
- Figure 26: Asia Pacific Property and Casualty Insurance Industry in US Revenue (Million), by Insurance Type 2024 & 2032
- Figure 27: Asia Pacific Property and Casualty Insurance Industry in US Revenue Share (%), by Insurance Type 2024 & 2032
- Figure 28: Asia Pacific Property and Casualty Insurance Industry in US Revenue (Million), by Channel of Distribution 2024 & 2032
- Figure 29: Asia Pacific Property and Casualty Insurance Industry in US Revenue Share (%), by Channel of Distribution 2024 & 2032
- Figure 30: Asia Pacific Property and Casualty Insurance Industry in US Revenue (Million), by Country 2024 & 2032
- Figure 31: Asia Pacific Property and Casualty Insurance Industry in US Revenue Share (%), by Country 2024 & 2032
List of Tables
- Table 1: Global Property and Casualty Insurance Industry in US Revenue Million Forecast, by Region 2019 & 2032
- Table 2: Global Property and Casualty Insurance Industry in US Revenue Million Forecast, by Insurance Type 2019 & 2032
- Table 3: Global Property and Casualty Insurance Industry in US Revenue Million Forecast, by Channel of Distribution 2019 & 2032
- Table 4: Global Property and Casualty Insurance Industry in US Revenue Million Forecast, by Region 2019 & 2032
- Table 5: Global Property and Casualty Insurance Industry in US Revenue Million Forecast, by Insurance Type 2019 & 2032
- Table 6: Global Property and Casualty Insurance Industry in US Revenue Million Forecast, by Channel of Distribution 2019 & 2032
- Table 7: Global Property and Casualty Insurance Industry in US Revenue Million Forecast, by Country 2019 & 2032
- Table 8: United States Property and Casualty Insurance Industry in US Revenue (Million) Forecast, by Application 2019 & 2032
- Table 9: Canada Property and Casualty Insurance Industry in US Revenue (Million) Forecast, by Application 2019 & 2032
- Table 10: Mexico Property and Casualty Insurance Industry in US Revenue (Million) Forecast, by Application 2019 & 2032
- Table 11: Global Property and Casualty Insurance Industry in US Revenue Million Forecast, by Insurance Type 2019 & 2032
- Table 12: Global Property and Casualty Insurance Industry in US Revenue Million Forecast, by Channel of Distribution 2019 & 2032
- Table 13: Global Property and Casualty Insurance Industry in US Revenue Million Forecast, by Country 2019 & 2032
- Table 14: Brazil Property and Casualty Insurance Industry in US Revenue (Million) Forecast, by Application 2019 & 2032
- Table 15: Argentina Property and Casualty Insurance Industry in US Revenue (Million) Forecast, by Application 2019 & 2032
- Table 16: Rest of South America Property and Casualty Insurance Industry in US Revenue (Million) Forecast, by Application 2019 & 2032
- Table 17: Global Property and Casualty Insurance Industry in US Revenue Million Forecast, by Insurance Type 2019 & 2032
- Table 18: Global Property and Casualty Insurance Industry in US Revenue Million Forecast, by Channel of Distribution 2019 & 2032
- Table 19: Global Property and Casualty Insurance Industry in US Revenue Million Forecast, by Country 2019 & 2032
- Table 20: United Kingdom Property and Casualty Insurance Industry in US Revenue (Million) Forecast, by Application 2019 & 2032
- Table 21: Germany Property and Casualty Insurance Industry in US Revenue (Million) Forecast, by Application 2019 & 2032
- Table 22: France Property and Casualty Insurance Industry in US Revenue (Million) Forecast, by Application 2019 & 2032
- Table 23: Italy Property and Casualty Insurance Industry in US Revenue (Million) Forecast, by Application 2019 & 2032
- Table 24: Spain Property and Casualty Insurance Industry in US Revenue (Million) Forecast, by Application 2019 & 2032
- Table 25: Russia Property and Casualty Insurance Industry in US Revenue (Million) Forecast, by Application 2019 & 2032
- Table 26: Benelux Property and Casualty Insurance Industry in US Revenue (Million) Forecast, by Application 2019 & 2032
- Table 27: Nordics Property and Casualty Insurance Industry in US Revenue (Million) Forecast, by Application 2019 & 2032
- Table 28: Rest of Europe Property and Casualty Insurance Industry in US Revenue (Million) Forecast, by Application 2019 & 2032
- Table 29: Global Property and Casualty Insurance Industry in US Revenue Million Forecast, by Insurance Type 2019 & 2032
- Table 30: Global Property and Casualty Insurance Industry in US Revenue Million Forecast, by Channel of Distribution 2019 & 2032
- Table 31: Global Property and Casualty Insurance Industry in US Revenue Million Forecast, by Country 2019 & 2032
- Table 32: Turkey Property and Casualty Insurance Industry in US Revenue (Million) Forecast, by Application 2019 & 2032
- Table 33: Israel Property and Casualty Insurance Industry in US Revenue (Million) Forecast, by Application 2019 & 2032
- Table 34: GCC Property and Casualty Insurance Industry in US Revenue (Million) Forecast, by Application 2019 & 2032
- Table 35: North Africa Property and Casualty Insurance Industry in US Revenue (Million) Forecast, by Application 2019 & 2032
- Table 36: South Africa Property and Casualty Insurance Industry in US Revenue (Million) Forecast, by Application 2019 & 2032
- Table 37: Rest of Middle East & Africa Property and Casualty Insurance Industry in US Revenue (Million) Forecast, by Application 2019 & 2032
- Table 38: Global Property and Casualty Insurance Industry in US Revenue Million Forecast, by Insurance Type 2019 & 2032
- Table 39: Global Property and Casualty Insurance Industry in US Revenue Million Forecast, by Channel of Distribution 2019 & 2032
- Table 40: Global Property and Casualty Insurance Industry in US Revenue Million Forecast, by Country 2019 & 2032
- Table 41: China Property and Casualty Insurance Industry in US Revenue (Million) Forecast, by Application 2019 & 2032
- Table 42: India Property and Casualty Insurance Industry in US Revenue (Million) Forecast, by Application 2019 & 2032
- Table 43: Japan Property and Casualty Insurance Industry in US Revenue (Million) Forecast, by Application 2019 & 2032
- Table 44: South Korea Property and Casualty Insurance Industry in US Revenue (Million) Forecast, by Application 2019 & 2032
- Table 45: ASEAN Property and Casualty Insurance Industry in US Revenue (Million) Forecast, by Application 2019 & 2032
- Table 46: Oceania Property and Casualty Insurance Industry in US Revenue (Million) Forecast, by Application 2019 & 2032
- Table 47: Rest of Asia Pacific Property and Casualty Insurance Industry in US Revenue (Million) Forecast, by Application 2019 & 2032
Frequently Asked Questions
1. What is the projected Compound Annual Growth Rate (CAGR) of the Property and Casualty Insurance Industry in US?
The projected CAGR is approximately < 6.00%.
2. Which companies are prominent players in the Property and Casualty Insurance Industry in US?
Key companies in the market include Berkshire Hathaway Inc, American International Group Inc, Liberty Mutual Holding Company Inc, The Progressive Corporation, The Travelers Companies Inc, United Services Automobile Association, Farmers Group Inc, American Family Mutual Insurance Company S I, W R Berkley Corporation, American Financial Group Inc *List Not Exhaustive.
3. What are the main segments of the Property and Casualty Insurance Industry in US?
The market segments include Insurance Type, Channel of Distribution.
4. Can you provide details about the market size?
The market size is estimated to be USD XX Million as of 2022.
5. What are some drivers contributing to market growth?
N/A
6. What are the notable trends driving market growth?
RPA is Going to Help in Quick Process:.
7. Are there any restraints impacting market growth?
N/A
8. Can you provide examples of recent developments in the market?
N/A
9. What pricing options are available for accessing the report?
Pricing options include single-user, multi-user, and enterprise licenses priced at USD 3800, USD 4500, and USD 5800 respectively.
10. Is the market size provided in terms of value or volume?
The market size is provided in terms of value, measured in Million.
11. Are there any specific market keywords associated with the report?
Yes, the market keyword associated with the report is "Property and Casualty Insurance Industry in US," which aids in identifying and referencing the specific market segment covered.
12. How do I determine which pricing option suits my needs best?
The pricing options vary based on user requirements and access needs. Individual users may opt for single-user licenses, while businesses requiring broader access may choose multi-user or enterprise licenses for cost-effective access to the report.
13. Are there any additional resources or data provided in the Property and Casualty Insurance Industry in US report?
While the report offers comprehensive insights, it's advisable to review the specific contents or supplementary materials provided to ascertain if additional resources or data are available.
14. How can I stay updated on further developments or reports in the Property and Casualty Insurance Industry in US?
To stay informed about further developments, trends, and reports in the Property and Casualty Insurance Industry in US, consider subscribing to industry newsletters, following relevant companies and organizations, or regularly checking reputable industry news sources and publications.
Methodology
Step 1 - Identification of Relevant Samples Size from Population Database


Step 2 - Approaches for Defining Global Market Size (Value, Volume* & Price*)

Note*: In applicable scenarios
Step 3 - Data Sources
Primary Research
- Web Analytics
- Survey Reports
- Research Institute
- Latest Research Reports
- Opinion Leaders
Secondary Research
- Annual Reports
- White Paper
- Latest Press Release
- Industry Association
- Paid Database
- Investor Presentations

Step 4 - Data Triangulation
Involves using different sources of information in order to increase the validity of a study
These sources are likely to be stakeholders in a program - participants, other researchers, program staff, other community members, and so on.
Then we put all data in single framework & apply various statistical tools to find out the dynamic on the market.
During the analysis stage, feedback from the stakeholder groups would be compared to determine areas of agreement as well as areas of divergence


