
Key Insights
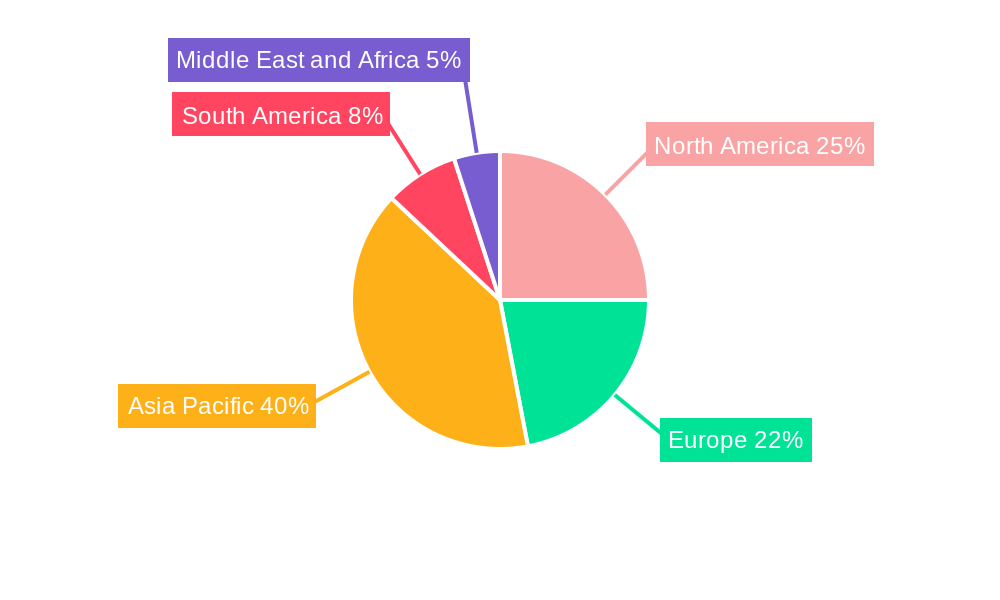
The global PU Sole Footwear Polyurethane market is experiencing robust growth, driven by the increasing demand for comfortable, durable, and lightweight footwear across various applications. The market's Compound Annual Growth Rate (CAGR) exceeding 5% indicates a significant upward trajectory projected through 2033. Key drivers include the expanding athletic footwear sector, particularly the rising popularity of running shoes and athletic sneakers which necessitate high-performance PU soles. The growing preference for lightweight yet supportive footwear in casual wear and the ongoing development of advanced PU formulations with enhanced cushioning and durability further fuel market expansion. Segmentation reveals a strong presence of PU foam and PU adhesives as primary materials, indicating substantial opportunities for material suppliers. Geographically, the Asia-Pacific region, spearheaded by China and India's burgeoning footwear industries, dominates the market, followed by North America and Europe. However, emerging markets in South America and the Middle East and Africa present considerable untapped potential for future growth. The market faces challenges such as fluctuating raw material prices and environmental concerns related to PU production; however, ongoing innovation in sustainable and eco-friendly PU materials is mitigating these restraints. The competitive landscape includes major players like BASF, Dow, and Huntsman, alongside regional manufacturers, suggesting a dynamic and competitive market structure. The forecast period (2025-2033) promises continued expansion, driven by evolving consumer preferences and technological advancements in PU sole technology.
The competitive landscape is characterized by a mix of large multinational corporations and regional players. Established players leverage their extensive distribution networks and brand recognition to maintain market share, while smaller companies focus on innovation and niche applications to gain a foothold. Strategic partnerships and collaborations are becoming increasingly common as companies seek to expand their product offerings and access new markets. The market is expected to see consolidation in the coming years, with larger players potentially acquiring smaller companies to strengthen their market positions. Further research and development efforts are focused on improving the performance characteristics of PU soles, such as increasing their durability, cushioning, and flexibility while minimizing environmental impact. This ongoing innovation, coupled with the growing demand for comfortable and stylish footwear, will continue to drive the growth of the PU Sole Footwear Polyurethane market throughout the forecast period.
PU Sole Footwear Polyurethane Market: A Comprehensive Report (2019-2033)
This detailed report provides a comprehensive analysis of the PU Sole Footwear Polyurethane market, offering invaluable insights for industry stakeholders. Covering the period 2019-2033, with a focus on 2025, this report examines market dynamics, segmentation, leading players, and future trends. The study period spans 2019-2024 (Historical Period), with the base year set at 2025 and the forecast period extending from 2025-2033 (Estimated Year: 2025). This report utilizes Million as the unit for all value figures.
PU Sole Footwear Polyurethane Market Market Concentration & Innovation
This section analyzes the competitive landscape of the PU Sole Footwear Polyurethane market, evaluating market concentration, innovation drivers, regulatory influences, and industry dynamics. The market is characterized by a moderately concentrated structure with several major players holding significant market share. However, the presence of numerous smaller specialized companies indicates a dynamic environment open to innovation.
- Market Concentration: The top five players hold an estimated xx% market share in 2025, while the remaining share is distributed among numerous smaller companies. Further analysis of market share is provided within the full report.
- Innovation Drivers: Continuous advancements in polyurethane technology, focusing on improved durability, comfort, and sustainability, are key drivers of innovation. The demand for lightweight, high-performance footwear is fueling the development of novel PU formulations.
- Regulatory Frameworks: Regulations related to chemical safety and environmental impact are influencing the market. Companies are investing in eco-friendly PU alternatives and compliant manufacturing processes.
- Product Substitutes: Alternatives such as EVA and TPR exist, but PU retains a competitive advantage due to its superior cushioning, flexibility, and durability. The report explores the competitive dynamics between these materials in detail.
- End-User Trends: Growing consumer preference for athletic footwear, along with increasing demand for sustainable and ethically produced products, significantly impacts market growth.
- M&A Activities: The report details mergers and acquisitions, analyzing their impact on market concentration and technological advancements. The total value of M&A deals in the PU Sole Footwear Polyurethane market between 2019 and 2024 is estimated to be xx Million. Specific deals and their impact are detailed in the full report.
PU Sole Footwear Polyurethane Market Industry Trends & Insights
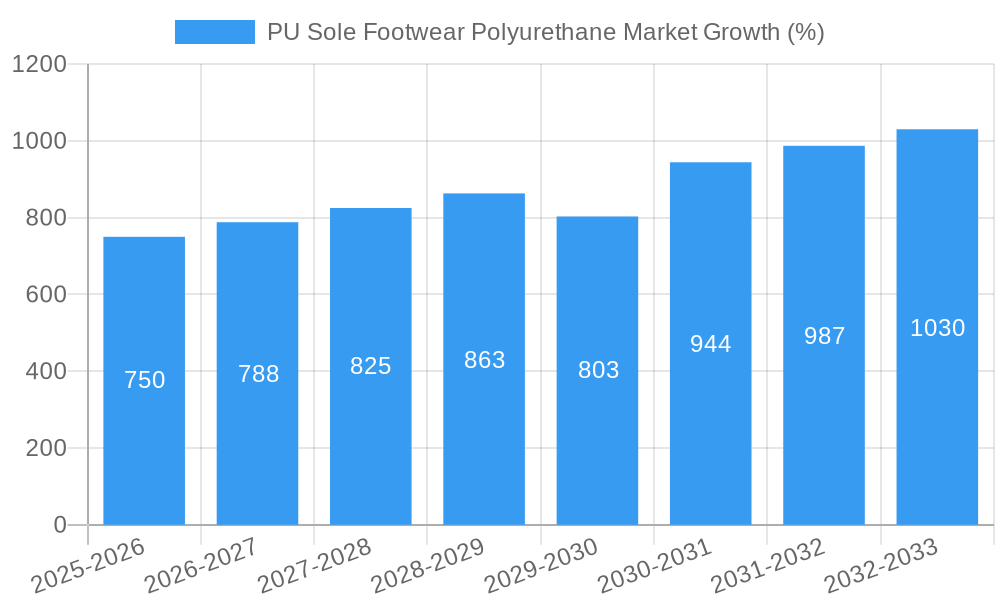
The PU Sole Footwear Polyurethane market is experiencing significant growth, driven by several key factors. The market's Compound Annual Growth Rate (CAGR) is projected to be xx% during the forecast period (2025-2033). Market penetration is expected to increase significantly, particularly in developing economies with rising disposable incomes and increasing consumer demand for footwear.
Technological advancements, particularly in the development of high-performance, sustainable PU formulations, are driving market growth. Consumer preferences are shifting towards comfortable, lightweight, and durable footwear, aligning with the advantages offered by PU soles. The competitive dynamics are characterized by both intense competition among established players and the emergence of new innovative companies. The report further analyzes the individual impact of these factors, along with regional variations and market specifics.
Dominant Markets & Segments in PU Sole Footwear Polyurethane Market
This section analyzes the dominant regions, countries, and segments within the PU Sole Footwear Polyurethane market. The report comprehensively covers the key application and material segments.
Dominant Application Segment: The athletic footwear segment is projected to dominate the market, driven by its high growth rate and increasing consumer preference for performance footwear.
- Key Drivers for Athletic Footwear:
- High demand for sports and athletic activities.
- Increasing disposable incomes leading to higher spending on footwear.
- Technological advancements resulting in lighter, more comfortable and durable footwear.
Dominant Material Segment: PU foam accounts for the largest market share due to its widespread use in various footwear types.
- Key Drivers for PU Foam:
- Excellent cushioning and shock absorption properties.
- Versatile processing capabilities for different designs and shapes.
- Cost-effectiveness compared to other alternatives.
The report provides a thorough analysis of each segment, including market size, growth projections, and competitive dynamics, considering factors such as regional economic growth, government policies, and consumer trends. Regional dominance varies based on factors such as manufacturing infrastructure, local policies and consumer buying patterns. Detailed analyses of regional market dominance are available within the full report.
PU Sole Footwear Polyurethane Market Product Developments
Recent product innovations focus on enhanced durability, lightweight designs, and sustainable materials. Companies are developing PU formulations with improved resilience, water resistance, and reduced environmental impact. These innovations cater to the increasing demand for high-performance footwear that meets consumer expectations for both performance and environmental responsibility. Furthermore, the development of customized PU solutions that meet the specific needs of individual footwear brands forms an essential part of the current innovation landscape.
Report Scope & Segmentation Analysis
This report segments the PU Sole Footwear Polyurethane market by application (Athletic Footwear, Leather Footwear, Sneakers, Textile & Other Footwear) and material (PU Foam, PU Adhesives, Others). Each segment's growth projections, market size, and competitive dynamics are analyzed in detail. The report provides individual market size and growth projections for each of these segments based on historical data and forecast estimations. The competitive landscape within each segment is explored by examining leading players' market positioning, strategies, and competitive advantages.
Key Drivers of PU Sole Footwear Polyurethane Market Growth
Several factors drive the market's growth. These include rising global footwear demand fueled by population growth and increasing disposable incomes, particularly in developing economies. Technological advancements resulting in improved PU formulations, enhanced comfort, durability, and sustainability further contribute to market expansion. Government regulations promoting sustainable manufacturing practices are also influencing market growth by encouraging the adoption of eco-friendly PU alternatives.
Challenges in the PU Sole Footwear Polyurethane Market Sector
The market faces challenges such as fluctuations in raw material prices and supply chain disruptions impacting production costs and product availability. Stringent environmental regulations impose constraints on manufacturing processes and necessitate the development of more sustainable PU formulations. Intense competition among existing players adds pressure to maintain profitability and market share. Price volatility of raw materials, particularly isocyanates, has a significant impact on the profitability of PU footwear manufacturers. This report includes quantitative analysis of the impact of such challenges.
Emerging Opportunities in PU Sole Footwear Polyurethane Market
Emerging opportunities include the growing demand for sustainable and recyclable PU alternatives. The increasing popularity of personalized and customized footwear is creating opportunities for specialized PU solutions. Expansion into new markets, particularly in developing countries experiencing rapid economic growth, offers significant potential for market expansion. The increasing adoption of technologically advanced manufacturing processes such as 3D printing of footwear components utilizing PU presents a lucrative opportunity for market participants.
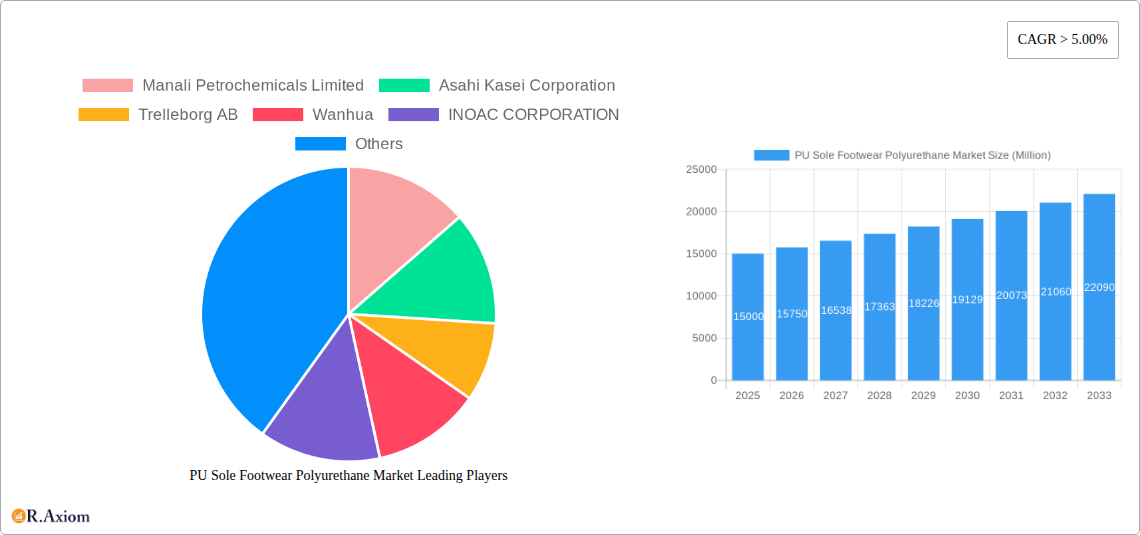
Leading Players in the PU Sole Footwear Polyurethane Market Market
- Manali Petrochemicals Limited
- Asahi Kasei Corporation
- Trelleborg AB
- Wanhua
- INOAC CORPORATION
- Rogers Corporation
- LANXESS
- BASF SE
- Huntsman International LLC
- Dow
- The Lubrizol Corporation
- Covestro AG
- Kasodur
- Era Polymers Pty Ltd
- Coim Group
Key Developments in PU Sole Footwear Polyurethane Market Industry
- December 2022: BASF and Berkat Safety launched KAMU safety boots, utilizing BASF's TPU and E-TPU materials, highlighting advancements in comfort, energy return, and slip resistance.
- October 2022: BASF SE opened a new Polyurethane Application Development Laboratory in Mumbai, India, strengthening collaboration with Indian footwear manufacturers and boosting regional market growth.
Strategic Outlook for PU Sole Footwear Polyurethane Market Market
The PU Sole Footwear Polyurethane market is poised for continued growth, driven by technological innovation, expanding global footwear demand, and a rising focus on sustainability. Opportunities lie in developing eco-friendly PU alternatives, personalized footwear solutions, and expanding into new and emerging markets. Companies that successfully adapt to evolving consumer preferences and technological advancements will be best positioned for future success.
PU Sole Footwear Polyurethane Market Segmentation
-
1. Material
- 1.1. PU Foam
- 1.2. PU Adhesives
- 1.3. Others
-
2. Application
- 2.1. Athletic Footwear
- 2.2. Leather Footwear
- 2.3. Sneakers
- 2.4. Textile & Other Footwear
PU Sole Footwear Polyurethane Market Segmentation By Geography
-
1. Asia Pacific
- 1.1. China
- 1.2. India
- 1.3. Japan
- 1.4. South Korea
- 1.5. Rest of Asia Pacific
-
2. North America
- 2.1. United States
- 2.2. Canada
- 2.3. Mexico
-
3. Europe
- 3.1. Germany
- 3.2. United Kingdom
- 3.3. France
- 3.4. Italy
- 3.5. Rest of Europe
-
4. South America
- 4.1. Brazil
- 4.2. Argentina
- 4.3. Rest of South America
-
5. Middle East and Africa
- 5.1. Saudi Arabia
- 5.2. South Africa
- 5.3. Rest of Middle East and Africa
PU Sole Footwear Polyurethane Market REPORT HIGHLIGHTS
| Aspects | Details |
|---|---|
| Study Period | 2019-2033 |
| Base Year | 2024 |
| Estimated Year | 2025 |
| Forecast Period | 2025-2033 |
| Historical Period | 2019-2024 |
| Growth Rate | CAGR of > 5.00% from 2019-2033 |
| Segmentation |
|
Table of Contents
- 1. Introduction
- 1.1. Research Scope
- 1.2. Market Segmentation
- 1.3. Research Methodology
- 1.4. Definitions and Assumptions
- 2. Executive Summary
- 2.1. Introduction
- 3. Market Dynamics
- 3.1. Introduction
- 3.2. Market Drivers
- 3.2.1. The Growth in the Production and Sales of Footwear; Superior Properties of Polyurethane as Shoes Sole Material; The rising demand for Athletic Footwear
- 3.3. Market Restrains
- 3.3.1. High Cost of Polyurethane Soles used in Footwear applications; Increasing Environmental Concerns
- 3.4. Market Trends
- 3.4.1. The Rise in Athletic Footwear Production and Consumption
- 4. Market Factor Analysis
- 4.1. Porters Five Forces
- 4.2. Supply/Value Chain
- 4.3. PESTEL analysis
- 4.4. Market Entropy
- 4.5. Patent/Trademark Analysis
- 5. Global PU Sole Footwear Polyurethane Market Analysis, Insights and Forecast, 2019-2031
- 5.1. Market Analysis, Insights and Forecast - by Material
- 5.1.1. PU Foam
- 5.1.2. PU Adhesives
- 5.1.3. Others
- 5.2. Market Analysis, Insights and Forecast - by Application
- 5.2.1. Athletic Footwear
- 5.2.2. Leather Footwear
- 5.2.3. Sneakers
- 5.2.4. Textile & Other Footwear
- 5.3. Market Analysis, Insights and Forecast - by Region
- 5.3.1. Asia Pacific
- 5.3.2. North America
- 5.3.3. Europe
- 5.3.4. South America
- 5.3.5. Middle East and Africa
- 5.1. Market Analysis, Insights and Forecast - by Material
- 6. Asia Pacific PU Sole Footwear Polyurethane Market Analysis, Insights and Forecast, 2019-2031
- 6.1. Market Analysis, Insights and Forecast - by Material
- 6.1.1. PU Foam
- 6.1.2. PU Adhesives
- 6.1.3. Others
- 6.2. Market Analysis, Insights and Forecast - by Application
- 6.2.1. Athletic Footwear
- 6.2.2. Leather Footwear
- 6.2.3. Sneakers
- 6.2.4. Textile & Other Footwear
- 6.1. Market Analysis, Insights and Forecast - by Material
- 7. North America PU Sole Footwear Polyurethane Market Analysis, Insights and Forecast, 2019-2031
- 7.1. Market Analysis, Insights and Forecast - by Material
- 7.1.1. PU Foam
- 7.1.2. PU Adhesives
- 7.1.3. Others
- 7.2. Market Analysis, Insights and Forecast - by Application
- 7.2.1. Athletic Footwear
- 7.2.2. Leather Footwear
- 7.2.3. Sneakers
- 7.2.4. Textile & Other Footwear
- 7.1. Market Analysis, Insights and Forecast - by Material
- 8. Europe PU Sole Footwear Polyurethane Market Analysis, Insights and Forecast, 2019-2031
- 8.1. Market Analysis, Insights and Forecast - by Material
- 8.1.1. PU Foam
- 8.1.2. PU Adhesives
- 8.1.3. Others
- 8.2. Market Analysis, Insights and Forecast - by Application
- 8.2.1. Athletic Footwear
- 8.2.2. Leather Footwear
- 8.2.3. Sneakers
- 8.2.4. Textile & Other Footwear
- 8.1. Market Analysis, Insights and Forecast - by Material
- 9. South America PU Sole Footwear Polyurethane Market Analysis, Insights and Forecast, 2019-2031
- 9.1. Market Analysis, Insights and Forecast - by Material
- 9.1.1. PU Foam
- 9.1.2. PU Adhesives
- 9.1.3. Others
- 9.2. Market Analysis, Insights and Forecast - by Application
- 9.2.1. Athletic Footwear
- 9.2.2. Leather Footwear
- 9.2.3. Sneakers
- 9.2.4. Textile & Other Footwear
- 9.1. Market Analysis, Insights and Forecast - by Material
- 10. Middle East and Africa PU Sole Footwear Polyurethane Market Analysis, Insights and Forecast, 2019-2031
- 10.1. Market Analysis, Insights and Forecast - by Material
- 10.1.1. PU Foam
- 10.1.2. PU Adhesives
- 10.1.3. Others
- 10.2. Market Analysis, Insights and Forecast - by Application
- 10.2.1. Athletic Footwear
- 10.2.2. Leather Footwear
- 10.2.3. Sneakers
- 10.2.4. Textile & Other Footwear
- 10.1. Market Analysis, Insights and Forecast - by Material
- 11. Asia Pacific PU Sole Footwear Polyurethane Market Analysis, Insights and Forecast, 2019-2031
- 11.1. Market Analysis, Insights and Forecast - By Country/Sub-region
- 11.1.1 China
- 11.1.2 India
- 11.1.3 Japan
- 11.1.4 South Korea
- 11.1.5 Rest of Asia Pacific
- 12. North America PU Sole Footwear Polyurethane Market Analysis, Insights and Forecast, 2019-2031
- 12.1. Market Analysis, Insights and Forecast - By Country/Sub-region
- 12.1.1 United States
- 12.1.2 Canada
- 12.1.3 Mexico
- 13. Europe PU Sole Footwear Polyurethane Market Analysis, Insights and Forecast, 2019-2031
- 13.1. Market Analysis, Insights and Forecast - By Country/Sub-region
- 13.1.1 Germany
- 13.1.2 United Kingdom
- 13.1.3 France
- 13.1.4 Italy
- 13.1.5 Rest of Europe
- 14. South America PU Sole Footwear Polyurethane Market Analysis, Insights and Forecast, 2019-2031
- 14.1. Market Analysis, Insights and Forecast - By Country/Sub-region
- 14.1.1 Brazil
- 14.1.2 Argentina
- 14.1.3 Rest of South America
- 15. Middle East and Africa PU Sole Footwear Polyurethane Market Analysis, Insights and Forecast, 2019-2031
- 15.1. Market Analysis, Insights and Forecast - By Country/Sub-region
- 15.1.1 Saudi Arabia
- 15.1.2 South Africa
- 15.1.3 Rest of Middle East and Africa
- 16. Competitive Analysis
- 16.1. Global Market Share Analysis 2024
- 16.2. Company Profiles
- 16.2.1 Manali Petrochemicals Limited
- 16.2.1.1. Overview
- 16.2.1.2. Products
- 16.2.1.3. SWOT Analysis
- 16.2.1.4. Recent Developments
- 16.2.1.5. Financials (Based on Availability)
- 16.2.2 Asahi Kasei Corporation
- 16.2.2.1. Overview
- 16.2.2.2. Products
- 16.2.2.3. SWOT Analysis
- 16.2.2.4. Recent Developments
- 16.2.2.5. Financials (Based on Availability)
- 16.2.3 Trelleborg AB
- 16.2.3.1. Overview
- 16.2.3.2. Products
- 16.2.3.3. SWOT Analysis
- 16.2.3.4. Recent Developments
- 16.2.3.5. Financials (Based on Availability)
- 16.2.4 Wanhua
- 16.2.4.1. Overview
- 16.2.4.2. Products
- 16.2.4.3. SWOT Analysis
- 16.2.4.4. Recent Developments
- 16.2.4.5. Financials (Based on Availability)
- 16.2.5 INOAC CORPORATION
- 16.2.5.1. Overview
- 16.2.5.2. Products
- 16.2.5.3. SWOT Analysis
- 16.2.5.4. Recent Developments
- 16.2.5.5. Financials (Based on Availability)
- 16.2.6 Rogers Corporation
- 16.2.6.1. Overview
- 16.2.6.2. Products
- 16.2.6.3. SWOT Analysis
- 16.2.6.4. Recent Developments
- 16.2.6.5. Financials (Based on Availability)
- 16.2.7 LANXESS
- 16.2.7.1. Overview
- 16.2.7.2. Products
- 16.2.7.3. SWOT Analysis
- 16.2.7.4. Recent Developments
- 16.2.7.5. Financials (Based on Availability)
- 16.2.8 BASF SE
- 16.2.8.1. Overview
- 16.2.8.2. Products
- 16.2.8.3. SWOT Analysis
- 16.2.8.4. Recent Developments
- 16.2.8.5. Financials (Based on Availability)
- 16.2.9 Huntsman International LLC
- 16.2.9.1. Overview
- 16.2.9.2. Products
- 16.2.9.3. SWOT Analysis
- 16.2.9.4. Recent Developments
- 16.2.9.5. Financials (Based on Availability)
- 16.2.10 Dow
- 16.2.10.1. Overview
- 16.2.10.2. Products
- 16.2.10.3. SWOT Analysis
- 16.2.10.4. Recent Developments
- 16.2.10.5. Financials (Based on Availability)
- 16.2.11 The Lubrizol Corporation
- 16.2.11.1. Overview
- 16.2.11.2. Products
- 16.2.11.3. SWOT Analysis
- 16.2.11.4. Recent Developments
- 16.2.11.5. Financials (Based on Availability)
- 16.2.12 Covestro AG
- 16.2.12.1. Overview
- 16.2.12.2. Products
- 16.2.12.3. SWOT Analysis
- 16.2.12.4. Recent Developments
- 16.2.12.5. Financials (Based on Availability)
- 16.2.13 Kasodur
- 16.2.13.1. Overview
- 16.2.13.2. Products
- 16.2.13.3. SWOT Analysis
- 16.2.13.4. Recent Developments
- 16.2.13.5. Financials (Based on Availability)
- 16.2.14 Era Polymers Pty Ltd
- 16.2.14.1. Overview
- 16.2.14.2. Products
- 16.2.14.3. SWOT Analysis
- 16.2.14.4. Recent Developments
- 16.2.14.5. Financials (Based on Availability)
- 16.2.15 Coim Group
- 16.2.15.1. Overview
- 16.2.15.2. Products
- 16.2.15.3. SWOT Analysis
- 16.2.15.4. Recent Developments
- 16.2.15.5. Financials (Based on Availability)
- 16.2.1 Manali Petrochemicals Limited
List of Figures
- Figure 1: Global PU Sole Footwear Polyurethane Market Revenue Breakdown (Million, %) by Region 2024 & 2032
- Figure 2: Global PU Sole Footwear Polyurethane Market Volume Breakdown (K Tons, %) by Region 2024 & 2032
- Figure 3: Asia Pacific PU Sole Footwear Polyurethane Market Revenue (Million), by Country 2024 & 2032
- Figure 4: Asia Pacific PU Sole Footwear Polyurethane Market Volume (K Tons), by Country 2024 & 2032
- Figure 5: Asia Pacific PU Sole Footwear Polyurethane Market Revenue Share (%), by Country 2024 & 2032
- Figure 6: Asia Pacific PU Sole Footwear Polyurethane Market Volume Share (%), by Country 2024 & 2032
- Figure 7: North America PU Sole Footwear Polyurethane Market Revenue (Million), by Country 2024 & 2032
- Figure 8: North America PU Sole Footwear Polyurethane Market Volume (K Tons), by Country 2024 & 2032
- Figure 9: North America PU Sole Footwear Polyurethane Market Revenue Share (%), by Country 2024 & 2032
- Figure 10: North America PU Sole Footwear Polyurethane Market Volume Share (%), by Country 2024 & 2032
- Figure 11: Europe PU Sole Footwear Polyurethane Market Revenue (Million), by Country 2024 & 2032
- Figure 12: Europe PU Sole Footwear Polyurethane Market Volume (K Tons), by Country 2024 & 2032
- Figure 13: Europe PU Sole Footwear Polyurethane Market Revenue Share (%), by Country 2024 & 2032
- Figure 14: Europe PU Sole Footwear Polyurethane Market Volume Share (%), by Country 2024 & 2032
- Figure 15: South America PU Sole Footwear Polyurethane Market Revenue (Million), by Country 2024 & 2032
- Figure 16: South America PU Sole Footwear Polyurethane Market Volume (K Tons), by Country 2024 & 2032
- Figure 17: South America PU Sole Footwear Polyurethane Market Revenue Share (%), by Country 2024 & 2032
- Figure 18: South America PU Sole Footwear Polyurethane Market Volume Share (%), by Country 2024 & 2032
- Figure 19: Middle East and Africa PU Sole Footwear Polyurethane Market Revenue (Million), by Country 2024 & 2032
- Figure 20: Middle East and Africa PU Sole Footwear Polyurethane Market Volume (K Tons), by Country 2024 & 2032
- Figure 21: Middle East and Africa PU Sole Footwear Polyurethane Market Revenue Share (%), by Country 2024 & 2032
- Figure 22: Middle East and Africa PU Sole Footwear Polyurethane Market Volume Share (%), by Country 2024 & 2032
- Figure 23: Asia Pacific PU Sole Footwear Polyurethane Market Revenue (Million), by Material 2024 & 2032
- Figure 24: Asia Pacific PU Sole Footwear Polyurethane Market Volume (K Tons), by Material 2024 & 2032
- Figure 25: Asia Pacific PU Sole Footwear Polyurethane Market Revenue Share (%), by Material 2024 & 2032
- Figure 26: Asia Pacific PU Sole Footwear Polyurethane Market Volume Share (%), by Material 2024 & 2032
- Figure 27: Asia Pacific PU Sole Footwear Polyurethane Market Revenue (Million), by Application 2024 & 2032
- Figure 28: Asia Pacific PU Sole Footwear Polyurethane Market Volume (K Tons), by Application 2024 & 2032
- Figure 29: Asia Pacific PU Sole Footwear Polyurethane Market Revenue Share (%), by Application 2024 & 2032
- Figure 30: Asia Pacific PU Sole Footwear Polyurethane Market Volume Share (%), by Application 2024 & 2032
- Figure 31: Asia Pacific PU Sole Footwear Polyurethane Market Revenue (Million), by Country 2024 & 2032
- Figure 32: Asia Pacific PU Sole Footwear Polyurethane Market Volume (K Tons), by Country 2024 & 2032
- Figure 33: Asia Pacific PU Sole Footwear Polyurethane Market Revenue Share (%), by Country 2024 & 2032
- Figure 34: Asia Pacific PU Sole Footwear Polyurethane Market Volume Share (%), by Country 2024 & 2032
- Figure 35: North America PU Sole Footwear Polyurethane Market Revenue (Million), by Material 2024 & 2032
- Figure 36: North America PU Sole Footwear Polyurethane Market Volume (K Tons), by Material 2024 & 2032
- Figure 37: North America PU Sole Footwear Polyurethane Market Revenue Share (%), by Material 2024 & 2032
- Figure 38: North America PU Sole Footwear Polyurethane Market Volume Share (%), by Material 2024 & 2032
- Figure 39: North America PU Sole Footwear Polyurethane Market Revenue (Million), by Application 2024 & 2032
- Figure 40: North America PU Sole Footwear Polyurethane Market Volume (K Tons), by Application 2024 & 2032
- Figure 41: North America PU Sole Footwear Polyurethane Market Revenue Share (%), by Application 2024 & 2032
- Figure 42: North America PU Sole Footwear Polyurethane Market Volume Share (%), by Application 2024 & 2032
- Figure 43: North America PU Sole Footwear Polyurethane Market Revenue (Million), by Country 2024 & 2032
- Figure 44: North America PU Sole Footwear Polyurethane Market Volume (K Tons), by Country 2024 & 2032
- Figure 45: North America PU Sole Footwear Polyurethane Market Revenue Share (%), by Country 2024 & 2032
- Figure 46: North America PU Sole Footwear Polyurethane Market Volume Share (%), by Country 2024 & 2032
- Figure 47: Europe PU Sole Footwear Polyurethane Market Revenue (Million), by Material 2024 & 2032
- Figure 48: Europe PU Sole Footwear Polyurethane Market Volume (K Tons), by Material 2024 & 2032
- Figure 49: Europe PU Sole Footwear Polyurethane Market Revenue Share (%), by Material 2024 & 2032
- Figure 50: Europe PU Sole Footwear Polyurethane Market Volume Share (%), by Material 2024 & 2032
- Figure 51: Europe PU Sole Footwear Polyurethane Market Revenue (Million), by Application 2024 & 2032
- Figure 52: Europe PU Sole Footwear Polyurethane Market Volume (K Tons), by Application 2024 & 2032
- Figure 53: Europe PU Sole Footwear Polyurethane Market Revenue Share (%), by Application 2024 & 2032
- Figure 54: Europe PU Sole Footwear Polyurethane Market Volume Share (%), by Application 2024 & 2032
- Figure 55: Europe PU Sole Footwear Polyurethane Market Revenue (Million), by Country 2024 & 2032
- Figure 56: Europe PU Sole Footwear Polyurethane Market Volume (K Tons), by Country 2024 & 2032
- Figure 57: Europe PU Sole Footwear Polyurethane Market Revenue Share (%), by Country 2024 & 2032
- Figure 58: Europe PU Sole Footwear Polyurethane Market Volume Share (%), by Country 2024 & 2032
- Figure 59: South America PU Sole Footwear Polyurethane Market Revenue (Million), by Material 2024 & 2032
- Figure 60: South America PU Sole Footwear Polyurethane Market Volume (K Tons), by Material 2024 & 2032
- Figure 61: South America PU Sole Footwear Polyurethane Market Revenue Share (%), by Material 2024 & 2032
- Figure 62: South America PU Sole Footwear Polyurethane Market Volume Share (%), by Material 2024 & 2032
- Figure 63: South America PU Sole Footwear Polyurethane Market Revenue (Million), by Application 2024 & 2032
- Figure 64: South America PU Sole Footwear Polyurethane Market Volume (K Tons), by Application 2024 & 2032
- Figure 65: South America PU Sole Footwear Polyurethane Market Revenue Share (%), by Application 2024 & 2032
- Figure 66: South America PU Sole Footwear Polyurethane Market Volume Share (%), by Application 2024 & 2032
- Figure 67: South America PU Sole Footwear Polyurethane Market Revenue (Million), by Country 2024 & 2032
- Figure 68: South America PU Sole Footwear Polyurethane Market Volume (K Tons), by Country 2024 & 2032
- Figure 69: South America PU Sole Footwear Polyurethane Market Revenue Share (%), by Country 2024 & 2032
- Figure 70: South America PU Sole Footwear Polyurethane Market Volume Share (%), by Country 2024 & 2032
- Figure 71: Middle East and Africa PU Sole Footwear Polyurethane Market Revenue (Million), by Material 2024 & 2032
- Figure 72: Middle East and Africa PU Sole Footwear Polyurethane Market Volume (K Tons), by Material 2024 & 2032
- Figure 73: Middle East and Africa PU Sole Footwear Polyurethane Market Revenue Share (%), by Material 2024 & 2032
- Figure 74: Middle East and Africa PU Sole Footwear Polyurethane Market Volume Share (%), by Material 2024 & 2032
- Figure 75: Middle East and Africa PU Sole Footwear Polyurethane Market Revenue (Million), by Application 2024 & 2032
- Figure 76: Middle East and Africa PU Sole Footwear Polyurethane Market Volume (K Tons), by Application 2024 & 2032
- Figure 77: Middle East and Africa PU Sole Footwear Polyurethane Market Revenue Share (%), by Application 2024 & 2032
- Figure 78: Middle East and Africa PU Sole Footwear Polyurethane Market Volume Share (%), by Application 2024 & 2032
- Figure 79: Middle East and Africa PU Sole Footwear Polyurethane Market Revenue (Million), by Country 2024 & 2032
- Figure 80: Middle East and Africa PU Sole Footwear Polyurethane Market Volume (K Tons), by Country 2024 & 2032
- Figure 81: Middle East and Africa PU Sole Footwear Polyurethane Market Revenue Share (%), by Country 2024 & 2032
- Figure 82: Middle East and Africa PU Sole Footwear Polyurethane Market Volume Share (%), by Country 2024 & 2032
List of Tables
- Table 1: Global PU Sole Footwear Polyurethane Market Revenue Million Forecast, by Region 2019 & 2032
- Table 2: Global PU Sole Footwear Polyurethane Market Volume K Tons Forecast, by Region 2019 & 2032
- Table 3: Global PU Sole Footwear Polyurethane Market Revenue Million Forecast, by Material 2019 & 2032
- Table 4: Global PU Sole Footwear Polyurethane Market Volume K Tons Forecast, by Material 2019 & 2032
- Table 5: Global PU Sole Footwear Polyurethane Market Revenue Million Forecast, by Application 2019 & 2032
- Table 6: Global PU Sole Footwear Polyurethane Market Volume K Tons Forecast, by Application 2019 & 2032
- Table 7: Global PU Sole Footwear Polyurethane Market Revenue Million Forecast, by Region 2019 & 2032
- Table 8: Global PU Sole Footwear Polyurethane Market Volume K Tons Forecast, by Region 2019 & 2032
- Table 9: Global PU Sole Footwear Polyurethane Market Revenue Million Forecast, by Country 2019 & 2032
- Table 10: Global PU Sole Footwear Polyurethane Market Volume K Tons Forecast, by Country 2019 & 2032
- Table 11: China PU Sole Footwear Polyurethane Market Revenue (Million) Forecast, by Application 2019 & 2032
- Table 12: China PU Sole Footwear Polyurethane Market Volume (K Tons) Forecast, by Application 2019 & 2032
- Table 13: India PU Sole Footwear Polyurethane Market Revenue (Million) Forecast, by Application 2019 & 2032
- Table 14: India PU Sole Footwear Polyurethane Market Volume (K Tons) Forecast, by Application 2019 & 2032
- Table 15: Japan PU Sole Footwear Polyurethane Market Revenue (Million) Forecast, by Application 2019 & 2032
- Table 16: Japan PU Sole Footwear Polyurethane Market Volume (K Tons) Forecast, by Application 2019 & 2032
- Table 17: South Korea PU Sole Footwear Polyurethane Market Revenue (Million) Forecast, by Application 2019 & 2032
- Table 18: South Korea PU Sole Footwear Polyurethane Market Volume (K Tons) Forecast, by Application 2019 & 2032
- Table 19: Rest of Asia Pacific PU Sole Footwear Polyurethane Market Revenue (Million) Forecast, by Application 2019 & 2032
- Table 20: Rest of Asia Pacific PU Sole Footwear Polyurethane Market Volume (K Tons) Forecast, by Application 2019 & 2032
- Table 21: Global PU Sole Footwear Polyurethane Market Revenue Million Forecast, by Country 2019 & 2032
- Table 22: Global PU Sole Footwear Polyurethane Market Volume K Tons Forecast, by Country 2019 & 2032
- Table 23: United States PU Sole Footwear Polyurethane Market Revenue (Million) Forecast, by Application 2019 & 2032
- Table 24: United States PU Sole Footwear Polyurethane Market Volume (K Tons) Forecast, by Application 2019 & 2032
- Table 25: Canada PU Sole Footwear Polyurethane Market Revenue (Million) Forecast, by Application 2019 & 2032
- Table 26: Canada PU Sole Footwear Polyurethane Market Volume (K Tons) Forecast, by Application 2019 & 2032
- Table 27: Mexico PU Sole Footwear Polyurethane Market Revenue (Million) Forecast, by Application 2019 & 2032
- Table 28: Mexico PU Sole Footwear Polyurethane Market Volume (K Tons) Forecast, by Application 2019 & 2032
- Table 29: Global PU Sole Footwear Polyurethane Market Revenue Million Forecast, by Country 2019 & 2032
- Table 30: Global PU Sole Footwear Polyurethane Market Volume K Tons Forecast, by Country 2019 & 2032
- Table 31: Germany PU Sole Footwear Polyurethane Market Revenue (Million) Forecast, by Application 2019 & 2032
- Table 32: Germany PU Sole Footwear Polyurethane Market Volume (K Tons) Forecast, by Application 2019 & 2032
- Table 33: United Kingdom PU Sole Footwear Polyurethane Market Revenue (Million) Forecast, by Application 2019 & 2032
- Table 34: United Kingdom PU Sole Footwear Polyurethane Market Volume (K Tons) Forecast, by Application 2019 & 2032
- Table 35: France PU Sole Footwear Polyurethane Market Revenue (Million) Forecast, by Application 2019 & 2032
- Table 36: France PU Sole Footwear Polyurethane Market Volume (K Tons) Forecast, by Application 2019 & 2032
- Table 37: Italy PU Sole Footwear Polyurethane Market Revenue (Million) Forecast, by Application 2019 & 2032
- Table 38: Italy PU Sole Footwear Polyurethane Market Volume (K Tons) Forecast, by Application 2019 & 2032
- Table 39: Rest of Europe PU Sole Footwear Polyurethane Market Revenue (Million) Forecast, by Application 2019 & 2032
- Table 40: Rest of Europe PU Sole Footwear Polyurethane Market Volume (K Tons) Forecast, by Application 2019 & 2032
- Table 41: Global PU Sole Footwear Polyurethane Market Revenue Million Forecast, by Country 2019 & 2032
- Table 42: Global PU Sole Footwear Polyurethane Market Volume K Tons Forecast, by Country 2019 & 2032
- Table 43: Brazil PU Sole Footwear Polyurethane Market Revenue (Million) Forecast, by Application 2019 & 2032
- Table 44: Brazil PU Sole Footwear Polyurethane Market Volume (K Tons) Forecast, by Application 2019 & 2032
- Table 45: Argentina PU Sole Footwear Polyurethane Market Revenue (Million) Forecast, by Application 2019 & 2032
- Table 46: Argentina PU Sole Footwear Polyurethane Market Volume (K Tons) Forecast, by Application 2019 & 2032
- Table 47: Rest of South America PU Sole Footwear Polyurethane Market Revenue (Million) Forecast, by Application 2019 & 2032
- Table 48: Rest of South America PU Sole Footwear Polyurethane Market Volume (K Tons) Forecast, by Application 2019 & 2032
- Table 49: Global PU Sole Footwear Polyurethane Market Revenue Million Forecast, by Country 2019 & 2032
- Table 50: Global PU Sole Footwear Polyurethane Market Volume K Tons Forecast, by Country 2019 & 2032
- Table 51: Saudi Arabia PU Sole Footwear Polyurethane Market Revenue (Million) Forecast, by Application 2019 & 2032
- Table 52: Saudi Arabia PU Sole Footwear Polyurethane Market Volume (K Tons) Forecast, by Application 2019 & 2032
- Table 53: South Africa PU Sole Footwear Polyurethane Market Revenue (Million) Forecast, by Application 2019 & 2032
- Table 54: South Africa PU Sole Footwear Polyurethane Market Volume (K Tons) Forecast, by Application 2019 & 2032
- Table 55: Rest of Middle East and Africa PU Sole Footwear Polyurethane Market Revenue (Million) Forecast, by Application 2019 & 2032
- Table 56: Rest of Middle East and Africa PU Sole Footwear Polyurethane Market Volume (K Tons) Forecast, by Application 2019 & 2032
- Table 57: Global PU Sole Footwear Polyurethane Market Revenue Million Forecast, by Material 2019 & 2032
- Table 58: Global PU Sole Footwear Polyurethane Market Volume K Tons Forecast, by Material 2019 & 2032
- Table 59: Global PU Sole Footwear Polyurethane Market Revenue Million Forecast, by Application 2019 & 2032
- Table 60: Global PU Sole Footwear Polyurethane Market Volume K Tons Forecast, by Application 2019 & 2032
- Table 61: Global PU Sole Footwear Polyurethane Market Revenue Million Forecast, by Country 2019 & 2032
- Table 62: Global PU Sole Footwear Polyurethane Market Volume K Tons Forecast, by Country 2019 & 2032
- Table 63: China PU Sole Footwear Polyurethane Market Revenue (Million) Forecast, by Application 2019 & 2032
- Table 64: China PU Sole Footwear Polyurethane Market Volume (K Tons) Forecast, by Application 2019 & 2032
- Table 65: India PU Sole Footwear Polyurethane Market Revenue (Million) Forecast, by Application 2019 & 2032
- Table 66: India PU Sole Footwear Polyurethane Market Volume (K Tons) Forecast, by Application 2019 & 2032
- Table 67: Japan PU Sole Footwear Polyurethane Market Revenue (Million) Forecast, by Application 2019 & 2032
- Table 68: Japan PU Sole Footwear Polyurethane Market Volume (K Tons) Forecast, by Application 2019 & 2032
- Table 69: South Korea PU Sole Footwear Polyurethane Market Revenue (Million) Forecast, by Application 2019 & 2032
- Table 70: South Korea PU Sole Footwear Polyurethane Market Volume (K Tons) Forecast, by Application 2019 & 2032
- Table 71: Rest of Asia Pacific PU Sole Footwear Polyurethane Market Revenue (Million) Forecast, by Application 2019 & 2032
- Table 72: Rest of Asia Pacific PU Sole Footwear Polyurethane Market Volume (K Tons) Forecast, by Application 2019 & 2032
- Table 73: Global PU Sole Footwear Polyurethane Market Revenue Million Forecast, by Material 2019 & 2032
- Table 74: Global PU Sole Footwear Polyurethane Market Volume K Tons Forecast, by Material 2019 & 2032
- Table 75: Global PU Sole Footwear Polyurethane Market Revenue Million Forecast, by Application 2019 & 2032
- Table 76: Global PU Sole Footwear Polyurethane Market Volume K Tons Forecast, by Application 2019 & 2032
- Table 77: Global PU Sole Footwear Polyurethane Market Revenue Million Forecast, by Country 2019 & 2032
- Table 78: Global PU Sole Footwear Polyurethane Market Volume K Tons Forecast, by Country 2019 & 2032
- Table 79: United States PU Sole Footwear Polyurethane Market Revenue (Million) Forecast, by Application 2019 & 2032
- Table 80: United States PU Sole Footwear Polyurethane Market Volume (K Tons) Forecast, by Application 2019 & 2032
- Table 81: Canada PU Sole Footwear Polyurethane Market Revenue (Million) Forecast, by Application 2019 & 2032
- Table 82: Canada PU Sole Footwear Polyurethane Market Volume (K Tons) Forecast, by Application 2019 & 2032
- Table 83: Mexico PU Sole Footwear Polyurethane Market Revenue (Million) Forecast, by Application 2019 & 2032
- Table 84: Mexico PU Sole Footwear Polyurethane Market Volume (K Tons) Forecast, by Application 2019 & 2032
- Table 85: Global PU Sole Footwear Polyurethane Market Revenue Million Forecast, by Material 2019 & 2032
- Table 86: Global PU Sole Footwear Polyurethane Market Volume K Tons Forecast, by Material 2019 & 2032
- Table 87: Global PU Sole Footwear Polyurethane Market Revenue Million Forecast, by Application 2019 & 2032
- Table 88: Global PU Sole Footwear Polyurethane Market Volume K Tons Forecast, by Application 2019 & 2032
- Table 89: Global PU Sole Footwear Polyurethane Market Revenue Million Forecast, by Country 2019 & 2032
- Table 90: Global PU Sole Footwear Polyurethane Market Volume K Tons Forecast, by Country 2019 & 2032
- Table 91: Germany PU Sole Footwear Polyurethane Market Revenue (Million) Forecast, by Application 2019 & 2032
- Table 92: Germany PU Sole Footwear Polyurethane Market Volume (K Tons) Forecast, by Application 2019 & 2032
- Table 93: United Kingdom PU Sole Footwear Polyurethane Market Revenue (Million) Forecast, by Application 2019 & 2032
- Table 94: United Kingdom PU Sole Footwear Polyurethane Market Volume (K Tons) Forecast, by Application 2019 & 2032
- Table 95: France PU Sole Footwear Polyurethane Market Revenue (Million) Forecast, by Application 2019 & 2032
- Table 96: France PU Sole Footwear Polyurethane Market Volume (K Tons) Forecast, by Application 2019 & 2032
- Table 97: Italy PU Sole Footwear Polyurethane Market Revenue (Million) Forecast, by Application 2019 & 2032
- Table 98: Italy PU Sole Footwear Polyurethane Market Volume (K Tons) Forecast, by Application 2019 & 2032
- Table 99: Rest of Europe PU Sole Footwear Polyurethane Market Revenue (Million) Forecast, by Application 2019 & 2032
- Table 100: Rest of Europe PU Sole Footwear Polyurethane Market Volume (K Tons) Forecast, by Application 2019 & 2032
- Table 101: Global PU Sole Footwear Polyurethane Market Revenue Million Forecast, by Material 2019 & 2032
- Table 102: Global PU Sole Footwear Polyurethane Market Volume K Tons Forecast, by Material 2019 & 2032
- Table 103: Global PU Sole Footwear Polyurethane Market Revenue Million Forecast, by Application 2019 & 2032
- Table 104: Global PU Sole Footwear Polyurethane Market Volume K Tons Forecast, by Application 2019 & 2032
- Table 105: Global PU Sole Footwear Polyurethane Market Revenue Million Forecast, by Country 2019 & 2032
- Table 106: Global PU Sole Footwear Polyurethane Market Volume K Tons Forecast, by Country 2019 & 2032
- Table 107: Brazil PU Sole Footwear Polyurethane Market Revenue (Million) Forecast, by Application 2019 & 2032
- Table 108: Brazil PU Sole Footwear Polyurethane Market Volume (K Tons) Forecast, by Application 2019 & 2032
- Table 109: Argentina PU Sole Footwear Polyurethane Market Revenue (Million) Forecast, by Application 2019 & 2032
- Table 110: Argentina PU Sole Footwear Polyurethane Market Volume (K Tons) Forecast, by Application 2019 & 2032
- Table 111: Rest of South America PU Sole Footwear Polyurethane Market Revenue (Million) Forecast, by Application 2019 & 2032
- Table 112: Rest of South America PU Sole Footwear Polyurethane Market Volume (K Tons) Forecast, by Application 2019 & 2032
- Table 113: Global PU Sole Footwear Polyurethane Market Revenue Million Forecast, by Material 2019 & 2032
- Table 114: Global PU Sole Footwear Polyurethane Market Volume K Tons Forecast, by Material 2019 & 2032
- Table 115: Global PU Sole Footwear Polyurethane Market Revenue Million Forecast, by Application 2019 & 2032
- Table 116: Global PU Sole Footwear Polyurethane Market Volume K Tons Forecast, by Application 2019 & 2032
- Table 117: Global PU Sole Footwear Polyurethane Market Revenue Million Forecast, by Country 2019 & 2032
- Table 118: Global PU Sole Footwear Polyurethane Market Volume K Tons Forecast, by Country 2019 & 2032
- Table 119: Saudi Arabia PU Sole Footwear Polyurethane Market Revenue (Million) Forecast, by Application 2019 & 2032
- Table 120: Saudi Arabia PU Sole Footwear Polyurethane Market Volume (K Tons) Forecast, by Application 2019 & 2032
- Table 121: South Africa PU Sole Footwear Polyurethane Market Revenue (Million) Forecast, by Application 2019 & 2032
- Table 122: South Africa PU Sole Footwear Polyurethane Market Volume (K Tons) Forecast, by Application 2019 & 2032
- Table 123: Rest of Middle East and Africa PU Sole Footwear Polyurethane Market Revenue (Million) Forecast, by Application 2019 & 2032
- Table 124: Rest of Middle East and Africa PU Sole Footwear Polyurethane Market Volume (K Tons) Forecast, by Application 2019 & 2032
Frequently Asked Questions
1. What is the projected Compound Annual Growth Rate (CAGR) of the PU Sole Footwear Polyurethane Market?
The projected CAGR is approximately > 5.00%.
2. Which companies are prominent players in the PU Sole Footwear Polyurethane Market?
Key companies in the market include Manali Petrochemicals Limited, Asahi Kasei Corporation, Trelleborg AB, Wanhua, INOAC CORPORATION, Rogers Corporation, LANXESS, BASF SE, Huntsman International LLC, Dow, The Lubrizol Corporation, Covestro AG, Kasodur, Era Polymers Pty Ltd, Coim Group.
3. What are the main segments of the PU Sole Footwear Polyurethane Market?
The market segments include Material, Application.
4. Can you provide details about the market size?
The market size is estimated to be USD XX Million as of 2022.
5. What are some drivers contributing to market growth?
The Growth in the Production and Sales of Footwear; Superior Properties of Polyurethane as Shoes Sole Material; The rising demand for Athletic Footwear.
6. What are the notable trends driving market growth?
The Rise in Athletic Footwear Production and Consumption.
7. Are there any restraints impacting market growth?
High Cost of Polyurethane Soles used in Footwear applications; Increasing Environmental Concerns.
8. Can you provide examples of recent developments in the market?
In Dec 2022, BASF and Australia's leading footwear provider Berkat Safety announced the launch of KAMU safety boots. Made with BASF's Thermoplastic Polyurethane (TPU) and Expanded Thermoplastic Polyurethane (E-TPU) materials, the safety boots provide long-term comfort, energy return, lightweight cushioning, and superior slip resistance.
9. What pricing options are available for accessing the report?
Pricing options include single-user, multi-user, and enterprise licenses priced at USD 4750, USD 5250, and USD 8750 respectively.
10. Is the market size provided in terms of value or volume?
The market size is provided in terms of value, measured in Million and volume, measured in K Tons.
11. Are there any specific market keywords associated with the report?
Yes, the market keyword associated with the report is "PU Sole Footwear Polyurethane Market," which aids in identifying and referencing the specific market segment covered.
12. How do I determine which pricing option suits my needs best?
The pricing options vary based on user requirements and access needs. Individual users may opt for single-user licenses, while businesses requiring broader access may choose multi-user or enterprise licenses for cost-effective access to the report.
13. Are there any additional resources or data provided in the PU Sole Footwear Polyurethane Market report?
While the report offers comprehensive insights, it's advisable to review the specific contents or supplementary materials provided to ascertain if additional resources or data are available.
14. How can I stay updated on further developments or reports in the PU Sole Footwear Polyurethane Market?
To stay informed about further developments, trends, and reports in the PU Sole Footwear Polyurethane Market, consider subscribing to industry newsletters, following relevant companies and organizations, or regularly checking reputable industry news sources and publications.
Methodology
Step 1 - Identification of Relevant Samples Size from Population Database


Step 2 - Approaches for Defining Global Market Size (Value, Volume* & Price*)

Note*: In applicable scenarios
Step 3 - Data Sources
Primary Research
- Web Analytics
- Survey Reports
- Research Institute
- Latest Research Reports
- Opinion Leaders
Secondary Research
- Annual Reports
- White Paper
- Latest Press Release
- Industry Association
- Paid Database
- Investor Presentations

Step 4 - Data Triangulation
Involves using different sources of information in order to increase the validity of a study
These sources are likely to be stakeholders in a program - participants, other researchers, program staff, other community members, and so on.
Then we put all data in single framework & apply various statistical tools to find out the dynamic on the market.
During the analysis stage, feedback from the stakeholder groups would be compared to determine areas of agreement as well as areas of divergence


