
Key Insights
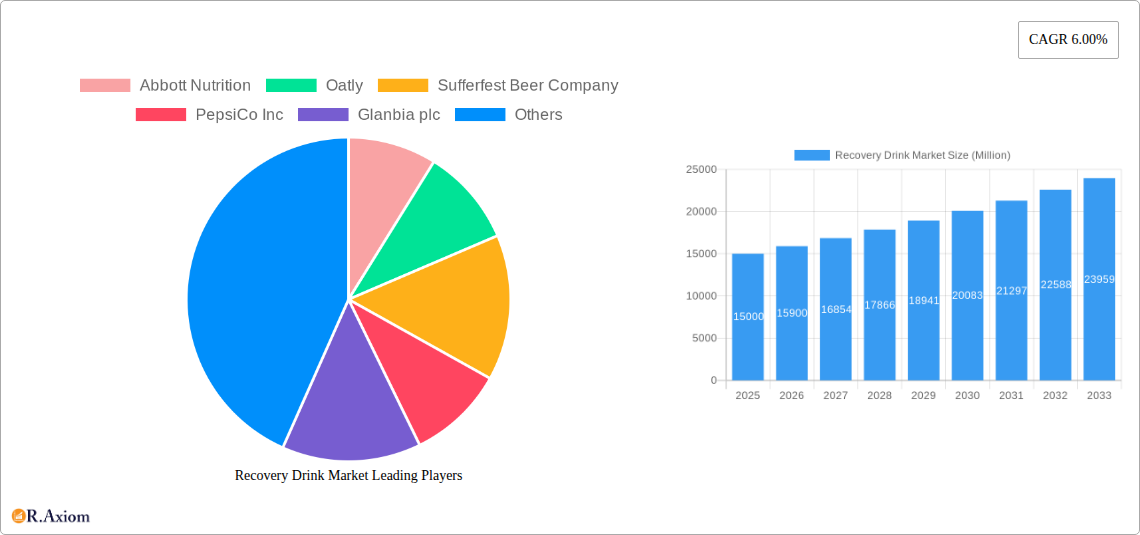
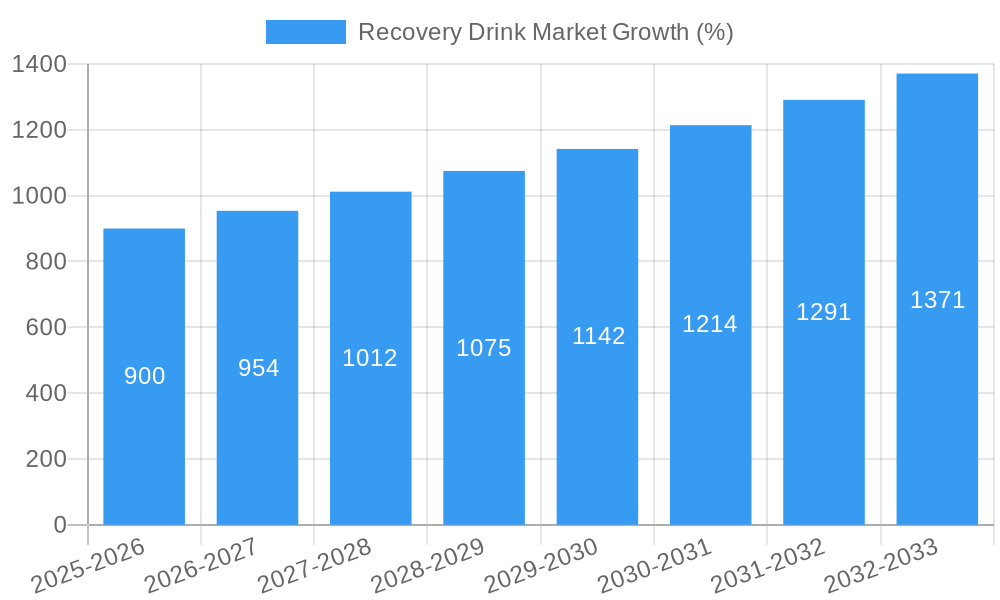
The global recovery drink market is experiencing robust growth, projected to reach a substantial size and maintain a Compound Annual Growth Rate (CAGR) of 6.00% from 2025 to 2033. This expansion is driven by several key factors. The rising popularity of fitness and athletic activities, coupled with increased awareness of the importance of post-workout recovery, fuels demand for these specialized beverages. Consumers are increasingly seeking convenient and effective methods to replenish electrolytes, carbohydrates, and other essential nutrients lost during physical exertion. The market is segmented by type (RTD, Powder), category (isotonic, hypotonic, hypertonic), and distribution channel (supermarkets, sports nutrition chains, online retail). The RTD segment currently dominates, owing to its convenience, but the powder segment shows promising growth potential, driven by cost-effectiveness and versatility. Isotonic drinks, designed to match the body's hydration levels, hold a significant market share, while hypotonic and hypertonic options cater to specific needs. Online retail is witnessing rapid growth, reflecting the broader e-commerce trend and the convenience it offers to consumers. Major players like Abbott Nutrition, PepsiCo, and Glanbia are driving innovation and expanding their product portfolios to cater to diverse consumer preferences and health goals. Geographic expansion into developing economies, with burgeoning middle classes adopting healthier lifestyles, further contributes to market growth. However, potential market restraints include increasing consumer awareness of added sugars and artificial ingredients in some recovery drinks, leading to a growing preference for natural and organic alternatives.
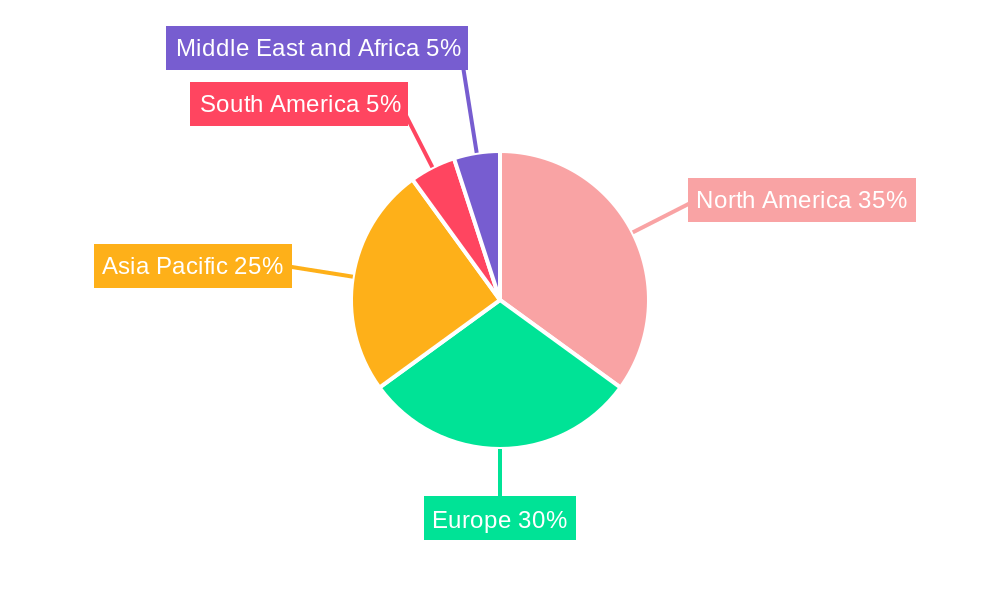
The competitive landscape is characterized by a mix of established multinational corporations and emerging niche players. The market is likely to witness increased product diversification, focusing on functional ingredients, such as protein, creatine, and antioxidants, to enhance recovery benefits. Furthermore, sustainable packaging and environmentally conscious production methods will likely gain importance in response to growing consumer demand for ethical and eco-friendly products. Strategic partnerships and acquisitions are also expected as companies aim to strengthen their market position and expand their product offerings. Regional variations exist, with North America and Europe currently representing the largest markets due to high fitness participation rates and strong consumer spending power. However, significant growth potential exists in rapidly developing Asian and Latin American markets.
Recovery Drink Market: A Comprehensive Report (2019-2033)
This comprehensive report provides a detailed analysis of the global Recovery Drink market, offering invaluable insights for industry stakeholders, investors, and strategic decision-makers. The report covers the period from 2019 to 2033, with 2025 serving as the base year and estimated year. The forecast period spans from 2025 to 2033, while the historical period encompasses 2019-2024. The market is segmented by type (RTD, Powder), category (Isotonic, Hypotonic, Hypertonic), and distribution channel (Supermarkets/Hypermarkets, Sports Nutrition chain, Convenience Stores, Online Retail Stores, Other Distribution Channels). Key players analyzed include Abbott Nutrition, Oatly, Sufferfest Beer Company, PepsiCo Inc, Glanbia plc, Fluid Sports Nutrition, Mountain Fuel, and Rockstar Inc. The report's total market value in 2025 is estimated at xx Million.
Recovery Drink Market Concentration & Innovation
The Recovery Drink market exhibits a moderately concentrated landscape, with a few major players holding significant market share. Abbott Nutrition and PepsiCo Inc. are currently estimated to hold the largest shares, combined accounting for approximately xx% of the total market in 2025. However, the market is witnessing increasing competition from smaller, specialized brands focusing on niche segments like organic and plant-based recovery drinks. Innovation is a key driver, with ongoing R&D focused on enhancing product functionality, taste, and convenience. This includes the development of novel formulations incorporating advanced ingredients such as protein blends, electrolytes, and adaptogens. Regulatory frameworks, while generally supportive of product innovation, vary across regions, potentially impacting product launches and market entry strategies. The market experiences some substitutability with other functional beverages like sports drinks and energy drinks, though recovery drinks are differentiated by their specific focus on post-exercise replenishment. M&A activity is moderate, with larger companies acquiring smaller, innovative players to expand their product portfolio and enhance market reach. For example, in 2023, the M&A deal value in this segment was estimated around xx Million.
- Market Concentration: High concentration at the top, with increasing competition from smaller players.
- Innovation Drivers: Improved formulations, enhanced taste and convenience, new ingredients.
- Regulatory Frameworks: Vary across regions, impacting product launches.
- Product Substitutes: Sports drinks, energy drinks.
- End-User Trends: Growing awareness of health and wellness, increasing participation in fitness activities.
- M&A Activities: Moderate activity, with larger players acquiring smaller companies.
Recovery Drink Market Industry Trends & Insights
The global Recovery Drink market is experiencing robust growth, driven by several key factors. The rising prevalence of health consciousness and increased participation in fitness activities are fueling demand for functional beverages designed to aid muscle recovery and improve athletic performance. The market is witnessing technological advancements such as improved formulation techniques and innovative packaging solutions, leading to enhanced product quality and shelf life. Consumer preferences are shifting towards natural, organic, and plant-based recovery options, creating opportunities for brands offering such products. The competitive landscape is dynamic, with established players and emerging companies vying for market share through product innovation, strategic partnerships, and aggressive marketing campaigns. The Compound Annual Growth Rate (CAGR) from 2025 to 2033 is projected to be xx%, indicating substantial market expansion. Market penetration in developed regions is relatively high, while emerging economies present significant growth potential. This expansion is partly attributed to rising disposable incomes, growing awareness about health benefits, and increasing urbanization.
Dominant Markets & Segments in Recovery Drink Market
The North American market currently dominates the global Recovery Drink market, driven by high consumer awareness, strong fitness culture, and high disposable incomes. Within North America, the United States is the largest consumer, attributed to its large population and high sports participation rates.
Key Drivers:
- High Consumer Awareness: Educated consumers prioritizing health and wellness.
- Strong Fitness Culture: Widespread participation in fitness and sports activities.
- High Disposable Incomes: Enabling consumers to purchase premium health products.
- Developed Retail Infrastructure: Well-established distribution networks.
Segment Dominance:
- By Type: RTD drinks currently hold a larger market share compared to powder owing to convenience.
- By Category: Isotonic recovery drinks lead the market due to their balanced electrolyte composition and widespread acceptance.
- By Distribution Channel: Supermarkets/Hypermarkets hold the largest distribution channel share.
Recovery Drink Market Product Developments
Recent product innovations in the recovery drink market emphasize natural ingredients, enhanced taste profiles, and convenient formats. Companies are introducing products with unique blends of proteins, carbohydrates, and electrolytes, designed to optimize recovery time and improve athletic performance. There is a notable trend toward plant-based and organic options, responding to growing consumer demand for healthier and more sustainable products. Functional benefits are highlighted, such as faster muscle repair, improved hydration, and reduced inflammation. This focus on customized formulations positions recovery drinks as advanced nutritional support for a broad range of fitness enthusiasts.
Report Scope & Segmentation Analysis
This report provides a comprehensive analysis of the Recovery Drink market, segmented by type (RTD and Powder), category (Isotonic, Hypotonic, and Hypertonic), and distribution channel (Supermarkets/Hypermarkets, Sports Nutrition chains, Convenience Stores, Online Retail Stores, and Other Distribution Channels). Each segment’s growth projections, market size, and competitive dynamics are detailed, providing a granular understanding of market dynamics.
- By Type: The RTD segment is expected to experience faster growth than the powder segment due to convenience.
- By Category: Isotonic drinks are projected to dominate, with hypotonics and hypertonics catering to specific needs.
- By Distribution Channel: Online retail is expected to witness significant growth driven by expanding e-commerce and rising online shopping.
Key Drivers of Recovery Drink Market Growth
The recovery drink market's growth is fueled by several key factors. The rising popularity of fitness activities and increased health consciousness are major drivers. Advances in formulation technologies leading to improved product quality and consumer demand for natural and organic ingredients also contribute significantly. Government regulations promoting healthy lifestyle choices indirectly support market expansion.
Challenges in the Recovery Drink Market Sector
Challenges include intense competition, fluctuations in raw material prices, and stringent regulatory requirements in different regions which may result in xx Million loss in 2026. Supply chain disruptions can also impact production and distribution. Maintaining brand differentiation in a crowded market remains a challenge.
Emerging Opportunities in Recovery Drink Market
Emerging opportunities lie in untapped markets, especially in developing economies, and the development of innovative products tailored to specific consumer segments and fitness activities. Personalized nutrition through customized recovery drink formulations represents a promising avenue for growth. The rising popularity of functional beverages presents additional opportunities for market expansion.
Leading Players in the Recovery Drink Market Market
- Abbott Nutrition
- Oatly
- Sufferfest Beer Company
- PepsiCo Inc
- Glanbia plc
- Fluid Sports Nutrition
- Mountain Fuel
- Rockstar Inc
Key Developments in Recovery Drink Market Industry
- Jan 2023: PepsiCo launched a new line of plant-based recovery drinks.
- Apr 2022: Abbott Nutrition acquired a smaller competitor to expand its product portfolio.
- Oct 2021: A new regulatory framework impacting ingredient labeling was implemented in the EU.
Strategic Outlook for Recovery Drink Market Market
The recovery drink market is poised for continued growth, driven by sustained interest in health and wellness, increased participation in fitness, and ongoing product innovation. Emerging markets and technological advancements will create new opportunities, particularly for companies focusing on natural, organic, and personalized nutrition. The market's future appears promising, with strong potential for expansion across various segments and geographic regions.
Recovery Drink Market Segmentation
-
1. Type
- 1.1. RTD
- 1.2. Powder
-
2. Category
- 2.1. Isotonic
- 2.2. Hypotonic
- 2.3. Hypertonic
-
3. Distribution Channel
- 3.1. Supermarkets/Hypermarkets
- 3.2. Sports Nutrition chain
- 3.3. Convenience Stores
- 3.4. Online Retail Stores
- 3.5. Other Distribution Channels
Recovery Drink Market Segmentation By Geography
-
1. North America
- 1.1. United States
- 1.2. Canada
- 1.3. Mexico
- 1.4. Rest of North America
-
2. Europe
- 2.1. Spain
- 2.2. United Kingdom
- 2.3. Germany
- 2.4. France
- 2.5. Italy
- 2.6. Russia
- 2.7. Rest of Europe
-
3. Asia Pacific
- 3.1. China
- 3.2. Japan
- 3.3. India
- 3.4. Australia
- 3.5. Rest of Asia Pacific
-
4. South America
- 4.1. Brazil
- 4.2. Argentina
- 4.3. Rest of South America
-
5. Middle East and Africa
- 5.1. South Africa
- 5.2. United Arab Emirates
- 5.3. Rest of Middle East and Africa
Recovery Drink Market REPORT HIGHLIGHTS
| Aspects | Details |
|---|---|
| Study Period | 2019-2033 |
| Base Year | 2024 |
| Estimated Year | 2025 |
| Forecast Period | 2025-2033 |
| Historical Period | 2019-2024 |
| Growth Rate | CAGR of 6.00% from 2019-2033 |
| Segmentation |
|
Table of Contents
- 1. Introduction
- 1.1. Research Scope
- 1.2. Market Segmentation
- 1.3. Research Methodology
- 1.4. Definitions and Assumptions
- 2. Executive Summary
- 2.1. Introduction
- 3. Market Dynamics
- 3.1. Introduction
- 3.2. Market Drivers
- 3.2.1. Popularity of On-the-Go Snacking Options; Trend Of Clean Label and Plant-Based Bars
- 3.3. Market Restrains
- 3.3.1. Availability of Counterfeit Products
- 3.4. Market Trends
- 3.4.1. Increased demand of organic recovery drinks
- 4. Market Factor Analysis
- 4.1. Porters Five Forces
- 4.2. Supply/Value Chain
- 4.3. PESTEL analysis
- 4.4. Market Entropy
- 4.5. Patent/Trademark Analysis
- 5. Global Recovery Drink Market Analysis, Insights and Forecast, 2019-2031
- 5.1. Market Analysis, Insights and Forecast - by Type
- 5.1.1. RTD
- 5.1.2. Powder
- 5.2. Market Analysis, Insights and Forecast - by Category
- 5.2.1. Isotonic
- 5.2.2. Hypotonic
- 5.2.3. Hypertonic
- 5.3. Market Analysis, Insights and Forecast - by Distribution Channel
- 5.3.1. Supermarkets/Hypermarkets
- 5.3.2. Sports Nutrition chain
- 5.3.3. Convenience Stores
- 5.3.4. Online Retail Stores
- 5.3.5. Other Distribution Channels
- 5.4. Market Analysis, Insights and Forecast - by Region
- 5.4.1. North America
- 5.4.2. Europe
- 5.4.3. Asia Pacific
- 5.4.4. South America
- 5.4.5. Middle East and Africa
- 5.1. Market Analysis, Insights and Forecast - by Type
- 6. North America Recovery Drink Market Analysis, Insights and Forecast, 2019-2031
- 6.1. Market Analysis, Insights and Forecast - by Type
- 6.1.1. RTD
- 6.1.2. Powder
- 6.2. Market Analysis, Insights and Forecast - by Category
- 6.2.1. Isotonic
- 6.2.2. Hypotonic
- 6.2.3. Hypertonic
- 6.3. Market Analysis, Insights and Forecast - by Distribution Channel
- 6.3.1. Supermarkets/Hypermarkets
- 6.3.2. Sports Nutrition chain
- 6.3.3. Convenience Stores
- 6.3.4. Online Retail Stores
- 6.3.5. Other Distribution Channels
- 6.1. Market Analysis, Insights and Forecast - by Type
- 7. Europe Recovery Drink Market Analysis, Insights and Forecast, 2019-2031
- 7.1. Market Analysis, Insights and Forecast - by Type
- 7.1.1. RTD
- 7.1.2. Powder
- 7.2. Market Analysis, Insights and Forecast - by Category
- 7.2.1. Isotonic
- 7.2.2. Hypotonic
- 7.2.3. Hypertonic
- 7.3. Market Analysis, Insights and Forecast - by Distribution Channel
- 7.3.1. Supermarkets/Hypermarkets
- 7.3.2. Sports Nutrition chain
- 7.3.3. Convenience Stores
- 7.3.4. Online Retail Stores
- 7.3.5. Other Distribution Channels
- 7.1. Market Analysis, Insights and Forecast - by Type
- 8. Asia Pacific Recovery Drink Market Analysis, Insights and Forecast, 2019-2031
- 8.1. Market Analysis, Insights and Forecast - by Type
- 8.1.1. RTD
- 8.1.2. Powder
- 8.2. Market Analysis, Insights and Forecast - by Category
- 8.2.1. Isotonic
- 8.2.2. Hypotonic
- 8.2.3. Hypertonic
- 8.3. Market Analysis, Insights and Forecast - by Distribution Channel
- 8.3.1. Supermarkets/Hypermarkets
- 8.3.2. Sports Nutrition chain
- 8.3.3. Convenience Stores
- 8.3.4. Online Retail Stores
- 8.3.5. Other Distribution Channels
- 8.1. Market Analysis, Insights and Forecast - by Type
- 9. South America Recovery Drink Market Analysis, Insights and Forecast, 2019-2031
- 9.1. Market Analysis, Insights and Forecast - by Type
- 9.1.1. RTD
- 9.1.2. Powder
- 9.2. Market Analysis, Insights and Forecast - by Category
- 9.2.1. Isotonic
- 9.2.2. Hypotonic
- 9.2.3. Hypertonic
- 9.3. Market Analysis, Insights and Forecast - by Distribution Channel
- 9.3.1. Supermarkets/Hypermarkets
- 9.3.2. Sports Nutrition chain
- 9.3.3. Convenience Stores
- 9.3.4. Online Retail Stores
- 9.3.5. Other Distribution Channels
- 9.1. Market Analysis, Insights and Forecast - by Type
- 10. Middle East and Africa Recovery Drink Market Analysis, Insights and Forecast, 2019-2031
- 10.1. Market Analysis, Insights and Forecast - by Type
- 10.1.1. RTD
- 10.1.2. Powder
- 10.2. Market Analysis, Insights and Forecast - by Category
- 10.2.1. Isotonic
- 10.2.2. Hypotonic
- 10.2.3. Hypertonic
- 10.3. Market Analysis, Insights and Forecast - by Distribution Channel
- 10.3.1. Supermarkets/Hypermarkets
- 10.3.2. Sports Nutrition chain
- 10.3.3. Convenience Stores
- 10.3.4. Online Retail Stores
- 10.3.5. Other Distribution Channels
- 10.1. Market Analysis, Insights and Forecast - by Type
- 11. North America Recovery Drink Market Analysis, Insights and Forecast, 2019-2031
- 11.1. Market Analysis, Insights and Forecast - By Country/Sub-region
- 11.1.1 United States
- 11.1.2 Canada
- 11.1.3 Mexico
- 11.1.4 Rest of North America
- 12. Europe Recovery Drink Market Analysis, Insights and Forecast, 2019-2031
- 12.1. Market Analysis, Insights and Forecast - By Country/Sub-region
- 12.1.1 Spain
- 12.1.2 United Kingdom
- 12.1.3 Germany
- 12.1.4 France
- 12.1.5 Italy
- 12.1.6 Russia
- 12.1.7 Rest of Europe
- 13. Asia Pacific Recovery Drink Market Analysis, Insights and Forecast, 2019-2031
- 13.1. Market Analysis, Insights and Forecast - By Country/Sub-region
- 13.1.1 China
- 13.1.2 Japan
- 13.1.3 India
- 13.1.4 Australia
- 13.1.5 Rest of Asia Pacific
- 14. South America Recovery Drink Market Analysis, Insights and Forecast, 2019-2031
- 14.1. Market Analysis, Insights and Forecast - By Country/Sub-region
- 14.1.1 Brazil
- 14.1.2 Argentina
- 14.1.3 Rest of South America
- 15. Middle East and Africa Recovery Drink Market Analysis, Insights and Forecast, 2019-2031
- 15.1. Market Analysis, Insights and Forecast - By Country/Sub-region
- 15.1.1 South Africa
- 15.1.2 United Arab Emirates
- 15.1.3 Rest of Middle East and Africa
- 16. Competitive Analysis
- 16.1. Global Market Share Analysis 2024
- 16.2. Company Profiles
- 16.2.1 Abbott Nutrition
- 16.2.1.1. Overview
- 16.2.1.2. Products
- 16.2.1.3. SWOT Analysis
- 16.2.1.4. Recent Developments
- 16.2.1.5. Financials (Based on Availability)
- 16.2.2 Oatly
- 16.2.2.1. Overview
- 16.2.2.2. Products
- 16.2.2.3. SWOT Analysis
- 16.2.2.4. Recent Developments
- 16.2.2.5. Financials (Based on Availability)
- 16.2.3 Sufferfest Beer Company
- 16.2.3.1. Overview
- 16.2.3.2. Products
- 16.2.3.3. SWOT Analysis
- 16.2.3.4. Recent Developments
- 16.2.3.5. Financials (Based on Availability)
- 16.2.4 PepsiCo Inc
- 16.2.4.1. Overview
- 16.2.4.2. Products
- 16.2.4.3. SWOT Analysis
- 16.2.4.4. Recent Developments
- 16.2.4.5. Financials (Based on Availability)
- 16.2.5 Glanbia plc
- 16.2.5.1. Overview
- 16.2.5.2. Products
- 16.2.5.3. SWOT Analysis
- 16.2.5.4. Recent Developments
- 16.2.5.5. Financials (Based on Availability)
- 16.2.6 Fluid Sports Nutrition*List Not Exhaustive
- 16.2.6.1. Overview
- 16.2.6.2. Products
- 16.2.6.3. SWOT Analysis
- 16.2.6.4. Recent Developments
- 16.2.6.5. Financials (Based on Availability)
- 16.2.7 Mountain Fuel
- 16.2.7.1. Overview
- 16.2.7.2. Products
- 16.2.7.3. SWOT Analysis
- 16.2.7.4. Recent Developments
- 16.2.7.5. Financials (Based on Availability)
- 16.2.8 Rockstar Inc
- 16.2.8.1. Overview
- 16.2.8.2. Products
- 16.2.8.3. SWOT Analysis
- 16.2.8.4. Recent Developments
- 16.2.8.5. Financials (Based on Availability)
- 16.2.1 Abbott Nutrition
List of Figures
- Figure 1: Global Recovery Drink Market Revenue Breakdown (Million, %) by Region 2024 & 2032
- Figure 2: North America Recovery Drink Market Revenue (Million), by Country 2024 & 2032
- Figure 3: North America Recovery Drink Market Revenue Share (%), by Country 2024 & 2032
- Figure 4: Europe Recovery Drink Market Revenue (Million), by Country 2024 & 2032
- Figure 5: Europe Recovery Drink Market Revenue Share (%), by Country 2024 & 2032
- Figure 6: Asia Pacific Recovery Drink Market Revenue (Million), by Country 2024 & 2032
- Figure 7: Asia Pacific Recovery Drink Market Revenue Share (%), by Country 2024 & 2032
- Figure 8: South America Recovery Drink Market Revenue (Million), by Country 2024 & 2032
- Figure 9: South America Recovery Drink Market Revenue Share (%), by Country 2024 & 2032
- Figure 10: Middle East and Africa Recovery Drink Market Revenue (Million), by Country 2024 & 2032
- Figure 11: Middle East and Africa Recovery Drink Market Revenue Share (%), by Country 2024 & 2032
- Figure 12: North America Recovery Drink Market Revenue (Million), by Type 2024 & 2032
- Figure 13: North America Recovery Drink Market Revenue Share (%), by Type 2024 & 2032
- Figure 14: North America Recovery Drink Market Revenue (Million), by Category 2024 & 2032
- Figure 15: North America Recovery Drink Market Revenue Share (%), by Category 2024 & 2032
- Figure 16: North America Recovery Drink Market Revenue (Million), by Distribution Channel 2024 & 2032
- Figure 17: North America Recovery Drink Market Revenue Share (%), by Distribution Channel 2024 & 2032
- Figure 18: North America Recovery Drink Market Revenue (Million), by Country 2024 & 2032
- Figure 19: North America Recovery Drink Market Revenue Share (%), by Country 2024 & 2032
- Figure 20: Europe Recovery Drink Market Revenue (Million), by Type 2024 & 2032
- Figure 21: Europe Recovery Drink Market Revenue Share (%), by Type 2024 & 2032
- Figure 22: Europe Recovery Drink Market Revenue (Million), by Category 2024 & 2032
- Figure 23: Europe Recovery Drink Market Revenue Share (%), by Category 2024 & 2032
- Figure 24: Europe Recovery Drink Market Revenue (Million), by Distribution Channel 2024 & 2032
- Figure 25: Europe Recovery Drink Market Revenue Share (%), by Distribution Channel 2024 & 2032
- Figure 26: Europe Recovery Drink Market Revenue (Million), by Country 2024 & 2032
- Figure 27: Europe Recovery Drink Market Revenue Share (%), by Country 2024 & 2032
- Figure 28: Asia Pacific Recovery Drink Market Revenue (Million), by Type 2024 & 2032
- Figure 29: Asia Pacific Recovery Drink Market Revenue Share (%), by Type 2024 & 2032
- Figure 30: Asia Pacific Recovery Drink Market Revenue (Million), by Category 2024 & 2032
- Figure 31: Asia Pacific Recovery Drink Market Revenue Share (%), by Category 2024 & 2032
- Figure 32: Asia Pacific Recovery Drink Market Revenue (Million), by Distribution Channel 2024 & 2032
- Figure 33: Asia Pacific Recovery Drink Market Revenue Share (%), by Distribution Channel 2024 & 2032
- Figure 34: Asia Pacific Recovery Drink Market Revenue (Million), by Country 2024 & 2032
- Figure 35: Asia Pacific Recovery Drink Market Revenue Share (%), by Country 2024 & 2032
- Figure 36: South America Recovery Drink Market Revenue (Million), by Type 2024 & 2032
- Figure 37: South America Recovery Drink Market Revenue Share (%), by Type 2024 & 2032
- Figure 38: South America Recovery Drink Market Revenue (Million), by Category 2024 & 2032
- Figure 39: South America Recovery Drink Market Revenue Share (%), by Category 2024 & 2032
- Figure 40: South America Recovery Drink Market Revenue (Million), by Distribution Channel 2024 & 2032
- Figure 41: South America Recovery Drink Market Revenue Share (%), by Distribution Channel 2024 & 2032
- Figure 42: South America Recovery Drink Market Revenue (Million), by Country 2024 & 2032
- Figure 43: South America Recovery Drink Market Revenue Share (%), by Country 2024 & 2032
- Figure 44: Middle East and Africa Recovery Drink Market Revenue (Million), by Type 2024 & 2032
- Figure 45: Middle East and Africa Recovery Drink Market Revenue Share (%), by Type 2024 & 2032
- Figure 46: Middle East and Africa Recovery Drink Market Revenue (Million), by Category 2024 & 2032
- Figure 47: Middle East and Africa Recovery Drink Market Revenue Share (%), by Category 2024 & 2032
- Figure 48: Middle East and Africa Recovery Drink Market Revenue (Million), by Distribution Channel 2024 & 2032
- Figure 49: Middle East and Africa Recovery Drink Market Revenue Share (%), by Distribution Channel 2024 & 2032
- Figure 50: Middle East and Africa Recovery Drink Market Revenue (Million), by Country 2024 & 2032
- Figure 51: Middle East and Africa Recovery Drink Market Revenue Share (%), by Country 2024 & 2032
List of Tables
- Table 1: Global Recovery Drink Market Revenue Million Forecast, by Region 2019 & 2032
- Table 2: Global Recovery Drink Market Revenue Million Forecast, by Type 2019 & 2032
- Table 3: Global Recovery Drink Market Revenue Million Forecast, by Category 2019 & 2032
- Table 4: Global Recovery Drink Market Revenue Million Forecast, by Distribution Channel 2019 & 2032
- Table 5: Global Recovery Drink Market Revenue Million Forecast, by Region 2019 & 2032
- Table 6: Global Recovery Drink Market Revenue Million Forecast, by Country 2019 & 2032
- Table 7: United States Recovery Drink Market Revenue (Million) Forecast, by Application 2019 & 2032
- Table 8: Canada Recovery Drink Market Revenue (Million) Forecast, by Application 2019 & 2032
- Table 9: Mexico Recovery Drink Market Revenue (Million) Forecast, by Application 2019 & 2032
- Table 10: Rest of North America Recovery Drink Market Revenue (Million) Forecast, by Application 2019 & 2032
- Table 11: Global Recovery Drink Market Revenue Million Forecast, by Country 2019 & 2032
- Table 12: Spain Recovery Drink Market Revenue (Million) Forecast, by Application 2019 & 2032
- Table 13: United Kingdom Recovery Drink Market Revenue (Million) Forecast, by Application 2019 & 2032
- Table 14: Germany Recovery Drink Market Revenue (Million) Forecast, by Application 2019 & 2032
- Table 15: France Recovery Drink Market Revenue (Million) Forecast, by Application 2019 & 2032
- Table 16: Italy Recovery Drink Market Revenue (Million) Forecast, by Application 2019 & 2032
- Table 17: Russia Recovery Drink Market Revenue (Million) Forecast, by Application 2019 & 2032
- Table 18: Rest of Europe Recovery Drink Market Revenue (Million) Forecast, by Application 2019 & 2032
- Table 19: Global Recovery Drink Market Revenue Million Forecast, by Country 2019 & 2032
- Table 20: China Recovery Drink Market Revenue (Million) Forecast, by Application 2019 & 2032
- Table 21: Japan Recovery Drink Market Revenue (Million) Forecast, by Application 2019 & 2032
- Table 22: India Recovery Drink Market Revenue (Million) Forecast, by Application 2019 & 2032
- Table 23: Australia Recovery Drink Market Revenue (Million) Forecast, by Application 2019 & 2032
- Table 24: Rest of Asia Pacific Recovery Drink Market Revenue (Million) Forecast, by Application 2019 & 2032
- Table 25: Global Recovery Drink Market Revenue Million Forecast, by Country 2019 & 2032
- Table 26: Brazil Recovery Drink Market Revenue (Million) Forecast, by Application 2019 & 2032
- Table 27: Argentina Recovery Drink Market Revenue (Million) Forecast, by Application 2019 & 2032
- Table 28: Rest of South America Recovery Drink Market Revenue (Million) Forecast, by Application 2019 & 2032
- Table 29: Global Recovery Drink Market Revenue Million Forecast, by Country 2019 & 2032
- Table 30: South Africa Recovery Drink Market Revenue (Million) Forecast, by Application 2019 & 2032
- Table 31: United Arab Emirates Recovery Drink Market Revenue (Million) Forecast, by Application 2019 & 2032
- Table 32: Rest of Middle East and Africa Recovery Drink Market Revenue (Million) Forecast, by Application 2019 & 2032
- Table 33: Global Recovery Drink Market Revenue Million Forecast, by Type 2019 & 2032
- Table 34: Global Recovery Drink Market Revenue Million Forecast, by Category 2019 & 2032
- Table 35: Global Recovery Drink Market Revenue Million Forecast, by Distribution Channel 2019 & 2032
- Table 36: Global Recovery Drink Market Revenue Million Forecast, by Country 2019 & 2032
- Table 37: United States Recovery Drink Market Revenue (Million) Forecast, by Application 2019 & 2032
- Table 38: Canada Recovery Drink Market Revenue (Million) Forecast, by Application 2019 & 2032
- Table 39: Mexico Recovery Drink Market Revenue (Million) Forecast, by Application 2019 & 2032
- Table 40: Rest of North America Recovery Drink Market Revenue (Million) Forecast, by Application 2019 & 2032
- Table 41: Global Recovery Drink Market Revenue Million Forecast, by Type 2019 & 2032
- Table 42: Global Recovery Drink Market Revenue Million Forecast, by Category 2019 & 2032
- Table 43: Global Recovery Drink Market Revenue Million Forecast, by Distribution Channel 2019 & 2032
- Table 44: Global Recovery Drink Market Revenue Million Forecast, by Country 2019 & 2032
- Table 45: Spain Recovery Drink Market Revenue (Million) Forecast, by Application 2019 & 2032
- Table 46: United Kingdom Recovery Drink Market Revenue (Million) Forecast, by Application 2019 & 2032
- Table 47: Germany Recovery Drink Market Revenue (Million) Forecast, by Application 2019 & 2032
- Table 48: France Recovery Drink Market Revenue (Million) Forecast, by Application 2019 & 2032
- Table 49: Italy Recovery Drink Market Revenue (Million) Forecast, by Application 2019 & 2032
- Table 50: Russia Recovery Drink Market Revenue (Million) Forecast, by Application 2019 & 2032
- Table 51: Rest of Europe Recovery Drink Market Revenue (Million) Forecast, by Application 2019 & 2032
- Table 52: Global Recovery Drink Market Revenue Million Forecast, by Type 2019 & 2032
- Table 53: Global Recovery Drink Market Revenue Million Forecast, by Category 2019 & 2032
- Table 54: Global Recovery Drink Market Revenue Million Forecast, by Distribution Channel 2019 & 2032
- Table 55: Global Recovery Drink Market Revenue Million Forecast, by Country 2019 & 2032
- Table 56: China Recovery Drink Market Revenue (Million) Forecast, by Application 2019 & 2032
- Table 57: Japan Recovery Drink Market Revenue (Million) Forecast, by Application 2019 & 2032
- Table 58: India Recovery Drink Market Revenue (Million) Forecast, by Application 2019 & 2032
- Table 59: Australia Recovery Drink Market Revenue (Million) Forecast, by Application 2019 & 2032
- Table 60: Rest of Asia Pacific Recovery Drink Market Revenue (Million) Forecast, by Application 2019 & 2032
- Table 61: Global Recovery Drink Market Revenue Million Forecast, by Type 2019 & 2032
- Table 62: Global Recovery Drink Market Revenue Million Forecast, by Category 2019 & 2032
- Table 63: Global Recovery Drink Market Revenue Million Forecast, by Distribution Channel 2019 & 2032
- Table 64: Global Recovery Drink Market Revenue Million Forecast, by Country 2019 & 2032
- Table 65: Brazil Recovery Drink Market Revenue (Million) Forecast, by Application 2019 & 2032
- Table 66: Argentina Recovery Drink Market Revenue (Million) Forecast, by Application 2019 & 2032
- Table 67: Rest of South America Recovery Drink Market Revenue (Million) Forecast, by Application 2019 & 2032
- Table 68: Global Recovery Drink Market Revenue Million Forecast, by Type 2019 & 2032
- Table 69: Global Recovery Drink Market Revenue Million Forecast, by Category 2019 & 2032
- Table 70: Global Recovery Drink Market Revenue Million Forecast, by Distribution Channel 2019 & 2032
- Table 71: Global Recovery Drink Market Revenue Million Forecast, by Country 2019 & 2032
- Table 72: South Africa Recovery Drink Market Revenue (Million) Forecast, by Application 2019 & 2032
- Table 73: United Arab Emirates Recovery Drink Market Revenue (Million) Forecast, by Application 2019 & 2032
- Table 74: Rest of Middle East and Africa Recovery Drink Market Revenue (Million) Forecast, by Application 2019 & 2032
Frequently Asked Questions
1. What is the projected Compound Annual Growth Rate (CAGR) of the Recovery Drink Market?
The projected CAGR is approximately 6.00%.
2. Which companies are prominent players in the Recovery Drink Market?
Key companies in the market include Abbott Nutrition, Oatly, Sufferfest Beer Company, PepsiCo Inc, Glanbia plc, Fluid Sports Nutrition*List Not Exhaustive, Mountain Fuel, Rockstar Inc.
3. What are the main segments of the Recovery Drink Market?
The market segments include Type, Category, Distribution Channel.
4. Can you provide details about the market size?
The market size is estimated to be USD XX Million as of 2022.
5. What are some drivers contributing to market growth?
Popularity of On-the-Go Snacking Options; Trend Of Clean Label and Plant-Based Bars.
6. What are the notable trends driving market growth?
Increased demand of organic recovery drinks.
7. Are there any restraints impacting market growth?
Availability of Counterfeit Products.
8. Can you provide examples of recent developments in the market?
N/A
9. What pricing options are available for accessing the report?
Pricing options include single-user, multi-user, and enterprise licenses priced at USD 4750, USD 5250, and USD 8750 respectively.
10. Is the market size provided in terms of value or volume?
The market size is provided in terms of value, measured in Million.
11. Are there any specific market keywords associated with the report?
Yes, the market keyword associated with the report is "Recovery Drink Market," which aids in identifying and referencing the specific market segment covered.
12. How do I determine which pricing option suits my needs best?
The pricing options vary based on user requirements and access needs. Individual users may opt for single-user licenses, while businesses requiring broader access may choose multi-user or enterprise licenses for cost-effective access to the report.
13. Are there any additional resources or data provided in the Recovery Drink Market report?
While the report offers comprehensive insights, it's advisable to review the specific contents or supplementary materials provided to ascertain if additional resources or data are available.
14. How can I stay updated on further developments or reports in the Recovery Drink Market?
To stay informed about further developments, trends, and reports in the Recovery Drink Market, consider subscribing to industry newsletters, following relevant companies and organizations, or regularly checking reputable industry news sources and publications.
Methodology
Step 1 - Identification of Relevant Samples Size from Population Database


Step 2 - Approaches for Defining Global Market Size (Value, Volume* & Price*)

Note*: In applicable scenarios
Step 3 - Data Sources
Primary Research
- Web Analytics
- Survey Reports
- Research Institute
- Latest Research Reports
- Opinion Leaders
Secondary Research
- Annual Reports
- White Paper
- Latest Press Release
- Industry Association
- Paid Database
- Investor Presentations

Step 4 - Data Triangulation
Involves using different sources of information in order to increase the validity of a study
These sources are likely to be stakeholders in a program - participants, other researchers, program staff, other community members, and so on.
Then we put all data in single framework & apply various statistical tools to find out the dynamic on the market.
During the analysis stage, feedback from the stakeholder groups would be compared to determine areas of agreement as well as areas of divergence


