
Key Insights
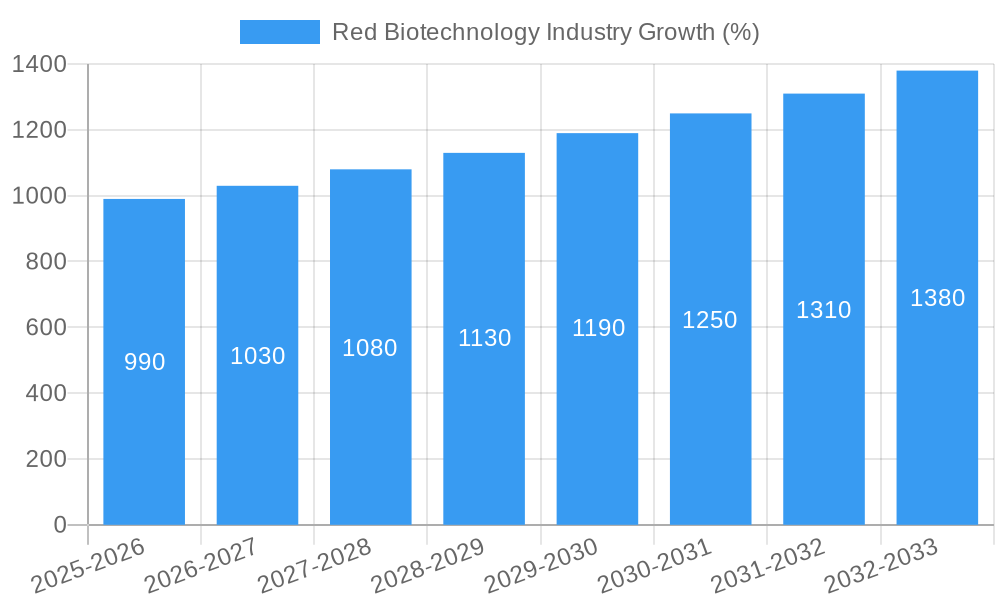
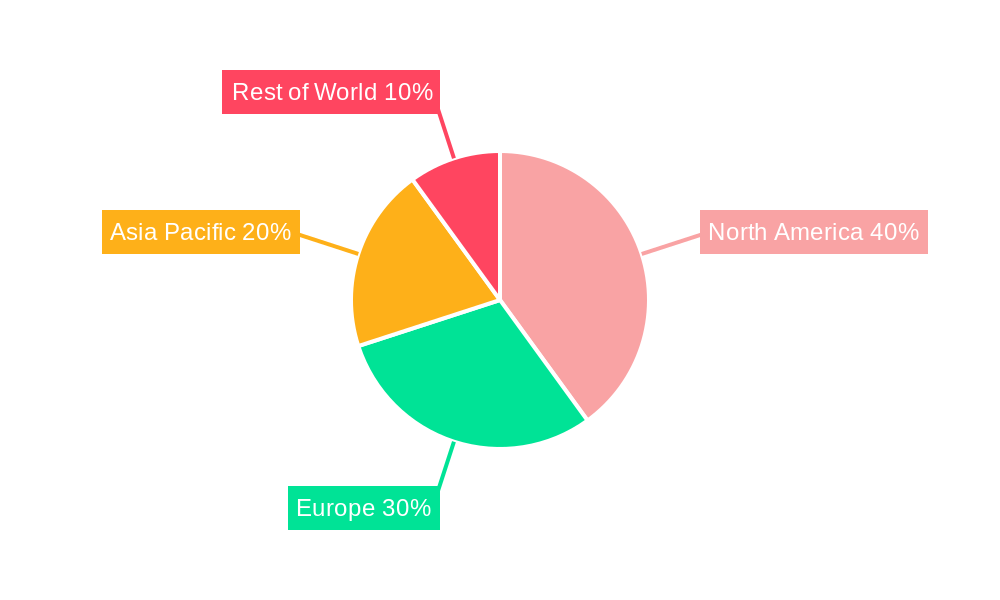
The red biotechnology market, encompassing the development and commercialization of biotherapeutics derived from blood and blood products, is experiencing robust growth, projected to maintain a 6.10% CAGR from 2025 to 2033. This expansion is fueled by several key drivers. Firstly, the increasing prevalence of chronic diseases like cancer, autoimmune disorders, and hemophilia necessitates innovative and effective biotherapies, driving demand. Secondly, advancements in biotechnology, particularly in areas like gene therapy and cell therapy, are expanding treatment options and market potential. Furthermore, rising investments in research and development by pharmaceutical companies and government agencies are accelerating the introduction of new red biotechnology products. While regulatory hurdles and high development costs pose challenges, the market's overall growth trajectory remains positive. The market segmentation reveals a significant portion dominated by vaccines and drugs, primarily utilized by biopharmaceutical companies and contract manufacturing/research organizations (CMOs/CROs). Major players like Amgen, Merck, Roche, AstraZeneca, and Pfizer are actively shaping the market landscape through innovation and strategic partnerships. Geographical analysis indicates strong market presence in North America and Europe, driven by advanced healthcare infrastructure and high disposable incomes. However, the Asia-Pacific region is showing significant growth potential due to increasing healthcare spending and rising prevalence of target diseases.
The market's future hinges on continued technological advancements, particularly in personalized medicine and targeted therapies. The successful development and approval of novel biotherapeutics targeting specific disease mechanisms will significantly impact market expansion. Furthermore, the efficient and cost-effective production of these biotherapeutics, alongside streamlined regulatory processes, will play a vital role in shaping the market's future trajectory. The competitive landscape is intense, with companies focusing on innovative product development, strategic acquisitions, and collaborations to gain market share. Ultimately, the red biotechnology market is poised for substantial growth, driven by unmet medical needs and continuous technological innovation. Successful navigation of regulatory challenges and cost management will be crucial for companies seeking long-term success in this dynamic market.
Red Biotechnology Industry: A Comprehensive Market Report (2019-2033)
This in-depth report provides a comprehensive analysis of the Red Biotechnology industry, covering market size, growth drivers, challenges, and future opportunities from 2019 to 2033. With a focus on key players like Amgen, Merck, Roche, and AstraZeneca, this report offers actionable insights for industry stakeholders, investors, and researchers. The study period spans 2019-2033, with 2025 as the base and estimated year. The forecast period is 2025-2033, and the historical period covers 2019-2024. The report projects a market size of xx Million by 2033, exhibiting a CAGR of xx% during the forecast period.
Red Biotechnology Industry Market Concentration & Innovation
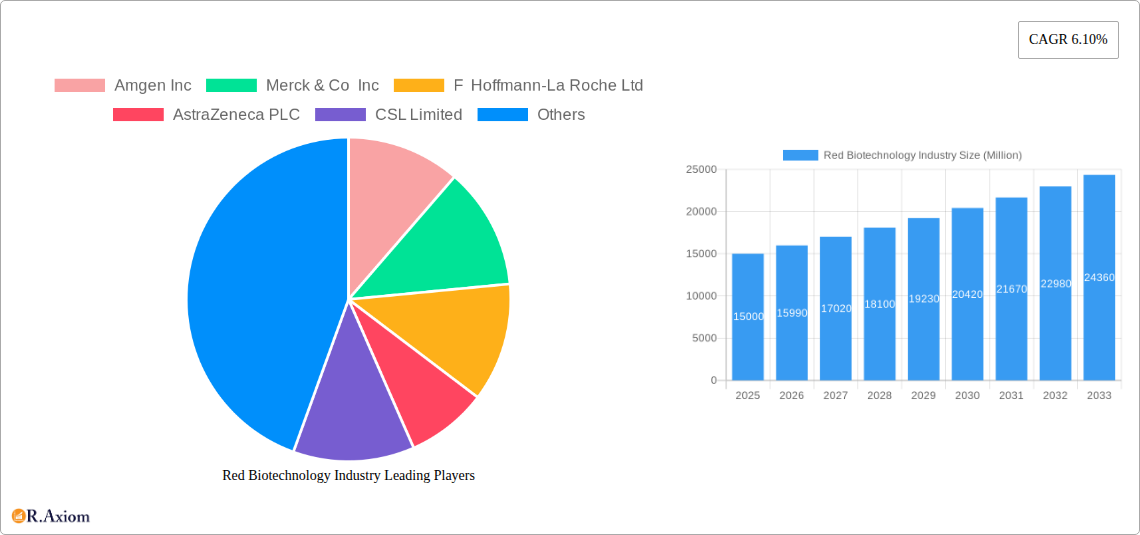
The Red Biotechnology market is characterized by a high degree of concentration, with a few large multinational corporations holding significant market share. Amgen Inc, Merck & Co Inc, F Hoffmann-La Roche Ltd, and AstraZeneca PLC collectively account for an estimated xx% of the global market share in 2025. Innovation is a key driver, fueled by significant R&D investments and the pursuit of novel therapeutic solutions. The regulatory landscape, including FDA approvals and international regulatory frameworks, plays a crucial role in shaping market dynamics. Product substitutes, particularly in areas like gene therapy and personalized medicine, pose both a challenge and an opportunity for existing players. End-user trends, especially the increasing demand for advanced therapies and personalized medicine, are pushing the industry toward greater specialization and innovation. M&A activity has been significant, with deal values exceeding xx Million in recent years, further consolidating the market and driving technological advancement. For example, the acquisition of Celgene by Bristol Myers Squibb significantly altered the competitive landscape.
- Market Share (2025): Amgen (xx%), Merck (xx%), Roche (xx%), AstraZeneca (xx%), Others (xx%).
- M&A Deal Value (2019-2024): xx Million.
- Key Innovation Drivers: Gene editing technologies (CRISPR), advancements in drug delivery systems, personalized medicine, biosimilars.
Red Biotechnology Industry Industry Trends & Insights
The Red Biotechnology industry is experiencing robust growth, driven by several factors including the increasing prevalence of chronic diseases, rising healthcare expenditure, and technological advancements. The market shows significant growth potential fueled by factors such as increasing research and development activities, an aging global population, technological innovations, and the rising adoption of advanced therapies. The CAGR for the period 2025-2033 is projected at xx%, indicating considerable market expansion. The market penetration of novel therapies is also rising, with gene therapies and cell therapies gaining significant traction. Competitive dynamics are shaped by factors such as the high cost of R&D, regulatory hurdles, and intense competition among major players. Significant technological disruptions, particularly in gene editing and personalized medicine, are reshaping the industry landscape, presenting both opportunities and challenges for existing players. Consumer preferences are shifting toward more targeted and effective treatments, driving innovation in areas like personalized medicine and companion diagnostics.
Dominant Markets & Segments in Red Biotechnology Industry
North America currently dominates the Red Biotechnology market, driven by high healthcare expenditure, strong regulatory support, and a large pool of skilled researchers and professionals. Within North America, the United States accounts for the largest market share due to its robust biotechnology sector and the presence of major industry players.
By Product:
- Drugs: This segment holds the largest market share, driven by high demand for novel therapeutics for chronic diseases. Key drivers include advancements in drug discovery and delivery mechanisms.
- Vaccines: This segment exhibits steady growth, spurred by government initiatives and increasing awareness of infectious diseases.
- Others: This category includes various other products contributing to a moderately growing market segment.
By End User:
- Biopharmaceutical Companies: This segment is the major end-user, owing to their high R&D investments and need for innovative therapeutic solutions.
- CMOs and CROs: The increasing outsourcing of R&D activities drives growth in this segment.
- Others: This includes research institutions, hospitals, and other entities involved in red biotechnology research and applications.
Key Drivers for North American Dominance:
- Robust funding for R&D.
- Strong regulatory frameworks.
- Presence of major market players.
- Advanced healthcare infrastructure.
Red Biotechnology Industry Product Developments
Recent product innovations focus on gene therapies, advanced drug delivery systems, and personalized medicines. The CRISPR-Combo technology, as demonstrated by the University of Maryland research (June 2022), offers significant advancements in gene editing, enabling enhanced crop breeding and potentially paving the way for new therapeutic applications. The FDA approval of SKYSONA (September 2022) highlights the growing potential of gene therapies to treat previously intractable diseases. These advancements demonstrate a strong market fit by addressing unmet medical needs and enhancing treatment efficacy.
Report Scope & Segmentation Analysis
This report segments the Red Biotechnology market by product (Vaccines, Drugs, Others) and end-user (Biopharmaceutical Companies, CMOs and CROs, Others). Each segment offers unique growth opportunities and competitive dynamics. The "Drugs" segment is projected to experience the fastest growth due to high demand for novel treatments. The "Biopharmaceutical Companies" segment dominates the end-user landscape. Detailed market size projections and competitive analyses are included for each segment within the complete report.
Key Drivers of Red Biotechnology Industry Growth
Technological advancements such as CRISPR gene editing, improved drug delivery systems, and personalized medicine significantly drive market growth. Favorable economic conditions, including increased healthcare spending, support innovation and adoption of new therapies. Supportive regulatory frameworks facilitate the development and approval of new treatments. For instance, the FDA's approval process, while rigorous, helps ensure the safety and efficacy of novel red biotechnology products.
Challenges in the Red Biotechnology Industry Sector
Stringent regulatory approvals, resulting in high development costs and extended timelines, pose significant challenges. Supply chain disruptions can impact the availability of raw materials and production capacity. Intense competition among major players can lead to price pressures and reduced profit margins. These challenges impact market growth and require strategic navigation. For example, the xx Million in losses attributed to supply chain disruptions in 2023 underscore the industry's vulnerability.
Emerging Opportunities in Red Biotechnology Industry
The growing demand for personalized medicine and gene therapies creates immense opportunities for market expansion. Advancements in data analytics and AI can enhance drug discovery and development. Expansion into new geographical markets, particularly in emerging economies, offers significant potential. These developments present growth catalysts for forward-thinking businesses.
Leading Players in the Red Biotechnology Industry Market
- Amgen Inc
- Merck & Co Inc
- F Hoffmann-La Roche Ltd
- AstraZeneca PLC
- CSL Limited
- Takeda Pharmaceutical Company Limited
- Bristol Myers Squibb (Celgene Corporation)
- Biogen Inc
- Gilead Sciences Inc
- Pfizer Inc
Key Developments in Red Biotechnology Industry Industry
- June 2022: Researchers at the University of Maryland developed CRISPR-Combo technology for enhanced gene editing in plants, potentially impacting agricultural practices and future therapeutic applications.
- September 2022: Bluebird bio, Inc. received US FDA approval for SKYSONA (elivaldogene autotemcel), a significant advancement in gene therapy for cerebral adrenoleukodystrophy.
Strategic Outlook for Red Biotechnology Industry Market
The Red Biotechnology market is poised for sustained growth, driven by technological advancements, increased healthcare spending, and a growing global population. Focus on personalized medicine, gene editing, and advanced drug delivery systems will shape future market potential. Strategic partnerships, M&A activities, and expansion into emerging markets will be crucial for long-term success. The market is expected to reach xx Million by 2033, demonstrating considerable growth potential.
Red Biotechnology Industry Segmentation
-
1. Product
- 1.1. Vaccines
- 1.2. Drugs
- 1.3. Others
-
2. End User
- 2.1. Biopharmaceutical Companies
- 2.2. CMOs and CROs
- 2.3. Others
Red Biotechnology Industry Segmentation By Geography
-
1. North America
- 1.1. United States
- 1.2. Canada
- 1.3. Mexico
-
2. Europe
- 2.1. Germany
- 2.2. United Kingdom
- 2.3. France
- 2.4. Italy
- 2.5. Spain
- 2.6. Rest of Europe
-
3. Asia Pacific
- 3.1. China
- 3.2. Japan
- 3.3. India
- 3.4. Australia
- 3.5. South Korea
- 3.6. Rest of Asia Pacific
-
4. Middle East and Africa
- 4.1. GCC
- 4.2. South Africa
- 4.3. Rest of Middle East and Africa
-
5. South America
- 5.1. Brazil
- 5.2. Argentina
- 5.3. Rest of South America
Red Biotechnology Industry REPORT HIGHLIGHTS
| Aspects | Details |
|---|---|
| Study Period | 2019-2033 |
| Base Year | 2024 |
| Estimated Year | 2025 |
| Forecast Period | 2025-2033 |
| Historical Period | 2019-2024 |
| Growth Rate | CAGR of 6.10% from 2019-2033 |
| Segmentation |
|
Table of Contents
- 1. Introduction
- 1.1. Research Scope
- 1.2. Market Segmentation
- 1.3. Research Methodology
- 1.4. Definitions and Assumptions
- 2. Executive Summary
- 2.1. Introduction
- 3. Market Dynamics
- 3.1. Introduction
- 3.2. Market Drivers
- 3.2.1. Rising Incidence and Prevalence of Chronic and Rare Diseases; Increased Funding in the Healthcare Industry
- 3.3. Market Restrains
- 3.3.1. Costly Therapeutic Technology and Machinery
- 3.4. Market Trends
- 3.4.1. The Biopharmaceutical Companies Segment is Expected to Hold a Significant Market Share Over the Forecast Period
- 4. Market Factor Analysis
- 4.1. Porters Five Forces
- 4.2. Supply/Value Chain
- 4.3. PESTEL analysis
- 4.4. Market Entropy
- 4.5. Patent/Trademark Analysis
- 5. Global Red Biotechnology Industry Analysis, Insights and Forecast, 2019-2031
- 5.1. Market Analysis, Insights and Forecast - by Product
- 5.1.1. Vaccines
- 5.1.2. Drugs
- 5.1.3. Others
- 5.2. Market Analysis, Insights and Forecast - by End User
- 5.2.1. Biopharmaceutical Companies
- 5.2.2. CMOs and CROs
- 5.2.3. Others
- 5.3. Market Analysis, Insights and Forecast - by Region
- 5.3.1. North America
- 5.3.2. Europe
- 5.3.3. Asia Pacific
- 5.3.4. Middle East and Africa
- 5.3.5. South America
- 5.1. Market Analysis, Insights and Forecast - by Product
- 6. North America Red Biotechnology Industry Analysis, Insights and Forecast, 2019-2031
- 6.1. Market Analysis, Insights and Forecast - by Product
- 6.1.1. Vaccines
- 6.1.2. Drugs
- 6.1.3. Others
- 6.2. Market Analysis, Insights and Forecast - by End User
- 6.2.1. Biopharmaceutical Companies
- 6.2.2. CMOs and CROs
- 6.2.3. Others
- 6.1. Market Analysis, Insights and Forecast - by Product
- 7. Europe Red Biotechnology Industry Analysis, Insights and Forecast, 2019-2031
- 7.1. Market Analysis, Insights and Forecast - by Product
- 7.1.1. Vaccines
- 7.1.2. Drugs
- 7.1.3. Others
- 7.2. Market Analysis, Insights and Forecast - by End User
- 7.2.1. Biopharmaceutical Companies
- 7.2.2. CMOs and CROs
- 7.2.3. Others
- 7.1. Market Analysis, Insights and Forecast - by Product
- 8. Asia Pacific Red Biotechnology Industry Analysis, Insights and Forecast, 2019-2031
- 8.1. Market Analysis, Insights and Forecast - by Product
- 8.1.1. Vaccines
- 8.1.2. Drugs
- 8.1.3. Others
- 8.2. Market Analysis, Insights and Forecast - by End User
- 8.2.1. Biopharmaceutical Companies
- 8.2.2. CMOs and CROs
- 8.2.3. Others
- 8.1. Market Analysis, Insights and Forecast - by Product
- 9. Middle East and Africa Red Biotechnology Industry Analysis, Insights and Forecast, 2019-2031
- 9.1. Market Analysis, Insights and Forecast - by Product
- 9.1.1. Vaccines
- 9.1.2. Drugs
- 9.1.3. Others
- 9.2. Market Analysis, Insights and Forecast - by End User
- 9.2.1. Biopharmaceutical Companies
- 9.2.2. CMOs and CROs
- 9.2.3. Others
- 9.1. Market Analysis, Insights and Forecast - by Product
- 10. South America Red Biotechnology Industry Analysis, Insights and Forecast, 2019-2031
- 10.1. Market Analysis, Insights and Forecast - by Product
- 10.1.1. Vaccines
- 10.1.2. Drugs
- 10.1.3. Others
- 10.2. Market Analysis, Insights and Forecast - by End User
- 10.2.1. Biopharmaceutical Companies
- 10.2.2. CMOs and CROs
- 10.2.3. Others
- 10.1. Market Analysis, Insights and Forecast - by Product
- 11. North America Red Biotechnology Industry Analysis, Insights and Forecast, 2019-2031
- 11.1. Market Analysis, Insights and Forecast - By Country/Sub-region
- 11.1.1 United States
- 11.1.2 Canada
- 11.1.3 Mexico
- 12. Europe Red Biotechnology Industry Analysis, Insights and Forecast, 2019-2031
- 12.1. Market Analysis, Insights and Forecast - By Country/Sub-region
- 12.1.1 Germany
- 12.1.2 United Kingdom
- 12.1.3 France
- 12.1.4 Italy
- 12.1.5 Spain
- 12.1.6 Rest of Europe
- 13. Asia Pacific Red Biotechnology Industry Analysis, Insights and Forecast, 2019-2031
- 13.1. Market Analysis, Insights and Forecast - By Country/Sub-region
- 13.1.1 China
- 13.1.2 Japan
- 13.1.3 India
- 13.1.4 Australia
- 13.1.5 South Korea
- 13.1.6 Rest of Asia Pacific
- 14. Middle East and Africa Red Biotechnology Industry Analysis, Insights and Forecast, 2019-2031
- 14.1. Market Analysis, Insights and Forecast - By Country/Sub-region
- 14.1.1 GCC
- 14.1.2 South Africa
- 14.1.3 Rest of Middle East and Africa
- 15. South America Red Biotechnology Industry Analysis, Insights and Forecast, 2019-2031
- 15.1. Market Analysis, Insights and Forecast - By Country/Sub-region
- 15.1.1 Brazil
- 15.1.2 Argentina
- 15.1.3 Rest of South America
- 16. Competitive Analysis
- 16.1. Global Market Share Analysis 2024
- 16.2. Company Profiles
- 16.2.1 Amgen Inc
- 16.2.1.1. Overview
- 16.2.1.2. Products
- 16.2.1.3. SWOT Analysis
- 16.2.1.4. Recent Developments
- 16.2.1.5. Financials (Based on Availability)
- 16.2.2 Merck & Co Inc
- 16.2.2.1. Overview
- 16.2.2.2. Products
- 16.2.2.3. SWOT Analysis
- 16.2.2.4. Recent Developments
- 16.2.2.5. Financials (Based on Availability)
- 16.2.3 F Hoffmann-La Roche Ltd
- 16.2.3.1. Overview
- 16.2.3.2. Products
- 16.2.3.3. SWOT Analysis
- 16.2.3.4. Recent Developments
- 16.2.3.5. Financials (Based on Availability)
- 16.2.4 AstraZeneca PLC
- 16.2.4.1. Overview
- 16.2.4.2. Products
- 16.2.4.3. SWOT Analysis
- 16.2.4.4. Recent Developments
- 16.2.4.5. Financials (Based on Availability)
- 16.2.5 CSL Limited
- 16.2.5.1. Overview
- 16.2.5.2. Products
- 16.2.5.3. SWOT Analysis
- 16.2.5.4. Recent Developments
- 16.2.5.5. Financials (Based on Availability)
- 16.2.6 Takeda Pharmaceutical Company Limited
- 16.2.6.1. Overview
- 16.2.6.2. Products
- 16.2.6.3. SWOT Analysis
- 16.2.6.4. Recent Developments
- 16.2.6.5. Financials (Based on Availability)
- 16.2.7 Bristol Myers Squibb (Celgene Corporation)
- 16.2.7.1. Overview
- 16.2.7.2. Products
- 16.2.7.3. SWOT Analysis
- 16.2.7.4. Recent Developments
- 16.2.7.5. Financials (Based on Availability)
- 16.2.8 Biogen Inc
- 16.2.8.1. Overview
- 16.2.8.2. Products
- 16.2.8.3. SWOT Analysis
- 16.2.8.4. Recent Developments
- 16.2.8.5. Financials (Based on Availability)
- 16.2.9 Gilead Sciences Inc
- 16.2.9.1. Overview
- 16.2.9.2. Products
- 16.2.9.3. SWOT Analysis
- 16.2.9.4. Recent Developments
- 16.2.9.5. Financials (Based on Availability)
- 16.2.10 Pfizer Inc
- 16.2.10.1. Overview
- 16.2.10.2. Products
- 16.2.10.3. SWOT Analysis
- 16.2.10.4. Recent Developments
- 16.2.10.5. Financials (Based on Availability)
- 16.2.1 Amgen Inc
List of Figures
- Figure 1: Global Red Biotechnology Industry Revenue Breakdown (Million, %) by Region 2024 & 2032
- Figure 2: Global Red Biotechnology Industry Volume Breakdown (K Unit, %) by Region 2024 & 2032
- Figure 3: North America Red Biotechnology Industry Revenue (Million), by Country 2024 & 2032
- Figure 4: North America Red Biotechnology Industry Volume (K Unit), by Country 2024 & 2032
- Figure 5: North America Red Biotechnology Industry Revenue Share (%), by Country 2024 & 2032
- Figure 6: North America Red Biotechnology Industry Volume Share (%), by Country 2024 & 2032
- Figure 7: Europe Red Biotechnology Industry Revenue (Million), by Country 2024 & 2032
- Figure 8: Europe Red Biotechnology Industry Volume (K Unit), by Country 2024 & 2032
- Figure 9: Europe Red Biotechnology Industry Revenue Share (%), by Country 2024 & 2032
- Figure 10: Europe Red Biotechnology Industry Volume Share (%), by Country 2024 & 2032
- Figure 11: Asia Pacific Red Biotechnology Industry Revenue (Million), by Country 2024 & 2032
- Figure 12: Asia Pacific Red Biotechnology Industry Volume (K Unit), by Country 2024 & 2032
- Figure 13: Asia Pacific Red Biotechnology Industry Revenue Share (%), by Country 2024 & 2032
- Figure 14: Asia Pacific Red Biotechnology Industry Volume Share (%), by Country 2024 & 2032
- Figure 15: Middle East and Africa Red Biotechnology Industry Revenue (Million), by Country 2024 & 2032
- Figure 16: Middle East and Africa Red Biotechnology Industry Volume (K Unit), by Country 2024 & 2032
- Figure 17: Middle East and Africa Red Biotechnology Industry Revenue Share (%), by Country 2024 & 2032
- Figure 18: Middle East and Africa Red Biotechnology Industry Volume Share (%), by Country 2024 & 2032
- Figure 19: South America Red Biotechnology Industry Revenue (Million), by Country 2024 & 2032
- Figure 20: South America Red Biotechnology Industry Volume (K Unit), by Country 2024 & 2032
- Figure 21: South America Red Biotechnology Industry Revenue Share (%), by Country 2024 & 2032
- Figure 22: South America Red Biotechnology Industry Volume Share (%), by Country 2024 & 2032
- Figure 23: North America Red Biotechnology Industry Revenue (Million), by Product 2024 & 2032
- Figure 24: North America Red Biotechnology Industry Volume (K Unit), by Product 2024 & 2032
- Figure 25: North America Red Biotechnology Industry Revenue Share (%), by Product 2024 & 2032
- Figure 26: North America Red Biotechnology Industry Volume Share (%), by Product 2024 & 2032
- Figure 27: North America Red Biotechnology Industry Revenue (Million), by End User 2024 & 2032
- Figure 28: North America Red Biotechnology Industry Volume (K Unit), by End User 2024 & 2032
- Figure 29: North America Red Biotechnology Industry Revenue Share (%), by End User 2024 & 2032
- Figure 30: North America Red Biotechnology Industry Volume Share (%), by End User 2024 & 2032
- Figure 31: North America Red Biotechnology Industry Revenue (Million), by Country 2024 & 2032
- Figure 32: North America Red Biotechnology Industry Volume (K Unit), by Country 2024 & 2032
- Figure 33: North America Red Biotechnology Industry Revenue Share (%), by Country 2024 & 2032
- Figure 34: North America Red Biotechnology Industry Volume Share (%), by Country 2024 & 2032
- Figure 35: Europe Red Biotechnology Industry Revenue (Million), by Product 2024 & 2032
- Figure 36: Europe Red Biotechnology Industry Volume (K Unit), by Product 2024 & 2032
- Figure 37: Europe Red Biotechnology Industry Revenue Share (%), by Product 2024 & 2032
- Figure 38: Europe Red Biotechnology Industry Volume Share (%), by Product 2024 & 2032
- Figure 39: Europe Red Biotechnology Industry Revenue (Million), by End User 2024 & 2032
- Figure 40: Europe Red Biotechnology Industry Volume (K Unit), by End User 2024 & 2032
- Figure 41: Europe Red Biotechnology Industry Revenue Share (%), by End User 2024 & 2032
- Figure 42: Europe Red Biotechnology Industry Volume Share (%), by End User 2024 & 2032
- Figure 43: Europe Red Biotechnology Industry Revenue (Million), by Country 2024 & 2032
- Figure 44: Europe Red Biotechnology Industry Volume (K Unit), by Country 2024 & 2032
- Figure 45: Europe Red Biotechnology Industry Revenue Share (%), by Country 2024 & 2032
- Figure 46: Europe Red Biotechnology Industry Volume Share (%), by Country 2024 & 2032
- Figure 47: Asia Pacific Red Biotechnology Industry Revenue (Million), by Product 2024 & 2032
- Figure 48: Asia Pacific Red Biotechnology Industry Volume (K Unit), by Product 2024 & 2032
- Figure 49: Asia Pacific Red Biotechnology Industry Revenue Share (%), by Product 2024 & 2032
- Figure 50: Asia Pacific Red Biotechnology Industry Volume Share (%), by Product 2024 & 2032
- Figure 51: Asia Pacific Red Biotechnology Industry Revenue (Million), by End User 2024 & 2032
- Figure 52: Asia Pacific Red Biotechnology Industry Volume (K Unit), by End User 2024 & 2032
- Figure 53: Asia Pacific Red Biotechnology Industry Revenue Share (%), by End User 2024 & 2032
- Figure 54: Asia Pacific Red Biotechnology Industry Volume Share (%), by End User 2024 & 2032
- Figure 55: Asia Pacific Red Biotechnology Industry Revenue (Million), by Country 2024 & 2032
- Figure 56: Asia Pacific Red Biotechnology Industry Volume (K Unit), by Country 2024 & 2032
- Figure 57: Asia Pacific Red Biotechnology Industry Revenue Share (%), by Country 2024 & 2032
- Figure 58: Asia Pacific Red Biotechnology Industry Volume Share (%), by Country 2024 & 2032
- Figure 59: Middle East and Africa Red Biotechnology Industry Revenue (Million), by Product 2024 & 2032
- Figure 60: Middle East and Africa Red Biotechnology Industry Volume (K Unit), by Product 2024 & 2032
- Figure 61: Middle East and Africa Red Biotechnology Industry Revenue Share (%), by Product 2024 & 2032
- Figure 62: Middle East and Africa Red Biotechnology Industry Volume Share (%), by Product 2024 & 2032
- Figure 63: Middle East and Africa Red Biotechnology Industry Revenue (Million), by End User 2024 & 2032
- Figure 64: Middle East and Africa Red Biotechnology Industry Volume (K Unit), by End User 2024 & 2032
- Figure 65: Middle East and Africa Red Biotechnology Industry Revenue Share (%), by End User 2024 & 2032
- Figure 66: Middle East and Africa Red Biotechnology Industry Volume Share (%), by End User 2024 & 2032
- Figure 67: Middle East and Africa Red Biotechnology Industry Revenue (Million), by Country 2024 & 2032
- Figure 68: Middle East and Africa Red Biotechnology Industry Volume (K Unit), by Country 2024 & 2032
- Figure 69: Middle East and Africa Red Biotechnology Industry Revenue Share (%), by Country 2024 & 2032
- Figure 70: Middle East and Africa Red Biotechnology Industry Volume Share (%), by Country 2024 & 2032
- Figure 71: South America Red Biotechnology Industry Revenue (Million), by Product 2024 & 2032
- Figure 72: South America Red Biotechnology Industry Volume (K Unit), by Product 2024 & 2032
- Figure 73: South America Red Biotechnology Industry Revenue Share (%), by Product 2024 & 2032
- Figure 74: South America Red Biotechnology Industry Volume Share (%), by Product 2024 & 2032
- Figure 75: South America Red Biotechnology Industry Revenue (Million), by End User 2024 & 2032
- Figure 76: South America Red Biotechnology Industry Volume (K Unit), by End User 2024 & 2032
- Figure 77: South America Red Biotechnology Industry Revenue Share (%), by End User 2024 & 2032
- Figure 78: South America Red Biotechnology Industry Volume Share (%), by End User 2024 & 2032
- Figure 79: South America Red Biotechnology Industry Revenue (Million), by Country 2024 & 2032
- Figure 80: South America Red Biotechnology Industry Volume (K Unit), by Country 2024 & 2032
- Figure 81: South America Red Biotechnology Industry Revenue Share (%), by Country 2024 & 2032
- Figure 82: South America Red Biotechnology Industry Volume Share (%), by Country 2024 & 2032
List of Tables
- Table 1: Global Red Biotechnology Industry Revenue Million Forecast, by Region 2019 & 2032
- Table 2: Global Red Biotechnology Industry Volume K Unit Forecast, by Region 2019 & 2032
- Table 3: Global Red Biotechnology Industry Revenue Million Forecast, by Product 2019 & 2032
- Table 4: Global Red Biotechnology Industry Volume K Unit Forecast, by Product 2019 & 2032
- Table 5: Global Red Biotechnology Industry Revenue Million Forecast, by End User 2019 & 2032
- Table 6: Global Red Biotechnology Industry Volume K Unit Forecast, by End User 2019 & 2032
- Table 7: Global Red Biotechnology Industry Revenue Million Forecast, by Region 2019 & 2032
- Table 8: Global Red Biotechnology Industry Volume K Unit Forecast, by Region 2019 & 2032
- Table 9: Global Red Biotechnology Industry Revenue Million Forecast, by Country 2019 & 2032
- Table 10: Global Red Biotechnology Industry Volume K Unit Forecast, by Country 2019 & 2032
- Table 11: United States Red Biotechnology Industry Revenue (Million) Forecast, by Application 2019 & 2032
- Table 12: United States Red Biotechnology Industry Volume (K Unit) Forecast, by Application 2019 & 2032
- Table 13: Canada Red Biotechnology Industry Revenue (Million) Forecast, by Application 2019 & 2032
- Table 14: Canada Red Biotechnology Industry Volume (K Unit) Forecast, by Application 2019 & 2032
- Table 15: Mexico Red Biotechnology Industry Revenue (Million) Forecast, by Application 2019 & 2032
- Table 16: Mexico Red Biotechnology Industry Volume (K Unit) Forecast, by Application 2019 & 2032
- Table 17: Global Red Biotechnology Industry Revenue Million Forecast, by Country 2019 & 2032
- Table 18: Global Red Biotechnology Industry Volume K Unit Forecast, by Country 2019 & 2032
- Table 19: Germany Red Biotechnology Industry Revenue (Million) Forecast, by Application 2019 & 2032
- Table 20: Germany Red Biotechnology Industry Volume (K Unit) Forecast, by Application 2019 & 2032
- Table 21: United Kingdom Red Biotechnology Industry Revenue (Million) Forecast, by Application 2019 & 2032
- Table 22: United Kingdom Red Biotechnology Industry Volume (K Unit) Forecast, by Application 2019 & 2032
- Table 23: France Red Biotechnology Industry Revenue (Million) Forecast, by Application 2019 & 2032
- Table 24: France Red Biotechnology Industry Volume (K Unit) Forecast, by Application 2019 & 2032
- Table 25: Italy Red Biotechnology Industry Revenue (Million) Forecast, by Application 2019 & 2032
- Table 26: Italy Red Biotechnology Industry Volume (K Unit) Forecast, by Application 2019 & 2032
- Table 27: Spain Red Biotechnology Industry Revenue (Million) Forecast, by Application 2019 & 2032
- Table 28: Spain Red Biotechnology Industry Volume (K Unit) Forecast, by Application 2019 & 2032
- Table 29: Rest of Europe Red Biotechnology Industry Revenue (Million) Forecast, by Application 2019 & 2032
- Table 30: Rest of Europe Red Biotechnology Industry Volume (K Unit) Forecast, by Application 2019 & 2032
- Table 31: Global Red Biotechnology Industry Revenue Million Forecast, by Country 2019 & 2032
- Table 32: Global Red Biotechnology Industry Volume K Unit Forecast, by Country 2019 & 2032
- Table 33: China Red Biotechnology Industry Revenue (Million) Forecast, by Application 2019 & 2032
- Table 34: China Red Biotechnology Industry Volume (K Unit) Forecast, by Application 2019 & 2032
- Table 35: Japan Red Biotechnology Industry Revenue (Million) Forecast, by Application 2019 & 2032
- Table 36: Japan Red Biotechnology Industry Volume (K Unit) Forecast, by Application 2019 & 2032
- Table 37: India Red Biotechnology Industry Revenue (Million) Forecast, by Application 2019 & 2032
- Table 38: India Red Biotechnology Industry Volume (K Unit) Forecast, by Application 2019 & 2032
- Table 39: Australia Red Biotechnology Industry Revenue (Million) Forecast, by Application 2019 & 2032
- Table 40: Australia Red Biotechnology Industry Volume (K Unit) Forecast, by Application 2019 & 2032
- Table 41: South Korea Red Biotechnology Industry Revenue (Million) Forecast, by Application 2019 & 2032
- Table 42: South Korea Red Biotechnology Industry Volume (K Unit) Forecast, by Application 2019 & 2032
- Table 43: Rest of Asia Pacific Red Biotechnology Industry Revenue (Million) Forecast, by Application 2019 & 2032
- Table 44: Rest of Asia Pacific Red Biotechnology Industry Volume (K Unit) Forecast, by Application 2019 & 2032
- Table 45: Global Red Biotechnology Industry Revenue Million Forecast, by Country 2019 & 2032
- Table 46: Global Red Biotechnology Industry Volume K Unit Forecast, by Country 2019 & 2032
- Table 47: GCC Red Biotechnology Industry Revenue (Million) Forecast, by Application 2019 & 2032
- Table 48: GCC Red Biotechnology Industry Volume (K Unit) Forecast, by Application 2019 & 2032
- Table 49: South Africa Red Biotechnology Industry Revenue (Million) Forecast, by Application 2019 & 2032
- Table 50: South Africa Red Biotechnology Industry Volume (K Unit) Forecast, by Application 2019 & 2032
- Table 51: Rest of Middle East and Africa Red Biotechnology Industry Revenue (Million) Forecast, by Application 2019 & 2032
- Table 52: Rest of Middle East and Africa Red Biotechnology Industry Volume (K Unit) Forecast, by Application 2019 & 2032
- Table 53: Global Red Biotechnology Industry Revenue Million Forecast, by Country 2019 & 2032
- Table 54: Global Red Biotechnology Industry Volume K Unit Forecast, by Country 2019 & 2032
- Table 55: Brazil Red Biotechnology Industry Revenue (Million) Forecast, by Application 2019 & 2032
- Table 56: Brazil Red Biotechnology Industry Volume (K Unit) Forecast, by Application 2019 & 2032
- Table 57: Argentina Red Biotechnology Industry Revenue (Million) Forecast, by Application 2019 & 2032
- Table 58: Argentina Red Biotechnology Industry Volume (K Unit) Forecast, by Application 2019 & 2032
- Table 59: Rest of South America Red Biotechnology Industry Revenue (Million) Forecast, by Application 2019 & 2032
- Table 60: Rest of South America Red Biotechnology Industry Volume (K Unit) Forecast, by Application 2019 & 2032
- Table 61: Global Red Biotechnology Industry Revenue Million Forecast, by Product 2019 & 2032
- Table 62: Global Red Biotechnology Industry Volume K Unit Forecast, by Product 2019 & 2032
- Table 63: Global Red Biotechnology Industry Revenue Million Forecast, by End User 2019 & 2032
- Table 64: Global Red Biotechnology Industry Volume K Unit Forecast, by End User 2019 & 2032
- Table 65: Global Red Biotechnology Industry Revenue Million Forecast, by Country 2019 & 2032
- Table 66: Global Red Biotechnology Industry Volume K Unit Forecast, by Country 2019 & 2032
- Table 67: United States Red Biotechnology Industry Revenue (Million) Forecast, by Application 2019 & 2032
- Table 68: United States Red Biotechnology Industry Volume (K Unit) Forecast, by Application 2019 & 2032
- Table 69: Canada Red Biotechnology Industry Revenue (Million) Forecast, by Application 2019 & 2032
- Table 70: Canada Red Biotechnology Industry Volume (K Unit) Forecast, by Application 2019 & 2032
- Table 71: Mexico Red Biotechnology Industry Revenue (Million) Forecast, by Application 2019 & 2032
- Table 72: Mexico Red Biotechnology Industry Volume (K Unit) Forecast, by Application 2019 & 2032
- Table 73: Global Red Biotechnology Industry Revenue Million Forecast, by Product 2019 & 2032
- Table 74: Global Red Biotechnology Industry Volume K Unit Forecast, by Product 2019 & 2032
- Table 75: Global Red Biotechnology Industry Revenue Million Forecast, by End User 2019 & 2032
- Table 76: Global Red Biotechnology Industry Volume K Unit Forecast, by End User 2019 & 2032
- Table 77: Global Red Biotechnology Industry Revenue Million Forecast, by Country 2019 & 2032
- Table 78: Global Red Biotechnology Industry Volume K Unit Forecast, by Country 2019 & 2032
- Table 79: Germany Red Biotechnology Industry Revenue (Million) Forecast, by Application 2019 & 2032
- Table 80: Germany Red Biotechnology Industry Volume (K Unit) Forecast, by Application 2019 & 2032
- Table 81: United Kingdom Red Biotechnology Industry Revenue (Million) Forecast, by Application 2019 & 2032
- Table 82: United Kingdom Red Biotechnology Industry Volume (K Unit) Forecast, by Application 2019 & 2032
- Table 83: France Red Biotechnology Industry Revenue (Million) Forecast, by Application 2019 & 2032
- Table 84: France Red Biotechnology Industry Volume (K Unit) Forecast, by Application 2019 & 2032
- Table 85: Italy Red Biotechnology Industry Revenue (Million) Forecast, by Application 2019 & 2032
- Table 86: Italy Red Biotechnology Industry Volume (K Unit) Forecast, by Application 2019 & 2032
- Table 87: Spain Red Biotechnology Industry Revenue (Million) Forecast, by Application 2019 & 2032
- Table 88: Spain Red Biotechnology Industry Volume (K Unit) Forecast, by Application 2019 & 2032
- Table 89: Rest of Europe Red Biotechnology Industry Revenue (Million) Forecast, by Application 2019 & 2032
- Table 90: Rest of Europe Red Biotechnology Industry Volume (K Unit) Forecast, by Application 2019 & 2032
- Table 91: Global Red Biotechnology Industry Revenue Million Forecast, by Product 2019 & 2032
- Table 92: Global Red Biotechnology Industry Volume K Unit Forecast, by Product 2019 & 2032
- Table 93: Global Red Biotechnology Industry Revenue Million Forecast, by End User 2019 & 2032
- Table 94: Global Red Biotechnology Industry Volume K Unit Forecast, by End User 2019 & 2032
- Table 95: Global Red Biotechnology Industry Revenue Million Forecast, by Country 2019 & 2032
- Table 96: Global Red Biotechnology Industry Volume K Unit Forecast, by Country 2019 & 2032
- Table 97: China Red Biotechnology Industry Revenue (Million) Forecast, by Application 2019 & 2032
- Table 98: China Red Biotechnology Industry Volume (K Unit) Forecast, by Application 2019 & 2032
- Table 99: Japan Red Biotechnology Industry Revenue (Million) Forecast, by Application 2019 & 2032
- Table 100: Japan Red Biotechnology Industry Volume (K Unit) Forecast, by Application 2019 & 2032
- Table 101: India Red Biotechnology Industry Revenue (Million) Forecast, by Application 2019 & 2032
- Table 102: India Red Biotechnology Industry Volume (K Unit) Forecast, by Application 2019 & 2032
- Table 103: Australia Red Biotechnology Industry Revenue (Million) Forecast, by Application 2019 & 2032
- Table 104: Australia Red Biotechnology Industry Volume (K Unit) Forecast, by Application 2019 & 2032
- Table 105: South Korea Red Biotechnology Industry Revenue (Million) Forecast, by Application 2019 & 2032
- Table 106: South Korea Red Biotechnology Industry Volume (K Unit) Forecast, by Application 2019 & 2032
- Table 107: Rest of Asia Pacific Red Biotechnology Industry Revenue (Million) Forecast, by Application 2019 & 2032
- Table 108: Rest of Asia Pacific Red Biotechnology Industry Volume (K Unit) Forecast, by Application 2019 & 2032
- Table 109: Global Red Biotechnology Industry Revenue Million Forecast, by Product 2019 & 2032
- Table 110: Global Red Biotechnology Industry Volume K Unit Forecast, by Product 2019 & 2032
- Table 111: Global Red Biotechnology Industry Revenue Million Forecast, by End User 2019 & 2032
- Table 112: Global Red Biotechnology Industry Volume K Unit Forecast, by End User 2019 & 2032
- Table 113: Global Red Biotechnology Industry Revenue Million Forecast, by Country 2019 & 2032
- Table 114: Global Red Biotechnology Industry Volume K Unit Forecast, by Country 2019 & 2032
- Table 115: GCC Red Biotechnology Industry Revenue (Million) Forecast, by Application 2019 & 2032
- Table 116: GCC Red Biotechnology Industry Volume (K Unit) Forecast, by Application 2019 & 2032
- Table 117: South Africa Red Biotechnology Industry Revenue (Million) Forecast, by Application 2019 & 2032
- Table 118: South Africa Red Biotechnology Industry Volume (K Unit) Forecast, by Application 2019 & 2032
- Table 119: Rest of Middle East and Africa Red Biotechnology Industry Revenue (Million) Forecast, by Application 2019 & 2032
- Table 120: Rest of Middle East and Africa Red Biotechnology Industry Volume (K Unit) Forecast, by Application 2019 & 2032
- Table 121: Global Red Biotechnology Industry Revenue Million Forecast, by Product 2019 & 2032
- Table 122: Global Red Biotechnology Industry Volume K Unit Forecast, by Product 2019 & 2032
- Table 123: Global Red Biotechnology Industry Revenue Million Forecast, by End User 2019 & 2032
- Table 124: Global Red Biotechnology Industry Volume K Unit Forecast, by End User 2019 & 2032
- Table 125: Global Red Biotechnology Industry Revenue Million Forecast, by Country 2019 & 2032
- Table 126: Global Red Biotechnology Industry Volume K Unit Forecast, by Country 2019 & 2032
- Table 127: Brazil Red Biotechnology Industry Revenue (Million) Forecast, by Application 2019 & 2032
- Table 128: Brazil Red Biotechnology Industry Volume (K Unit) Forecast, by Application 2019 & 2032
- Table 129: Argentina Red Biotechnology Industry Revenue (Million) Forecast, by Application 2019 & 2032
- Table 130: Argentina Red Biotechnology Industry Volume (K Unit) Forecast, by Application 2019 & 2032
- Table 131: Rest of South America Red Biotechnology Industry Revenue (Million) Forecast, by Application 2019 & 2032
- Table 132: Rest of South America Red Biotechnology Industry Volume (K Unit) Forecast, by Application 2019 & 2032
Frequently Asked Questions
1. What is the projected Compound Annual Growth Rate (CAGR) of the Red Biotechnology Industry?
The projected CAGR is approximately 6.10%.
2. Which companies are prominent players in the Red Biotechnology Industry?
Key companies in the market include Amgen Inc, Merck & Co Inc, F Hoffmann-La Roche Ltd, AstraZeneca PLC, CSL Limited, Takeda Pharmaceutical Company Limited, Bristol Myers Squibb (Celgene Corporation), Biogen Inc, Gilead Sciences Inc, Pfizer Inc.
3. What are the main segments of the Red Biotechnology Industry?
The market segments include Product, End User.
4. Can you provide details about the market size?
The market size is estimated to be USD XX Million as of 2022.
5. What are some drivers contributing to market growth?
Rising Incidence and Prevalence of Chronic and Rare Diseases; Increased Funding in the Healthcare Industry.
6. What are the notable trends driving market growth?
The Biopharmaceutical Companies Segment is Expected to Hold a Significant Market Share Over the Forecast Period.
7. Are there any restraints impacting market growth?
Costly Therapeutic Technology and Machinery.
8. Can you provide examples of recent developments in the market?
June 2022: Researchers at the University of Maryland's College of Agriculture and Natural Resources found that CRISPR-Combo allows several genes to be edited in plants while altering other genes' expression. The National Institute of Food and Agriculture of the United States Food and Drug Administration helped develop this new technology, allowing genetic engineering combinations to enhance crop breeding and functionality.
9. What pricing options are available for accessing the report?
Pricing options include single-user, multi-user, and enterprise licenses priced at USD 4750, USD 5250, and USD 8750 respectively.
10. Is the market size provided in terms of value or volume?
The market size is provided in terms of value, measured in Million and volume, measured in K Unit.
11. Are there any specific market keywords associated with the report?
Yes, the market keyword associated with the report is "Red Biotechnology Industry," which aids in identifying and referencing the specific market segment covered.
12. How do I determine which pricing option suits my needs best?
The pricing options vary based on user requirements and access needs. Individual users may opt for single-user licenses, while businesses requiring broader access may choose multi-user or enterprise licenses for cost-effective access to the report.
13. Are there any additional resources or data provided in the Red Biotechnology Industry report?
While the report offers comprehensive insights, it's advisable to review the specific contents or supplementary materials provided to ascertain if additional resources or data are available.
14. How can I stay updated on further developments or reports in the Red Biotechnology Industry?
To stay informed about further developments, trends, and reports in the Red Biotechnology Industry, consider subscribing to industry newsletters, following relevant companies and organizations, or regularly checking reputable industry news sources and publications.
Methodology
Step 1 - Identification of Relevant Samples Size from Population Database


Step 2 - Approaches for Defining Global Market Size (Value, Volume* & Price*)

Note*: In applicable scenarios
Step 3 - Data Sources
Primary Research
- Web Analytics
- Survey Reports
- Research Institute
- Latest Research Reports
- Opinion Leaders
Secondary Research
- Annual Reports
- White Paper
- Latest Press Release
- Industry Association
- Paid Database
- Investor Presentations

Step 4 - Data Triangulation
Involves using different sources of information in order to increase the validity of a study
These sources are likely to be stakeholders in a program - participants, other researchers, program staff, other community members, and so on.
Then we put all data in single framework & apply various statistical tools to find out the dynamic on the market.
During the analysis stage, feedback from the stakeholder groups would be compared to determine areas of agreement as well as areas of divergence


