
Key Insights
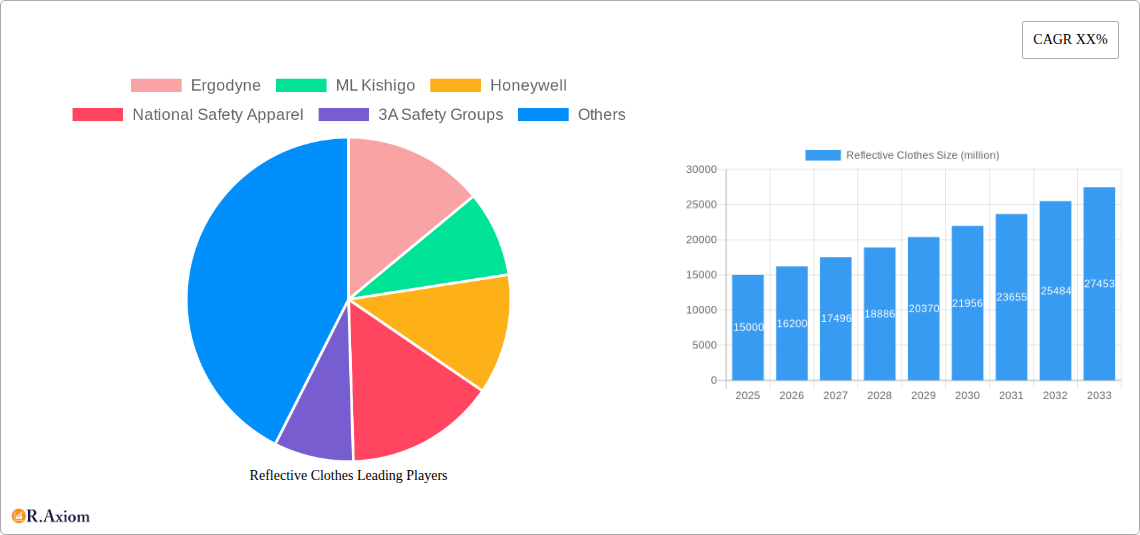
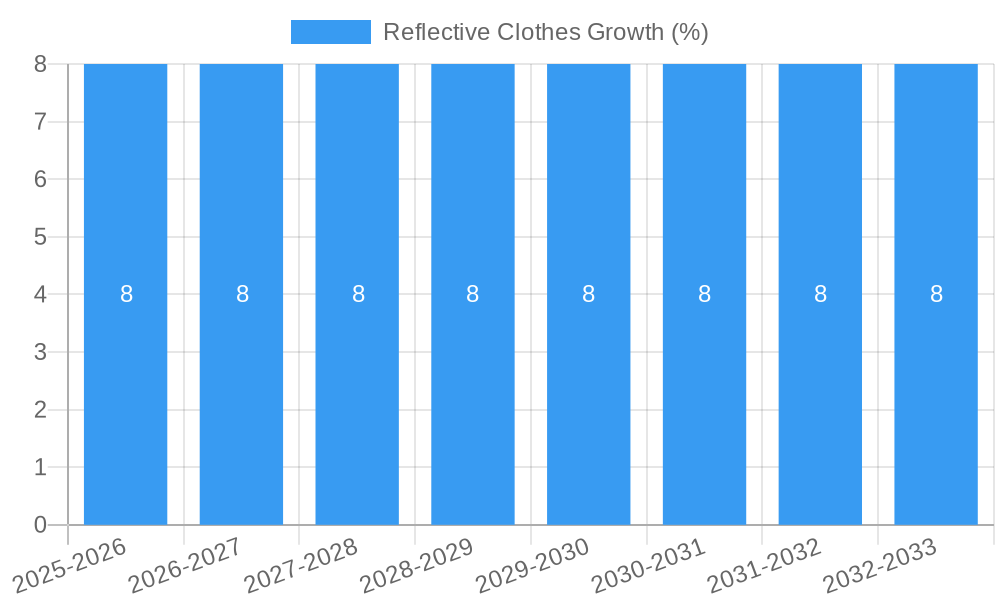
The global reflective clothing market is poised for robust growth, projected to reach a substantial market size of approximately USD 15,000 million by 2025, with a projected Compound Annual Growth Rate (CAGR) of around 8%. This upward trajectory is primarily fueled by increasing safety regulations across diverse industries and a growing awareness of personal safety among individuals. Key drivers include mandatory implementation of high-visibility apparel in sectors like construction, transportation, emergency services, and manufacturing, where visibility can be a critical factor in preventing accidents. Furthermore, the rising demand for durable and comfortable reflective workwear, coupled with advancements in fabric technology and design, is expanding the market's appeal. The market is segmented by application into men's and women's reflective clothing, with men's apparel currently holding a larger share due to historical industry demographics, though the women's segment is experiencing faster growth. By type, T-shirts, coats, and pants represent the dominant categories, catering to various functional and weather-related needs.
Emerging trends such as the integration of smart technologies into reflective clothing, offering enhanced safety features and connectivity, are also contributing to market expansion. The development of more aesthetically pleasing and less bulky reflective garments is further broadening consumer acceptance beyond purely industrial applications, extending into activewear and outdoor recreational use. However, the market faces certain restraints, including the initial higher cost of high-quality reflective materials and the potential for counterfeit products that compromise safety standards. Despite these challenges, the market is expected to witness sustained demand, driven by continuous technological innovation and a persistent focus on workplace and public safety. Key companies such as Ergodyne, ML Kishigo, Honeywell, and Portwest are actively innovating and expanding their product portfolios to capture market share, further solidifying the growth trajectory of the reflective clothing industry globally.
Reflective Clothes Market Concentration & Innovation
The global reflective clothing market exhibits a moderate concentration, with key players like Ergodyne, ML Kishigo, Honeywell, National Safety Apparel, 3A Safety Groups, Portwest, Zhejiang Shunfa Reflective Clothing, Red Kap, Reflective Apparel Factory, GSS Safety, Carhartt, Sportex Safety, Lakeland, Protective Industrial Products, Pyramex Safety Products, and Viking driving innovation and market share. While no single entity commands a dominant majority, the top ten companies collectively hold approximately 65% of the market. Innovation is primarily fueled by advancements in retroreflective technology, leading to enhanced visibility and durability. Regulatory frameworks, such as EN ISO 20471 and ANSI/ISEA 107, mandate the use of high-visibility protective clothing in various industries, significantly boosting demand. Product substitutes, while present in the form of basic high-visibility vests, lack the comprehensive protection and integrated reflective properties of specialized reflective garments. End-user trends are shifting towards more comfortable, breathable, and fashion-conscious reflective apparel, particularly in the outdoor recreation and industrial safety sectors. Merger and acquisition (M&A) activities have been relatively subdued, with an estimated total deal value of around $300 million over the historical period (2019-2024), primarily involving smaller regional players acquiring niche technologies or expanding their distribution networks.
Reflective Clothes Industry Trends & Insights
The reflective clothes industry is poised for substantial growth, driven by an escalating emphasis on worker safety across diverse sectors. The global market is projected to expand at a Compound Annual Growth Rate (CAGR) of approximately 7.8% from 2025 to 2033, reaching an estimated market size of over $6,500 million by the end of the forecast period. This robust growth is underpinned by several key trends. Firstly, increasing government regulations and stringent occupational safety standards worldwide are mandating the use of high-visibility apparel, particularly in hazardous environments such as construction, roadwork, mining, and emergency services. The adoption rate of reflective clothing in these sectors is projected to reach over 85% by 2028.
Technological advancements are revolutionizing the reflective clothing landscape. Innovations in material science have led to the development of lighter, more durable, and breathable fabrics that incorporate advanced retroreflective materials. These materials offer superior light reflection even in low-light and adverse weather conditions, significantly enhancing wearer visibility. The integration of smart technologies, such as embedded LED lights and RFID tags for tracking, is also emerging as a disruptive trend, offering enhanced safety and operational efficiency.
Consumer preferences are evolving beyond mere functionality. There's a growing demand for reflective clothing that is not only safe but also comfortable, ergonomic, and aesthetically pleasing. This is driving manufacturers to offer a wider range of styles, fits, and colors, catering to both male and female wearers across various applications, including industrial work, cycling, running, and outdoor adventures. The market penetration of specialized reflective apparel for niche applications like sports and leisure activities is expected to double by 2030.
Competitive dynamics are characterized by a mix of established global players and emerging regional manufacturers. The market is witnessing increased competition based on product quality, innovation, price, and distribution reach. Companies are focusing on developing sustainable and eco-friendly reflective clothing options to appeal to environmentally conscious consumers and meet emerging corporate social responsibility initiatives. Supply chain resilience and efficient distribution networks are becoming critical success factors in this dynamic market.
Dominant Markets & Segments in Reflective Clothes
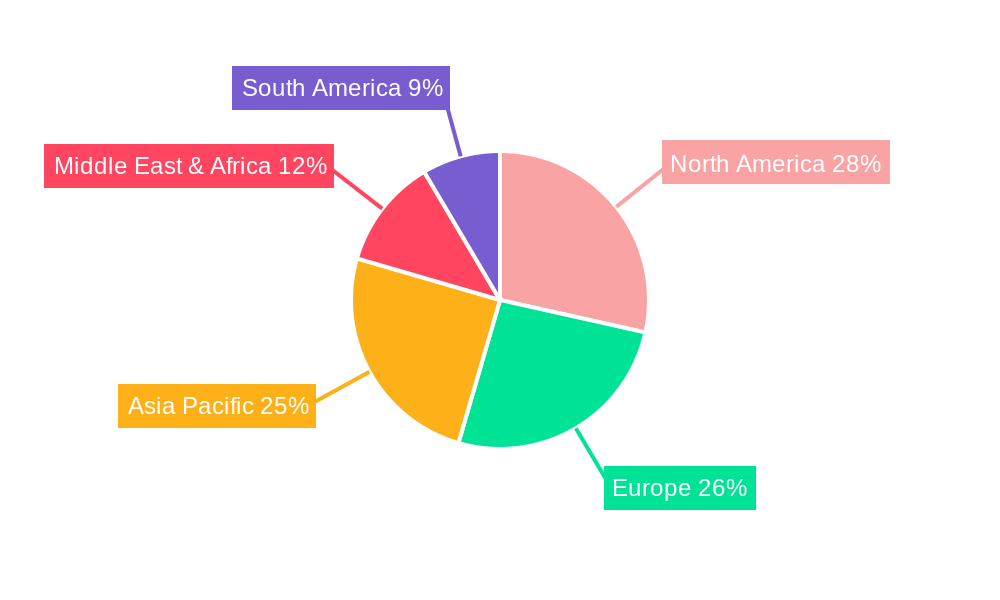
The reflective clothes market demonstrates significant regional dominance, with North America and Europe leading in terms of market share and adoption rates, primarily driven by robust regulatory frameworks and a strong emphasis on industrial safety.
Regional Dominance:
- North America: This region accounts for approximately 35% of the global reflective clothes market share. Key drivers include stringent OSHA regulations in the United States and similar safety standards in Canada, mandating high-visibility garments for workers in construction, transportation, and utilities. The robust infrastructure development projects and extensive road networks further amplify the demand for reflective safety wear. The market size in North America is estimated to reach over $2,200 million by 2033.
- Europe: Holding around 30% of the global market, Europe's dominance is fueled by harmonized safety directives like EN ISO 20471, which are widely implemented across member states. The presence of a large industrial base, active road maintenance programs, and a growing cycling culture contribute to sustained demand. The estimated market size in Europe is projected to be over $1,900 million by 2033.
- Asia-Pacific: This region is the fastest-growing market, with a projected CAGR of 9.2% during the forecast period. Increasing industrialization, infrastructure investments in countries like China and India, and a growing awareness of workplace safety are key contributors. The market size is expected to reach over $1,500 million by 2033.
Dominant Segments:
- Application: The Man segment represents the largest share, estimated at over 70% of the market, due to the historically higher participation of men in traditionally male-dominated hazardous industries. However, the Woman segment is experiencing a faster growth rate, driven by increasing female participation in these sectors and a demand for specifically designed, comfortable, and well-fitting reflective apparel.
- Types: The Coat segment holds the largest market share, estimated at approximately 40%, due to its comprehensive coverage and suitability for various weather conditions, particularly in outdoor industrial settings. Pants constitute another significant segment, estimated at 25%, often used in conjunction with jackets or vests for full-body protection. T-shirts and other lighter garments like vests and accessories are gaining traction, especially in warmer climates and for specific activities like cycling and running, representing an estimated 35% combined share and experiencing considerable growth. The market size for Coats is projected to exceed $2,600 million, while Pants are estimated to reach over $1,600 million, and T-shirts and Others will collectively exceed $2,200 million by 2033.
Reflective Clothes Product Developments
Reflective clothing product development is characterized by a relentless pursuit of enhanced visibility, comfort, and durability. Innovations include the integration of advanced retroreflective materials with superior light-reflecting capabilities, even in extreme low-light conditions. Manufacturers are focusing on breathable, moisture-wicking fabrics that improve wearer comfort during physical exertion. Furthermore, the introduction of lightweight, flexible designs, and ergonomic fits are enhancing user acceptance. Competitive advantages are being gained through the development of specialized garments for niche applications, such as sports and outdoor recreation, and through the incorporation of smart features like embedded LEDs for active visibility.
Report Scope & Segmentation Analysis
This report provides a comprehensive analysis of the global reflective clothes market, segmenting it by application and product type to offer detailed insights into market dynamics and growth opportunities. The market is segmented into Man and Woman for application, with the male segment currently dominating due to historical industry participation but the female segment exhibiting strong growth potential.
In terms of product types, the market is analyzed across T-shirt, Coat, Pants, and Others (including vests, accessories, and specialized wear). Coats represent a substantial market share due to their protective capabilities in various environments. Pants are also a key segment, often complementing upper body wear. T-shirts and other lighter options are witnessing increased adoption, particularly in warmer climates and for recreational activities. Growth projections indicate that all segments will experience positive expansion, with the Woman application segment and the T-shirt and Others product segments anticipated to grow at higher CAGRs.
Key Drivers of Reflective Clothes Growth
The global reflective clothes market is propelled by a confluence of significant growth drivers. Primarily, the escalating global focus on worker safety and stringent occupational health regulations across industries like construction, transportation, and manufacturing are mandating the use of high-visibility apparel. For instance, updated ANSI/ISEA standards are continuously driving demand for certified reflective garments. Technological advancements in retroreflective materials, leading to enhanced durability and brightness, also play a crucial role, making garments more effective in low-light conditions. Furthermore, increasing government initiatives and awareness campaigns promoting workplace safety are significantly boosting the adoption of reflective clothing. The growing participation of women in traditionally male-dominated industries is also a key driver, fostering demand for gender-specific, comfortable, and functional reflective wear. The projected market size for these drivers is estimated to contribute over $5,000 million in cumulative growth.
Challenges in the Reflective Clothes Sector
Despite the robust growth prospects, the reflective clothes sector faces several challenges that can impede its expansion. Regulatory hurdles, particularly the need for continuous compliance with evolving international and national safety standards, can be costly and complex for manufacturers. Supply chain disruptions, exacerbated by geopolitical events and material sourcing complexities, can lead to increased production costs and lead times, impacting affordability and availability. Intense competition from both established global brands and emerging regional players drives price pressures, potentially squeezing profit margins. Furthermore, the counterfeiting of reflective safety garments poses a significant threat, undermining brand reputation and consumer trust, with an estimated impact of around $500 million in lost revenue.
Emerging Opportunities in Reflective Clothes
The reflective clothes market is ripe with emerging opportunities driven by evolving consumer needs and technological advancements. The burgeoning popularity of outdoor recreational activities like cycling, running, and hiking presents a significant opportunity for high-performance, fashion-forward reflective apparel. The integration of smart technologies, such as embedded LEDs for active visibility and connectivity features, is another exciting frontier. Furthermore, the growing demand for sustainable and eco-friendly reflective clothing, utilizing recycled materials and environmentally conscious manufacturing processes, aligns with global sustainability trends. The development of specialized reflective wear for children, enhancing their visibility during school commutes and outdoor play, also represents an untapped market segment. The projected market size for these emerging opportunities is estimated to exceed $1,000 million.
Leading Players in the Reflective Clothes Market
- Ergodyne
- ML Kishigo
- Honeywell
- National Safety Apparel
- 3A Safety Groups
- Portwest
- Zhejiang Shunfa Reflective Clothing
- Red Kap
- Reflective Apparel Factory
- GSS Safety
- Carhartt
- Sportex Safety
- Lakeland
- Protective Industrial Products
- Pyramex Safety Products
- Viking
Key Developments in Reflective Clothes Industry
- 2023: ML Kishigo launched a new line of advanced, breathable reflective jackets incorporating enhanced fluorescent properties for superior daytime visibility.
- 2023: Honeywell introduced a smart reflective vest with integrated GPS tracking capabilities for enhanced worker safety and location monitoring in remote work sites.
- 2022: Portwest expanded its sustainable reflective clothing range using recycled polyester materials, responding to growing environmental concerns.
- 2022: GSS Safety partnered with a leading textile innovator to develop a new generation of abrasion-resistant and highly reflective fabrics.
- 2021: Ergodyne acquired a specialized reflective material manufacturer, bolstering its vertical integration and innovation capabilities.
- 2020: National Safety Apparel introduced a range of women-specific reflective workwear designed for improved fit and comfort.
Strategic Outlook for Reflective Clothes Market
The strategic outlook for the reflective clothes market remains exceptionally positive, driven by an unwavering commitment to worker safety and ongoing technological advancements. Future growth catalysts will include the continued evolution of smart reflective clothing, offering integrated digital capabilities, and the increasing demand for sustainable and ethically produced garments. Manufacturers who can successfully innovate in terms of material science, design ergonomics, and environmentally friendly practices are best positioned for success. The expansion into emerging markets and the catering to niche applications like sports and outdoor recreation will also be critical for sustained market leadership, promising a continued upward trajectory for the industry, with an estimated growth potential of over $2,000 million in the coming years.
Reflective Clothes Segmentation
-
1. Application
- 1.1. Man
- 1.2. Woman
-
2. Types
- 2.1. T-shirt
- 2.2. Coat
- 2.3. Pants
- 2.4. Others
Reflective Clothes Segmentation By Geography
-
1. North America
- 1.1. United States
- 1.2. Canada
- 1.3. Mexico
-
2. South America
- 2.1. Brazil
- 2.2. Argentina
- 2.3. Rest of South America
-
3. Europe
- 3.1. United Kingdom
- 3.2. Germany
- 3.3. France
- 3.4. Italy
- 3.5. Spain
- 3.6. Russia
- 3.7. Benelux
- 3.8. Nordics
- 3.9. Rest of Europe
-
4. Middle East & Africa
- 4.1. Turkey
- 4.2. Israel
- 4.3. GCC
- 4.4. North Africa
- 4.5. South Africa
- 4.6. Rest of Middle East & Africa
-
5. Asia Pacific
- 5.1. China
- 5.2. India
- 5.3. Japan
- 5.4. South Korea
- 5.5. ASEAN
- 5.6. Oceania
- 5.7. Rest of Asia Pacific
Reflective Clothes REPORT HIGHLIGHTS
| Aspects | Details |
|---|---|
| Study Period | 2019-2033 |
| Base Year | 2024 |
| Estimated Year | 2025 |
| Forecast Period | 2025-2033 |
| Historical Period | 2019-2024 |
| Growth Rate | CAGR of XX% from 2019-2033 |
| Segmentation |
|
Table of Contents
- 1. Introduction
- 1.1. Research Scope
- 1.2. Market Segmentation
- 1.3. Research Methodology
- 1.4. Definitions and Assumptions
- 2. Executive Summary
- 2.1. Introduction
- 3. Market Dynamics
- 3.1. Introduction
- 3.2. Market Drivers
- 3.3. Market Restrains
- 3.4. Market Trends
- 4. Market Factor Analysis
- 4.1. Porters Five Forces
- 4.2. Supply/Value Chain
- 4.3. PESTEL analysis
- 4.4. Market Entropy
- 4.5. Patent/Trademark Analysis
- 5. Global Reflective Clothes Analysis, Insights and Forecast, 2019-2031
- 5.1. Market Analysis, Insights and Forecast - by Application
- 5.1.1. Man
- 5.1.2. Woman
- 5.2. Market Analysis, Insights and Forecast - by Types
- 5.2.1. T-shirt
- 5.2.2. Coat
- 5.2.3. Pants
- 5.2.4. Others
- 5.3. Market Analysis, Insights and Forecast - by Region
- 5.3.1. North America
- 5.3.2. South America
- 5.3.3. Europe
- 5.3.4. Middle East & Africa
- 5.3.5. Asia Pacific
- 5.1. Market Analysis, Insights and Forecast - by Application
- 6. North America Reflective Clothes Analysis, Insights and Forecast, 2019-2031
- 6.1. Market Analysis, Insights and Forecast - by Application
- 6.1.1. Man
- 6.1.2. Woman
- 6.2. Market Analysis, Insights and Forecast - by Types
- 6.2.1. T-shirt
- 6.2.2. Coat
- 6.2.3. Pants
- 6.2.4. Others
- 6.1. Market Analysis, Insights and Forecast - by Application
- 7. South America Reflective Clothes Analysis, Insights and Forecast, 2019-2031
- 7.1. Market Analysis, Insights and Forecast - by Application
- 7.1.1. Man
- 7.1.2. Woman
- 7.2. Market Analysis, Insights and Forecast - by Types
- 7.2.1. T-shirt
- 7.2.2. Coat
- 7.2.3. Pants
- 7.2.4. Others
- 7.1. Market Analysis, Insights and Forecast - by Application
- 8. Europe Reflective Clothes Analysis, Insights and Forecast, 2019-2031
- 8.1. Market Analysis, Insights and Forecast - by Application
- 8.1.1. Man
- 8.1.2. Woman
- 8.2. Market Analysis, Insights and Forecast - by Types
- 8.2.1. T-shirt
- 8.2.2. Coat
- 8.2.3. Pants
- 8.2.4. Others
- 8.1. Market Analysis, Insights and Forecast - by Application
- 9. Middle East & Africa Reflective Clothes Analysis, Insights and Forecast, 2019-2031
- 9.1. Market Analysis, Insights and Forecast - by Application
- 9.1.1. Man
- 9.1.2. Woman
- 9.2. Market Analysis, Insights and Forecast - by Types
- 9.2.1. T-shirt
- 9.2.2. Coat
- 9.2.3. Pants
- 9.2.4. Others
- 9.1. Market Analysis, Insights and Forecast - by Application
- 10. Asia Pacific Reflective Clothes Analysis, Insights and Forecast, 2019-2031
- 10.1. Market Analysis, Insights and Forecast - by Application
- 10.1.1. Man
- 10.1.2. Woman
- 10.2. Market Analysis, Insights and Forecast - by Types
- 10.2.1. T-shirt
- 10.2.2. Coat
- 10.2.3. Pants
- 10.2.4. Others
- 10.1. Market Analysis, Insights and Forecast - by Application
- 11. Competitive Analysis
- 11.1. Global Market Share Analysis 2024
- 11.2. Company Profiles
- 11.2.1 Ergodyne
- 11.2.1.1. Overview
- 11.2.1.2. Products
- 11.2.1.3. SWOT Analysis
- 11.2.1.4. Recent Developments
- 11.2.1.5. Financials (Based on Availability)
- 11.2.2 ML Kishigo
- 11.2.2.1. Overview
- 11.2.2.2. Products
- 11.2.2.3. SWOT Analysis
- 11.2.2.4. Recent Developments
- 11.2.2.5. Financials (Based on Availability)
- 11.2.3 Honeywell
- 11.2.3.1. Overview
- 11.2.3.2. Products
- 11.2.3.3. SWOT Analysis
- 11.2.3.4. Recent Developments
- 11.2.3.5. Financials (Based on Availability)
- 11.2.4 National Safety Apparel
- 11.2.4.1. Overview
- 11.2.4.2. Products
- 11.2.4.3. SWOT Analysis
- 11.2.4.4. Recent Developments
- 11.2.4.5. Financials (Based on Availability)
- 11.2.5 3A Safety Groups
- 11.2.5.1. Overview
- 11.2.5.2. Products
- 11.2.5.3. SWOT Analysis
- 11.2.5.4. Recent Developments
- 11.2.5.5. Financials (Based on Availability)
- 11.2.6 Portwest
- 11.2.6.1. Overview
- 11.2.6.2. Products
- 11.2.6.3. SWOT Analysis
- 11.2.6.4. Recent Developments
- 11.2.6.5. Financials (Based on Availability)
- 11.2.7 Zhejiang Shunfa Reflective Clothing
- 11.2.7.1. Overview
- 11.2.7.2. Products
- 11.2.7.3. SWOT Analysis
- 11.2.7.4. Recent Developments
- 11.2.7.5. Financials (Based on Availability)
- 11.2.8 Red Kap
- 11.2.8.1. Overview
- 11.2.8.2. Products
- 11.2.8.3. SWOT Analysis
- 11.2.8.4. Recent Developments
- 11.2.8.5. Financials (Based on Availability)
- 11.2.9 Reflective Apparel Factory
- 11.2.9.1. Overview
- 11.2.9.2. Products
- 11.2.9.3. SWOT Analysis
- 11.2.9.4. Recent Developments
- 11.2.9.5. Financials (Based on Availability)
- 11.2.10 GSS Safety
- 11.2.10.1. Overview
- 11.2.10.2. Products
- 11.2.10.3. SWOT Analysis
- 11.2.10.4. Recent Developments
- 11.2.10.5. Financials (Based on Availability)
- 11.2.11 Carhartt
- 11.2.11.1. Overview
- 11.2.11.2. Products
- 11.2.11.3. SWOT Analysis
- 11.2.11.4. Recent Developments
- 11.2.11.5. Financials (Based on Availability)
- 11.2.12 Sportex Safety
- 11.2.12.1. Overview
- 11.2.12.2. Products
- 11.2.12.3. SWOT Analysis
- 11.2.12.4. Recent Developments
- 11.2.12.5. Financials (Based on Availability)
- 11.2.13 Lakeland
- 11.2.13.1. Overview
- 11.2.13.2. Products
- 11.2.13.3. SWOT Analysis
- 11.2.13.4. Recent Developments
- 11.2.13.5. Financials (Based on Availability)
- 11.2.14 Protective Industrial Products
- 11.2.14.1. Overview
- 11.2.14.2. Products
- 11.2.14.3. SWOT Analysis
- 11.2.14.4. Recent Developments
- 11.2.14.5. Financials (Based on Availability)
- 11.2.15 Pyramex Safety Products
- 11.2.15.1. Overview
- 11.2.15.2. Products
- 11.2.15.3. SWOT Analysis
- 11.2.15.4. Recent Developments
- 11.2.15.5. Financials (Based on Availability)
- 11.2.16 Viking
- 11.2.16.1. Overview
- 11.2.16.2. Products
- 11.2.16.3. SWOT Analysis
- 11.2.16.4. Recent Developments
- 11.2.16.5. Financials (Based on Availability)
- 11.2.1 Ergodyne
List of Figures
- Figure 1: Global Reflective Clothes Revenue Breakdown (million, %) by Region 2024 & 2032
- Figure 2: Global Reflective Clothes Volume Breakdown (K, %) by Region 2024 & 2032
- Figure 3: North America Reflective Clothes Revenue (million), by Application 2024 & 2032
- Figure 4: North America Reflective Clothes Volume (K), by Application 2024 & 2032
- Figure 5: North America Reflective Clothes Revenue Share (%), by Application 2024 & 2032
- Figure 6: North America Reflective Clothes Volume Share (%), by Application 2024 & 2032
- Figure 7: North America Reflective Clothes Revenue (million), by Types 2024 & 2032
- Figure 8: North America Reflective Clothes Volume (K), by Types 2024 & 2032
- Figure 9: North America Reflective Clothes Revenue Share (%), by Types 2024 & 2032
- Figure 10: North America Reflective Clothes Volume Share (%), by Types 2024 & 2032
- Figure 11: North America Reflective Clothes Revenue (million), by Country 2024 & 2032
- Figure 12: North America Reflective Clothes Volume (K), by Country 2024 & 2032
- Figure 13: North America Reflective Clothes Revenue Share (%), by Country 2024 & 2032
- Figure 14: North America Reflective Clothes Volume Share (%), by Country 2024 & 2032
- Figure 15: South America Reflective Clothes Revenue (million), by Application 2024 & 2032
- Figure 16: South America Reflective Clothes Volume (K), by Application 2024 & 2032
- Figure 17: South America Reflective Clothes Revenue Share (%), by Application 2024 & 2032
- Figure 18: South America Reflective Clothes Volume Share (%), by Application 2024 & 2032
- Figure 19: South America Reflective Clothes Revenue (million), by Types 2024 & 2032
- Figure 20: South America Reflective Clothes Volume (K), by Types 2024 & 2032
- Figure 21: South America Reflective Clothes Revenue Share (%), by Types 2024 & 2032
- Figure 22: South America Reflective Clothes Volume Share (%), by Types 2024 & 2032
- Figure 23: South America Reflective Clothes Revenue (million), by Country 2024 & 2032
- Figure 24: South America Reflective Clothes Volume (K), by Country 2024 & 2032
- Figure 25: South America Reflective Clothes Revenue Share (%), by Country 2024 & 2032
- Figure 26: South America Reflective Clothes Volume Share (%), by Country 2024 & 2032
- Figure 27: Europe Reflective Clothes Revenue (million), by Application 2024 & 2032
- Figure 28: Europe Reflective Clothes Volume (K), by Application 2024 & 2032
- Figure 29: Europe Reflective Clothes Revenue Share (%), by Application 2024 & 2032
- Figure 30: Europe Reflective Clothes Volume Share (%), by Application 2024 & 2032
- Figure 31: Europe Reflective Clothes Revenue (million), by Types 2024 & 2032
- Figure 32: Europe Reflective Clothes Volume (K), by Types 2024 & 2032
- Figure 33: Europe Reflective Clothes Revenue Share (%), by Types 2024 & 2032
- Figure 34: Europe Reflective Clothes Volume Share (%), by Types 2024 & 2032
- Figure 35: Europe Reflective Clothes Revenue (million), by Country 2024 & 2032
- Figure 36: Europe Reflective Clothes Volume (K), by Country 2024 & 2032
- Figure 37: Europe Reflective Clothes Revenue Share (%), by Country 2024 & 2032
- Figure 38: Europe Reflective Clothes Volume Share (%), by Country 2024 & 2032
- Figure 39: Middle East & Africa Reflective Clothes Revenue (million), by Application 2024 & 2032
- Figure 40: Middle East & Africa Reflective Clothes Volume (K), by Application 2024 & 2032
- Figure 41: Middle East & Africa Reflective Clothes Revenue Share (%), by Application 2024 & 2032
- Figure 42: Middle East & Africa Reflective Clothes Volume Share (%), by Application 2024 & 2032
- Figure 43: Middle East & Africa Reflective Clothes Revenue (million), by Types 2024 & 2032
- Figure 44: Middle East & Africa Reflective Clothes Volume (K), by Types 2024 & 2032
- Figure 45: Middle East & Africa Reflective Clothes Revenue Share (%), by Types 2024 & 2032
- Figure 46: Middle East & Africa Reflective Clothes Volume Share (%), by Types 2024 & 2032
- Figure 47: Middle East & Africa Reflective Clothes Revenue (million), by Country 2024 & 2032
- Figure 48: Middle East & Africa Reflective Clothes Volume (K), by Country 2024 & 2032
- Figure 49: Middle East & Africa Reflective Clothes Revenue Share (%), by Country 2024 & 2032
- Figure 50: Middle East & Africa Reflective Clothes Volume Share (%), by Country 2024 & 2032
- Figure 51: Asia Pacific Reflective Clothes Revenue (million), by Application 2024 & 2032
- Figure 52: Asia Pacific Reflective Clothes Volume (K), by Application 2024 & 2032
- Figure 53: Asia Pacific Reflective Clothes Revenue Share (%), by Application 2024 & 2032
- Figure 54: Asia Pacific Reflective Clothes Volume Share (%), by Application 2024 & 2032
- Figure 55: Asia Pacific Reflective Clothes Revenue (million), by Types 2024 & 2032
- Figure 56: Asia Pacific Reflective Clothes Volume (K), by Types 2024 & 2032
- Figure 57: Asia Pacific Reflective Clothes Revenue Share (%), by Types 2024 & 2032
- Figure 58: Asia Pacific Reflective Clothes Volume Share (%), by Types 2024 & 2032
- Figure 59: Asia Pacific Reflective Clothes Revenue (million), by Country 2024 & 2032
- Figure 60: Asia Pacific Reflective Clothes Volume (K), by Country 2024 & 2032
- Figure 61: Asia Pacific Reflective Clothes Revenue Share (%), by Country 2024 & 2032
- Figure 62: Asia Pacific Reflective Clothes Volume Share (%), by Country 2024 & 2032
List of Tables
- Table 1: Global Reflective Clothes Revenue million Forecast, by Region 2019 & 2032
- Table 2: Global Reflective Clothes Volume K Forecast, by Region 2019 & 2032
- Table 3: Global Reflective Clothes Revenue million Forecast, by Application 2019 & 2032
- Table 4: Global Reflective Clothes Volume K Forecast, by Application 2019 & 2032
- Table 5: Global Reflective Clothes Revenue million Forecast, by Types 2019 & 2032
- Table 6: Global Reflective Clothes Volume K Forecast, by Types 2019 & 2032
- Table 7: Global Reflective Clothes Revenue million Forecast, by Region 2019 & 2032
- Table 8: Global Reflective Clothes Volume K Forecast, by Region 2019 & 2032
- Table 9: Global Reflective Clothes Revenue million Forecast, by Application 2019 & 2032
- Table 10: Global Reflective Clothes Volume K Forecast, by Application 2019 & 2032
- Table 11: Global Reflective Clothes Revenue million Forecast, by Types 2019 & 2032
- Table 12: Global Reflective Clothes Volume K Forecast, by Types 2019 & 2032
- Table 13: Global Reflective Clothes Revenue million Forecast, by Country 2019 & 2032
- Table 14: Global Reflective Clothes Volume K Forecast, by Country 2019 & 2032
- Table 15: United States Reflective Clothes Revenue (million) Forecast, by Application 2019 & 2032
- Table 16: United States Reflective Clothes Volume (K) Forecast, by Application 2019 & 2032
- Table 17: Canada Reflective Clothes Revenue (million) Forecast, by Application 2019 & 2032
- Table 18: Canada Reflective Clothes Volume (K) Forecast, by Application 2019 & 2032
- Table 19: Mexico Reflective Clothes Revenue (million) Forecast, by Application 2019 & 2032
- Table 20: Mexico Reflective Clothes Volume (K) Forecast, by Application 2019 & 2032
- Table 21: Global Reflective Clothes Revenue million Forecast, by Application 2019 & 2032
- Table 22: Global Reflective Clothes Volume K Forecast, by Application 2019 & 2032
- Table 23: Global Reflective Clothes Revenue million Forecast, by Types 2019 & 2032
- Table 24: Global Reflective Clothes Volume K Forecast, by Types 2019 & 2032
- Table 25: Global Reflective Clothes Revenue million Forecast, by Country 2019 & 2032
- Table 26: Global Reflective Clothes Volume K Forecast, by Country 2019 & 2032
- Table 27: Brazil Reflective Clothes Revenue (million) Forecast, by Application 2019 & 2032
- Table 28: Brazil Reflective Clothes Volume (K) Forecast, by Application 2019 & 2032
- Table 29: Argentina Reflective Clothes Revenue (million) Forecast, by Application 2019 & 2032
- Table 30: Argentina Reflective Clothes Volume (K) Forecast, by Application 2019 & 2032
- Table 31: Rest of South America Reflective Clothes Revenue (million) Forecast, by Application 2019 & 2032
- Table 32: Rest of South America Reflective Clothes Volume (K) Forecast, by Application 2019 & 2032
- Table 33: Global Reflective Clothes Revenue million Forecast, by Application 2019 & 2032
- Table 34: Global Reflective Clothes Volume K Forecast, by Application 2019 & 2032
- Table 35: Global Reflective Clothes Revenue million Forecast, by Types 2019 & 2032
- Table 36: Global Reflective Clothes Volume K Forecast, by Types 2019 & 2032
- Table 37: Global Reflective Clothes Revenue million Forecast, by Country 2019 & 2032
- Table 38: Global Reflective Clothes Volume K Forecast, by Country 2019 & 2032
- Table 39: United Kingdom Reflective Clothes Revenue (million) Forecast, by Application 2019 & 2032
- Table 40: United Kingdom Reflective Clothes Volume (K) Forecast, by Application 2019 & 2032
- Table 41: Germany Reflective Clothes Revenue (million) Forecast, by Application 2019 & 2032
- Table 42: Germany Reflective Clothes Volume (K) Forecast, by Application 2019 & 2032
- Table 43: France Reflective Clothes Revenue (million) Forecast, by Application 2019 & 2032
- Table 44: France Reflective Clothes Volume (K) Forecast, by Application 2019 & 2032
- Table 45: Italy Reflective Clothes Revenue (million) Forecast, by Application 2019 & 2032
- Table 46: Italy Reflective Clothes Volume (K) Forecast, by Application 2019 & 2032
- Table 47: Spain Reflective Clothes Revenue (million) Forecast, by Application 2019 & 2032
- Table 48: Spain Reflective Clothes Volume (K) Forecast, by Application 2019 & 2032
- Table 49: Russia Reflective Clothes Revenue (million) Forecast, by Application 2019 & 2032
- Table 50: Russia Reflective Clothes Volume (K) Forecast, by Application 2019 & 2032
- Table 51: Benelux Reflective Clothes Revenue (million) Forecast, by Application 2019 & 2032
- Table 52: Benelux Reflective Clothes Volume (K) Forecast, by Application 2019 & 2032
- Table 53: Nordics Reflective Clothes Revenue (million) Forecast, by Application 2019 & 2032
- Table 54: Nordics Reflective Clothes Volume (K) Forecast, by Application 2019 & 2032
- Table 55: Rest of Europe Reflective Clothes Revenue (million) Forecast, by Application 2019 & 2032
- Table 56: Rest of Europe Reflective Clothes Volume (K) Forecast, by Application 2019 & 2032
- Table 57: Global Reflective Clothes Revenue million Forecast, by Application 2019 & 2032
- Table 58: Global Reflective Clothes Volume K Forecast, by Application 2019 & 2032
- Table 59: Global Reflective Clothes Revenue million Forecast, by Types 2019 & 2032
- Table 60: Global Reflective Clothes Volume K Forecast, by Types 2019 & 2032
- Table 61: Global Reflective Clothes Revenue million Forecast, by Country 2019 & 2032
- Table 62: Global Reflective Clothes Volume K Forecast, by Country 2019 & 2032
- Table 63: Turkey Reflective Clothes Revenue (million) Forecast, by Application 2019 & 2032
- Table 64: Turkey Reflective Clothes Volume (K) Forecast, by Application 2019 & 2032
- Table 65: Israel Reflective Clothes Revenue (million) Forecast, by Application 2019 & 2032
- Table 66: Israel Reflective Clothes Volume (K) Forecast, by Application 2019 & 2032
- Table 67: GCC Reflective Clothes Revenue (million) Forecast, by Application 2019 & 2032
- Table 68: GCC Reflective Clothes Volume (K) Forecast, by Application 2019 & 2032
- Table 69: North Africa Reflective Clothes Revenue (million) Forecast, by Application 2019 & 2032
- Table 70: North Africa Reflective Clothes Volume (K) Forecast, by Application 2019 & 2032
- Table 71: South Africa Reflective Clothes Revenue (million) Forecast, by Application 2019 & 2032
- Table 72: South Africa Reflective Clothes Volume (K) Forecast, by Application 2019 & 2032
- Table 73: Rest of Middle East & Africa Reflective Clothes Revenue (million) Forecast, by Application 2019 & 2032
- Table 74: Rest of Middle East & Africa Reflective Clothes Volume (K) Forecast, by Application 2019 & 2032
- Table 75: Global Reflective Clothes Revenue million Forecast, by Application 2019 & 2032
- Table 76: Global Reflective Clothes Volume K Forecast, by Application 2019 & 2032
- Table 77: Global Reflective Clothes Revenue million Forecast, by Types 2019 & 2032
- Table 78: Global Reflective Clothes Volume K Forecast, by Types 2019 & 2032
- Table 79: Global Reflective Clothes Revenue million Forecast, by Country 2019 & 2032
- Table 80: Global Reflective Clothes Volume K Forecast, by Country 2019 & 2032
- Table 81: China Reflective Clothes Revenue (million) Forecast, by Application 2019 & 2032
- Table 82: China Reflective Clothes Volume (K) Forecast, by Application 2019 & 2032
- Table 83: India Reflective Clothes Revenue (million) Forecast, by Application 2019 & 2032
- Table 84: India Reflective Clothes Volume (K) Forecast, by Application 2019 & 2032
- Table 85: Japan Reflective Clothes Revenue (million) Forecast, by Application 2019 & 2032
- Table 86: Japan Reflective Clothes Volume (K) Forecast, by Application 2019 & 2032
- Table 87: South Korea Reflective Clothes Revenue (million) Forecast, by Application 2019 & 2032
- Table 88: South Korea Reflective Clothes Volume (K) Forecast, by Application 2019 & 2032
- Table 89: ASEAN Reflective Clothes Revenue (million) Forecast, by Application 2019 & 2032
- Table 90: ASEAN Reflective Clothes Volume (K) Forecast, by Application 2019 & 2032
- Table 91: Oceania Reflective Clothes Revenue (million) Forecast, by Application 2019 & 2032
- Table 92: Oceania Reflective Clothes Volume (K) Forecast, by Application 2019 & 2032
- Table 93: Rest of Asia Pacific Reflective Clothes Revenue (million) Forecast, by Application 2019 & 2032
- Table 94: Rest of Asia Pacific Reflective Clothes Volume (K) Forecast, by Application 2019 & 2032
Frequently Asked Questions
1. What is the projected Compound Annual Growth Rate (CAGR) of the Reflective Clothes?
The projected CAGR is approximately XX%.
2. Which companies are prominent players in the Reflective Clothes?
Key companies in the market include Ergodyne, ML Kishigo, Honeywell, National Safety Apparel, 3A Safety Groups, Portwest, Zhejiang Shunfa Reflective Clothing, Red Kap, Reflective Apparel Factory, GSS Safety, Carhartt, Sportex Safety, Lakeland, Protective Industrial Products, Pyramex Safety Products, Viking.
3. What are the main segments of the Reflective Clothes?
The market segments include Application, Types.
4. Can you provide details about the market size?
The market size is estimated to be USD XXX million as of 2022.
5. What are some drivers contributing to market growth?
N/A
6. What are the notable trends driving market growth?
N/A
7. Are there any restraints impacting market growth?
N/A
8. Can you provide examples of recent developments in the market?
N/A
9. What pricing options are available for accessing the report?
Pricing options include single-user, multi-user, and enterprise licenses priced at USD 3350.00, USD 5025.00, and USD 6700.00 respectively.
10. Is the market size provided in terms of value or volume?
The market size is provided in terms of value, measured in million and volume, measured in K.
11. Are there any specific market keywords associated with the report?
Yes, the market keyword associated with the report is "Reflective Clothes," which aids in identifying and referencing the specific market segment covered.
12. How do I determine which pricing option suits my needs best?
The pricing options vary based on user requirements and access needs. Individual users may opt for single-user licenses, while businesses requiring broader access may choose multi-user or enterprise licenses for cost-effective access to the report.
13. Are there any additional resources or data provided in the Reflective Clothes report?
While the report offers comprehensive insights, it's advisable to review the specific contents or supplementary materials provided to ascertain if additional resources or data are available.
14. How can I stay updated on further developments or reports in the Reflective Clothes?
To stay informed about further developments, trends, and reports in the Reflective Clothes, consider subscribing to industry newsletters, following relevant companies and organizations, or regularly checking reputable industry news sources and publications.
Methodology
Step 1 - Identification of Relevant Samples Size from Population Database


Step 2 - Approaches for Defining Global Market Size (Value, Volume* & Price*)

Note*: In applicable scenarios
Step 3 - Data Sources
Primary Research
- Web Analytics
- Survey Reports
- Research Institute
- Latest Research Reports
- Opinion Leaders
Secondary Research
- Annual Reports
- White Paper
- Latest Press Release
- Industry Association
- Paid Database
- Investor Presentations

Step 4 - Data Triangulation
Involves using different sources of information in order to increase the validity of a study
These sources are likely to be stakeholders in a program - participants, other researchers, program staff, other community members, and so on.
Then we put all data in single framework & apply various statistical tools to find out the dynamic on the market.
During the analysis stage, feedback from the stakeholder groups would be compared to determine areas of agreement as well as areas of divergence


