
Key Insights
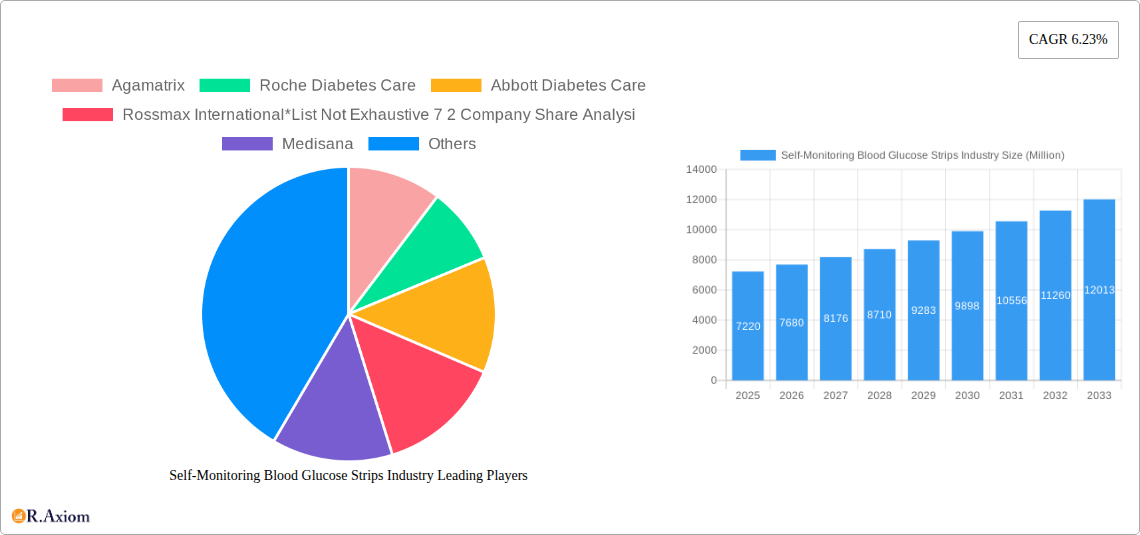
The self-monitoring blood glucose (SMBG) strips market, valued at $7.22 billion in 2025, is projected to experience robust growth, driven by the increasing prevalence of diabetes globally. A compound annual growth rate (CAGR) of 6.23% from 2025 to 2033 indicates a significant expansion of this market. Key growth drivers include the rising diabetic population, particularly in developing nations, coupled with an increasing preference for home-based blood glucose monitoring. Technological advancements in strip technology, leading to improved accuracy, convenience, and ease of use, also contribute significantly. Furthermore, the increasing awareness regarding diabetes management and the availability of affordable and reliable SMBG strips are fueling market expansion. The market is segmented into glucometer devices, test strips, and lancets, with test strips constituting a major portion of the market share due to their recurring consumption. Leading companies such as Abbott Diabetes Care, Roche Diabetes Care, and LifeScan are actively involved in research and development, driving innovation within the market, while also focusing on strategic partnerships and acquisitions to expand their global reach and market dominance. Regulatory approvals and stringent quality control measures are expected to influence market dynamics during the forecast period. Despite growth potential, challenges such as fluctuating raw material prices and the rising adoption of continuous glucose monitoring (CGM) systems may act as restraints.
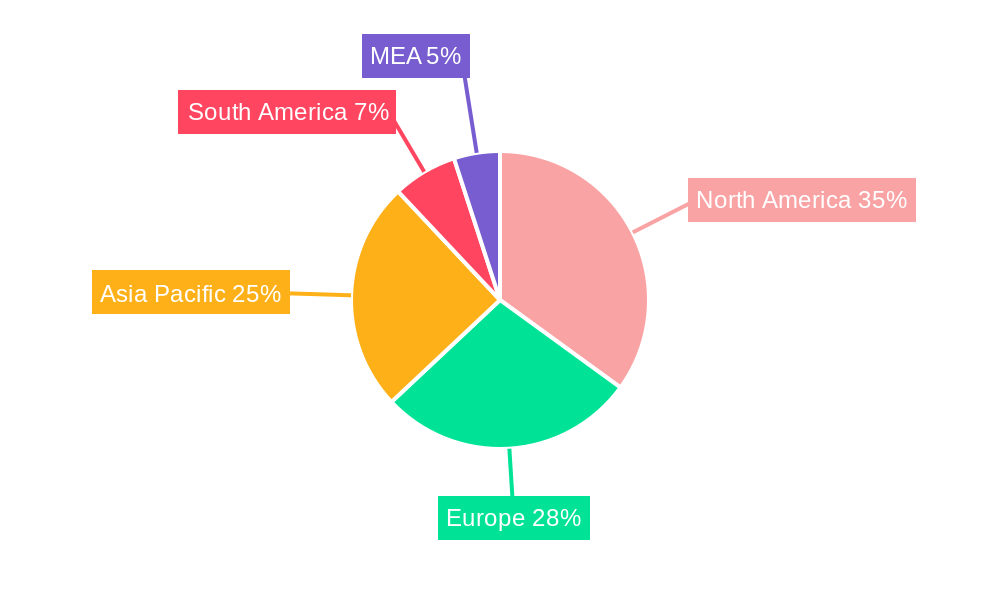
The regional distribution of the SMBG strips market reveals significant differences in growth potential. North America, currently holding a substantial market share, is expected to maintain its position due to the high prevalence of diabetes and advanced healthcare infrastructure. However, the Asia-Pacific region is expected to exhibit the most significant growth, fueled by rapidly rising diabetes cases and expanding access to healthcare services in emerging economies such as India and China. European markets are anticipated to witness steady growth, driven by increasing awareness and adoption of self-management techniques for diabetes. South America and the Middle East and Africa (MEA) regions are projected to experience moderate growth, largely influenced by factors such as healthcare infrastructure development and economic conditions. Competitive analysis reveals a landscape populated by both established players and emerging companies, leading to intense competition focused on product innovation, pricing strategies, and market penetration.
This detailed report provides a comprehensive analysis of the Self-Monitoring Blood Glucose Strips industry, offering invaluable insights for stakeholders, investors, and industry professionals. Covering the period 2019-2033, with a base year of 2025 and a forecast period of 2025-2033, this report delves into market dynamics, competitive landscapes, and future growth projections. The report uses Million for all values.
Self-Monitoring Blood Glucose Strips Industry Market Concentration & Innovation
This section analyzes the competitive landscape of the self-monitoring blood glucose strips industry, examining market concentration, innovation drivers, regulatory frameworks, and industry dynamics. The industry exhibits a moderately concentrated structure, with key players such as Agamatrix, Roche Diabetes Care, Abbott Diabetes Care, Rossmax International, Medisana, Acon, Bionime Corporation, Arkray, LifeScan, and Ascensia Diabetes Care holding significant market share. A 7-2 company share analysis reveals a combined market share of xx% for the top seven players. Innovation is driven by the need for improved accuracy, ease of use, and integration with digital health platforms. Regulatory frameworks, such as those implemented by the NHS in England, significantly influence product development and market access. The market also witnesses ongoing M&A activity, with deal values reaching xx Million in recent years. Product substitution is minimal, given the critical role of blood glucose monitoring in diabetes management. End-user trends show increasing preference for user-friendly devices with connectivity features.
- Market Concentration: Moderately concentrated, with top 7 players holding xx% market share.
- Innovation Drivers: Improved accuracy, ease of use, digital integration.
- Regulatory Frameworks: Significant impact on product development and market access (e.g., NHS England recommendations).
- M&A Activity: Deal values totaling xx Million in recent years.
- Product Substitutes: Minimal due to the critical role of blood glucose monitoring.
- End-User Trends: Preference for user-friendly and connected devices.
Self-Monitoring Blood Glucose Strips Industry Industry Trends & Insights
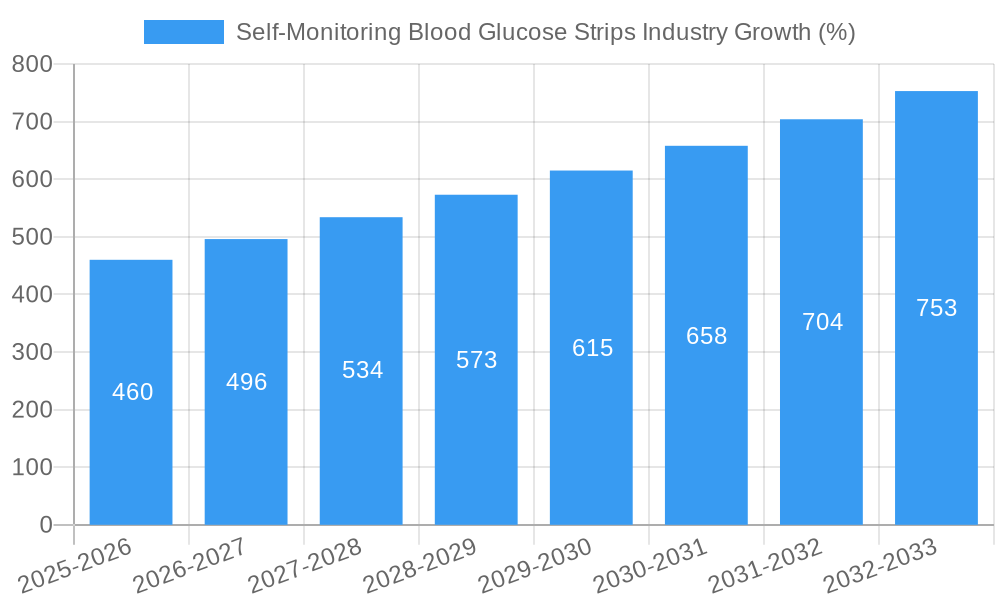
The self-monitoring blood glucose strips market is experiencing robust growth, driven by the increasing prevalence of diabetes globally. The market exhibits a CAGR of xx% during the historical period (2019-2024) and is projected to maintain a CAGR of xx% during the forecast period (2025-2033). Technological advancements, such as the integration of Bluetooth connectivity and smartphone apps, are transforming the industry. Consumer preferences are shifting towards convenient, accurate, and digitally integrated devices. Competitive dynamics are marked by continuous innovation, product differentiation, and strategic partnerships. Market penetration of advanced glucose monitoring systems is steadily increasing, with xx% market penetration estimated in 2025.
Dominant Markets & Segments in Self-Monitoring Blood Glucose Strips Industry
The North American region currently holds the dominant position in the self-monitoring blood glucose strips market, driven by factors such as high diabetes prevalence, advanced healthcare infrastructure, and strong regulatory support. Within the component segments, test strips constitute the largest segment, owing to the recurring need for consumables. Key drivers include:
- North America: High diabetes prevalence, advanced healthcare infrastructure, robust regulatory support.
- Test Strips Segment: Recurring consumption needs for diabetes management.
- Glucometer Devices Segment: Technological advancements, increased demand for advanced features.
- Lancets: Essential component, driving steady market growth.
The dominance of North America is attributable to several factors, including high diabetes prevalence, advanced healthcare infrastructure, and strong regulatory support for diabetes management. The significant market share of test strips reflects the continuous need for replacement consumables in diabetes management, while the glucometer device and lancet segments exhibit steady growth fuelled by technological advancements and market demand.
Self-Monitoring Blood Glucose Strips Industry Product Developments
Recent product innovations have focused on enhancing accuracy, ease of use, and integration with digital health platforms. The introduction of Bluetooth-enabled meters and companion mobile apps allows for seamless data tracking and management. Continuous glucose monitoring (CGM) systems are gaining traction, offering real-time glucose data and improving patient outcomes. These advancements provide competitive advantages by catering to evolving consumer needs and improving clinical outcomes.
Report Scope & Segmentation Analysis
This report segments the self-monitoring blood glucose strips market by component: Glucometer Devices, Test Strips, and Lancets. Each segment is analyzed based on historical data (2019-2024), market size in 2025, and forecasted growth (2025-2033). The competitive landscape within each segment is examined, highlighting key players and their respective market shares. Growth projections indicate significant opportunities across all segments, driven by technological advancements and increased diabetes prevalence.
- Glucometer Devices: Market size of xx Million in 2025, expected to reach xx Million by 2033.
- Test Strips: Market size of xx Million in 2025, expected to reach xx Million by 2033.
- Lancets: Market size of xx Million in 2025, expected to reach xx Million by 2033.
Key Drivers of Self-Monitoring Blood Glucose Strips Industry Growth
The growth of the self-monitoring blood glucose strips market is fueled by several key factors: the rising prevalence of diabetes globally; technological advancements leading to more accurate, user-friendly, and connected devices; increasing healthcare expenditure and insurance coverage; and supportive government initiatives promoting diabetes management. The rising adoption of digital health technologies further enhances market growth.
Challenges in the Self-Monitoring Blood Glucose Strips Industry Sector
The industry faces challenges including stringent regulatory requirements for medical devices, potential supply chain disruptions impacting raw material availability and manufacturing costs, and intense competition among established players and new entrants. These factors can impact product pricing and market accessibility. The increasing prevalence of counterfeit products also presents a significant challenge.
Emerging Opportunities in Self-Monitoring Blood Glucose Strips Industry
Emerging opportunities lie in the development of advanced technologies, such as continuous glucose monitoring (CGM) systems and integrated diabetes management platforms. Expansion into untapped markets, particularly in developing economies with rising diabetes prevalence, presents significant potential. The focus on personalized medicine and patient-centric care offers further growth opportunities.
Leading Players in the Self-Monitoring Blood Glucose Strips Industry Market
- Agamatrix
- Roche Diabetes Care [Roche]
- Abbott Diabetes Care [Abbott]
- Rossmax International
- Medisana
- Acon
- Bionime Corporation
- Arkray
- LifeScan [LifeScan]
- Ascensia Diabetes Care [Ascensia]
Key Developments in Self-Monitoring Blood Glucose Strips Industry Industry
- April 2023: NHS England released recommendations for commissioning after the national evaluation of blood glucose meters, testing strips, and lancets. This impacts market access and product selection for NHS providers.
- June 2022: LifeScan announced publication of Real World Evidence in Diabetes Technology and Therapeutics demonstrating improved glycemic control using their OneTouch Verio Reflect meter and OneTouch Reveal app. This strengthens the market position of connected devices.
Strategic Outlook for Self-Monitoring Blood Glucose Strips Industry Market
The self-monitoring blood glucose strips market is poised for continued growth, driven by technological advancements, increasing diabetes prevalence, and the rising demand for integrated diabetes management solutions. Opportunities exist in developing innovative products, expanding into emerging markets, and strengthening strategic partnerships to enhance market penetration and capture a larger market share. The focus on improving patient outcomes through enhanced accuracy, convenience, and data management will be crucial for future success.
Self-Monitoring Blood Glucose Strips Industry Segmentation
-
1. Component
- 1.1. Glucometer Devices
- 1.2. Test Strips
- 1.3. Lancets
Self-Monitoring Blood Glucose Strips Industry Segmentation By Geography
-
1. North America
- 1.1. United States
- 1.2. Canada
- 1.3. Rest of North America
-
2. Europe
- 2.1. Germany
- 2.2. Spain
- 2.3. Italy
- 2.4. France
- 2.5. United Kingdom
- 2.6. Russia
- 2.7. Rest of Europe
-
3. Asia Pacific
- 3.1. Japan
- 3.2. China
- 3.3. Australia
- 3.4. India
- 3.5. South Korea
- 3.6. Malaysia
- 3.7. Indonesia
- 3.8. Thailand
- 3.9. Philippines
- 3.10. Vietnam
- 3.11. Rest of Asia Pacific
-
4. Latin America
- 4.1. Brazil
- 4.2. Mexico
- 4.3. Rest of Latin America
-
5. Middle East and Africa
- 5.1. South Africa
- 5.2. Saudi Arabia
- 5.3. Oman
- 5.4. Egypt
- 5.5. Iran
- 5.6. Rest of Middle East and Africa
Self-Monitoring Blood Glucose Strips Industry REPORT HIGHLIGHTS
| Aspects | Details |
|---|---|
| Study Period | 2019-2033 |
| Base Year | 2024 |
| Estimated Year | 2025 |
| Forecast Period | 2025-2033 |
| Historical Period | 2019-2024 |
| Growth Rate | CAGR of 6.23% from 2019-2033 |
| Segmentation |
|
Table of Contents
- 1. Introduction
- 1.1. Research Scope
- 1.2. Market Segmentation
- 1.3. Research Methodology
- 1.4. Definitions and Assumptions
- 2. Executive Summary
- 2.1. Introduction
- 3. Market Dynamics
- 3.1. Introduction
- 3.2. Market Drivers
- 3.2.1. Rising Prevalence of Cancer Worldwide; Technological Advancements in Diagnostic Testing; Increasing Demand for Point-of-care Treatment
- 3.3. Market Restrains
- 3.3.1. High Cost of Molecular Diagnostic Tests; Lack of Skilled Workforce and Stringent Regulatory Framework
- 3.4. Market Trends
- 3.4.1. The glucometer devices segment is expected to register the highest CAGR over the forecast period
- 4. Market Factor Analysis
- 4.1. Porters Five Forces
- 4.2. Supply/Value Chain
- 4.3. PESTEL analysis
- 4.4. Market Entropy
- 4.5. Patent/Trademark Analysis
- 5. Global Self-Monitoring Blood Glucose Strips Industry Analysis, Insights and Forecast, 2019-2031
- 5.1. Market Analysis, Insights and Forecast - by Component
- 5.1.1. Glucometer Devices
- 5.1.2. Test Strips
- 5.1.3. Lancets
- 5.2. Market Analysis, Insights and Forecast - by Region
- 5.2.1. North America
- 5.2.2. Europe
- 5.2.3. Asia Pacific
- 5.2.4. Latin America
- 5.2.5. Middle East and Africa
- 5.1. Market Analysis, Insights and Forecast - by Component
- 6. North America Self-Monitoring Blood Glucose Strips Industry Analysis, Insights and Forecast, 2019-2031
- 6.1. Market Analysis, Insights and Forecast - by Component
- 6.1.1. Glucometer Devices
- 6.1.2. Test Strips
- 6.1.3. Lancets
- 6.1. Market Analysis, Insights and Forecast - by Component
- 7. Europe Self-Monitoring Blood Glucose Strips Industry Analysis, Insights and Forecast, 2019-2031
- 7.1. Market Analysis, Insights and Forecast - by Component
- 7.1.1. Glucometer Devices
- 7.1.2. Test Strips
- 7.1.3. Lancets
- 7.1. Market Analysis, Insights and Forecast - by Component
- 8. Asia Pacific Self-Monitoring Blood Glucose Strips Industry Analysis, Insights and Forecast, 2019-2031
- 8.1. Market Analysis, Insights and Forecast - by Component
- 8.1.1. Glucometer Devices
- 8.1.2. Test Strips
- 8.1.3. Lancets
- 8.1. Market Analysis, Insights and Forecast - by Component
- 9. Latin America Self-Monitoring Blood Glucose Strips Industry Analysis, Insights and Forecast, 2019-2031
- 9.1. Market Analysis, Insights and Forecast - by Component
- 9.1.1. Glucometer Devices
- 9.1.2. Test Strips
- 9.1.3. Lancets
- 9.1. Market Analysis, Insights and Forecast - by Component
- 10. Middle East and Africa Self-Monitoring Blood Glucose Strips Industry Analysis, Insights and Forecast, 2019-2031
- 10.1. Market Analysis, Insights and Forecast - by Component
- 10.1.1. Glucometer Devices
- 10.1.2. Test Strips
- 10.1.3. Lancets
- 10.1. Market Analysis, Insights and Forecast - by Component
- 11. North America Self-Monitoring Blood Glucose Strips Industry Analysis, Insights and Forecast, 2019-2031
- 11.1. Market Analysis, Insights and Forecast - By Country/Sub-region
- 11.1.1 United States
- 11.1.2 Canada
- 11.1.3 Mexico
- 12. Europe Self-Monitoring Blood Glucose Strips Industry Analysis, Insights and Forecast, 2019-2031
- 12.1. Market Analysis, Insights and Forecast - By Country/Sub-region
- 12.1.1 Germany
- 12.1.2 United Kingdom
- 12.1.3 France
- 12.1.4 Spain
- 12.1.5 Italy
- 12.1.6 Spain
- 12.1.7 Belgium
- 12.1.8 Netherland
- 12.1.9 Nordics
- 12.1.10 Rest of Europe
- 13. Asia Pacific Self-Monitoring Blood Glucose Strips Industry Analysis, Insights and Forecast, 2019-2031
- 13.1. Market Analysis, Insights and Forecast - By Country/Sub-region
- 13.1.1 China
- 13.1.2 Japan
- 13.1.3 India
- 13.1.4 South Korea
- 13.1.5 Southeast Asia
- 13.1.6 Australia
- 13.1.7 Indonesia
- 13.1.8 Phillipes
- 13.1.9 Singapore
- 13.1.10 Thailandc
- 13.1.11 Rest of Asia Pacific
- 14. South America Self-Monitoring Blood Glucose Strips Industry Analysis, Insights and Forecast, 2019-2031
- 14.1. Market Analysis, Insights and Forecast - By Country/Sub-region
- 14.1.1 Brazil
- 14.1.2 Argentina
- 14.1.3 Peru
- 14.1.4 Chile
- 14.1.5 Colombia
- 14.1.6 Ecuador
- 14.1.7 Venezuela
- 14.1.8 Rest of South America
- 15. MEA Self-Monitoring Blood Glucose Strips Industry Analysis, Insights and Forecast, 2019-2031
- 15.1. Market Analysis, Insights and Forecast - By Country/Sub-region
- 15.1.1 United Arab Emirates
- 15.1.2 Saudi Arabia
- 15.1.3 South Africa
- 15.1.4 Rest of Middle East and Africa
- 16. Competitive Analysis
- 16.1. Global Market Share Analysis 2024
- 16.2. Company Profiles
- 16.2.1 Agamatrix
- 16.2.1.1. Overview
- 16.2.1.2. Products
- 16.2.1.3. SWOT Analysis
- 16.2.1.4. Recent Developments
- 16.2.1.5. Financials (Based on Availability)
- 16.2.2 Roche Diabetes Care
- 16.2.2.1. Overview
- 16.2.2.2. Products
- 16.2.2.3. SWOT Analysis
- 16.2.2.4. Recent Developments
- 16.2.2.5. Financials (Based on Availability)
- 16.2.3 Abbott Diabetes Care
- 16.2.3.1. Overview
- 16.2.3.2. Products
- 16.2.3.3. SWOT Analysis
- 16.2.3.4. Recent Developments
- 16.2.3.5. Financials (Based on Availability)
- 16.2.4 Rossmax International*List Not Exhaustive 7 2 Company Share Analysi
- 16.2.4.1. Overview
- 16.2.4.2. Products
- 16.2.4.3. SWOT Analysis
- 16.2.4.4. Recent Developments
- 16.2.4.5. Financials (Based on Availability)
- 16.2.5 Medisana
- 16.2.5.1. Overview
- 16.2.5.2. Products
- 16.2.5.3. SWOT Analysis
- 16.2.5.4. Recent Developments
- 16.2.5.5. Financials (Based on Availability)
- 16.2.6 Acon
- 16.2.6.1. Overview
- 16.2.6.2. Products
- 16.2.6.3. SWOT Analysis
- 16.2.6.4. Recent Developments
- 16.2.6.5. Financials (Based on Availability)
- 16.2.7 Bionime Corporation
- 16.2.7.1. Overview
- 16.2.7.2. Products
- 16.2.7.3. SWOT Analysis
- 16.2.7.4. Recent Developments
- 16.2.7.5. Financials (Based on Availability)
- 16.2.8 Arkray
- 16.2.8.1. Overview
- 16.2.8.2. Products
- 16.2.8.3. SWOT Analysis
- 16.2.8.4. Recent Developments
- 16.2.8.5. Financials (Based on Availability)
- 16.2.9 LifeScan
- 16.2.9.1. Overview
- 16.2.9.2. Products
- 16.2.9.3. SWOT Analysis
- 16.2.9.4. Recent Developments
- 16.2.9.5. Financials (Based on Availability)
- 16.2.10 Ascensia Diabetes Care
- 16.2.10.1. Overview
- 16.2.10.2. Products
- 16.2.10.3. SWOT Analysis
- 16.2.10.4. Recent Developments
- 16.2.10.5. Financials (Based on Availability)
- 16.2.1 Agamatrix
List of Figures
- Figure 1: Global Self-Monitoring Blood Glucose Strips Industry Revenue Breakdown (Million, %) by Region 2024 & 2032
- Figure 2: North America Self-Monitoring Blood Glucose Strips Industry Revenue (Million), by Country 2024 & 2032
- Figure 3: North America Self-Monitoring Blood Glucose Strips Industry Revenue Share (%), by Country 2024 & 2032
- Figure 4: Europe Self-Monitoring Blood Glucose Strips Industry Revenue (Million), by Country 2024 & 2032
- Figure 5: Europe Self-Monitoring Blood Glucose Strips Industry Revenue Share (%), by Country 2024 & 2032
- Figure 6: Asia Pacific Self-Monitoring Blood Glucose Strips Industry Revenue (Million), by Country 2024 & 2032
- Figure 7: Asia Pacific Self-Monitoring Blood Glucose Strips Industry Revenue Share (%), by Country 2024 & 2032
- Figure 8: South America Self-Monitoring Blood Glucose Strips Industry Revenue (Million), by Country 2024 & 2032
- Figure 9: South America Self-Monitoring Blood Glucose Strips Industry Revenue Share (%), by Country 2024 & 2032
- Figure 10: MEA Self-Monitoring Blood Glucose Strips Industry Revenue (Million), by Country 2024 & 2032
- Figure 11: MEA Self-Monitoring Blood Glucose Strips Industry Revenue Share (%), by Country 2024 & 2032
- Figure 12: North America Self-Monitoring Blood Glucose Strips Industry Revenue (Million), by Component 2024 & 2032
- Figure 13: North America Self-Monitoring Blood Glucose Strips Industry Revenue Share (%), by Component 2024 & 2032
- Figure 14: North America Self-Monitoring Blood Glucose Strips Industry Revenue (Million), by Country 2024 & 2032
- Figure 15: North America Self-Monitoring Blood Glucose Strips Industry Revenue Share (%), by Country 2024 & 2032
- Figure 16: Europe Self-Monitoring Blood Glucose Strips Industry Revenue (Million), by Component 2024 & 2032
- Figure 17: Europe Self-Monitoring Blood Glucose Strips Industry Revenue Share (%), by Component 2024 & 2032
- Figure 18: Europe Self-Monitoring Blood Glucose Strips Industry Revenue (Million), by Country 2024 & 2032
- Figure 19: Europe Self-Monitoring Blood Glucose Strips Industry Revenue Share (%), by Country 2024 & 2032
- Figure 20: Asia Pacific Self-Monitoring Blood Glucose Strips Industry Revenue (Million), by Component 2024 & 2032
- Figure 21: Asia Pacific Self-Monitoring Blood Glucose Strips Industry Revenue Share (%), by Component 2024 & 2032
- Figure 22: Asia Pacific Self-Monitoring Blood Glucose Strips Industry Revenue (Million), by Country 2024 & 2032
- Figure 23: Asia Pacific Self-Monitoring Blood Glucose Strips Industry Revenue Share (%), by Country 2024 & 2032
- Figure 24: Latin America Self-Monitoring Blood Glucose Strips Industry Revenue (Million), by Component 2024 & 2032
- Figure 25: Latin America Self-Monitoring Blood Glucose Strips Industry Revenue Share (%), by Component 2024 & 2032
- Figure 26: Latin America Self-Monitoring Blood Glucose Strips Industry Revenue (Million), by Country 2024 & 2032
- Figure 27: Latin America Self-Monitoring Blood Glucose Strips Industry Revenue Share (%), by Country 2024 & 2032
- Figure 28: Middle East and Africa Self-Monitoring Blood Glucose Strips Industry Revenue (Million), by Component 2024 & 2032
- Figure 29: Middle East and Africa Self-Monitoring Blood Glucose Strips Industry Revenue Share (%), by Component 2024 & 2032
- Figure 30: Middle East and Africa Self-Monitoring Blood Glucose Strips Industry Revenue (Million), by Country 2024 & 2032
- Figure 31: Middle East and Africa Self-Monitoring Blood Glucose Strips Industry Revenue Share (%), by Country 2024 & 2032
List of Tables
- Table 1: Global Self-Monitoring Blood Glucose Strips Industry Revenue Million Forecast, by Region 2019 & 2032
- Table 2: Global Self-Monitoring Blood Glucose Strips Industry Revenue Million Forecast, by Component 2019 & 2032
- Table 3: Global Self-Monitoring Blood Glucose Strips Industry Revenue Million Forecast, by Region 2019 & 2032
- Table 4: Global Self-Monitoring Blood Glucose Strips Industry Revenue Million Forecast, by Country 2019 & 2032
- Table 5: United States Self-Monitoring Blood Glucose Strips Industry Revenue (Million) Forecast, by Application 2019 & 2032
- Table 6: Canada Self-Monitoring Blood Glucose Strips Industry Revenue (Million) Forecast, by Application 2019 & 2032
- Table 7: Mexico Self-Monitoring Blood Glucose Strips Industry Revenue (Million) Forecast, by Application 2019 & 2032
- Table 8: Global Self-Monitoring Blood Glucose Strips Industry Revenue Million Forecast, by Country 2019 & 2032
- Table 9: Germany Self-Monitoring Blood Glucose Strips Industry Revenue (Million) Forecast, by Application 2019 & 2032
- Table 10: United Kingdom Self-Monitoring Blood Glucose Strips Industry Revenue (Million) Forecast, by Application 2019 & 2032
- Table 11: France Self-Monitoring Blood Glucose Strips Industry Revenue (Million) Forecast, by Application 2019 & 2032
- Table 12: Spain Self-Monitoring Blood Glucose Strips Industry Revenue (Million) Forecast, by Application 2019 & 2032
- Table 13: Italy Self-Monitoring Blood Glucose Strips Industry Revenue (Million) Forecast, by Application 2019 & 2032
- Table 14: Spain Self-Monitoring Blood Glucose Strips Industry Revenue (Million) Forecast, by Application 2019 & 2032
- Table 15: Belgium Self-Monitoring Blood Glucose Strips Industry Revenue (Million) Forecast, by Application 2019 & 2032
- Table 16: Netherland Self-Monitoring Blood Glucose Strips Industry Revenue (Million) Forecast, by Application 2019 & 2032
- Table 17: Nordics Self-Monitoring Blood Glucose Strips Industry Revenue (Million) Forecast, by Application 2019 & 2032
- Table 18: Rest of Europe Self-Monitoring Blood Glucose Strips Industry Revenue (Million) Forecast, by Application 2019 & 2032
- Table 19: Global Self-Monitoring Blood Glucose Strips Industry Revenue Million Forecast, by Country 2019 & 2032
- Table 20: China Self-Monitoring Blood Glucose Strips Industry Revenue (Million) Forecast, by Application 2019 & 2032
- Table 21: Japan Self-Monitoring Blood Glucose Strips Industry Revenue (Million) Forecast, by Application 2019 & 2032
- Table 22: India Self-Monitoring Blood Glucose Strips Industry Revenue (Million) Forecast, by Application 2019 & 2032
- Table 23: South Korea Self-Monitoring Blood Glucose Strips Industry Revenue (Million) Forecast, by Application 2019 & 2032
- Table 24: Southeast Asia Self-Monitoring Blood Glucose Strips Industry Revenue (Million) Forecast, by Application 2019 & 2032
- Table 25: Australia Self-Monitoring Blood Glucose Strips Industry Revenue (Million) Forecast, by Application 2019 & 2032
- Table 26: Indonesia Self-Monitoring Blood Glucose Strips Industry Revenue (Million) Forecast, by Application 2019 & 2032
- Table 27: Phillipes Self-Monitoring Blood Glucose Strips Industry Revenue (Million) Forecast, by Application 2019 & 2032
- Table 28: Singapore Self-Monitoring Blood Glucose Strips Industry Revenue (Million) Forecast, by Application 2019 & 2032
- Table 29: Thailandc Self-Monitoring Blood Glucose Strips Industry Revenue (Million) Forecast, by Application 2019 & 2032
- Table 30: Rest of Asia Pacific Self-Monitoring Blood Glucose Strips Industry Revenue (Million) Forecast, by Application 2019 & 2032
- Table 31: Global Self-Monitoring Blood Glucose Strips Industry Revenue Million Forecast, by Country 2019 & 2032
- Table 32: Brazil Self-Monitoring Blood Glucose Strips Industry Revenue (Million) Forecast, by Application 2019 & 2032
- Table 33: Argentina Self-Monitoring Blood Glucose Strips Industry Revenue (Million) Forecast, by Application 2019 & 2032
- Table 34: Peru Self-Monitoring Blood Glucose Strips Industry Revenue (Million) Forecast, by Application 2019 & 2032
- Table 35: Chile Self-Monitoring Blood Glucose Strips Industry Revenue (Million) Forecast, by Application 2019 & 2032
- Table 36: Colombia Self-Monitoring Blood Glucose Strips Industry Revenue (Million) Forecast, by Application 2019 & 2032
- Table 37: Ecuador Self-Monitoring Blood Glucose Strips Industry Revenue (Million) Forecast, by Application 2019 & 2032
- Table 38: Venezuela Self-Monitoring Blood Glucose Strips Industry Revenue (Million) Forecast, by Application 2019 & 2032
- Table 39: Rest of South America Self-Monitoring Blood Glucose Strips Industry Revenue (Million) Forecast, by Application 2019 & 2032
- Table 40: Global Self-Monitoring Blood Glucose Strips Industry Revenue Million Forecast, by Country 2019 & 2032
- Table 41: United Arab Emirates Self-Monitoring Blood Glucose Strips Industry Revenue (Million) Forecast, by Application 2019 & 2032
- Table 42: Saudi Arabia Self-Monitoring Blood Glucose Strips Industry Revenue (Million) Forecast, by Application 2019 & 2032
- Table 43: South Africa Self-Monitoring Blood Glucose Strips Industry Revenue (Million) Forecast, by Application 2019 & 2032
- Table 44: Rest of Middle East and Africa Self-Monitoring Blood Glucose Strips Industry Revenue (Million) Forecast, by Application 2019 & 2032
- Table 45: Global Self-Monitoring Blood Glucose Strips Industry Revenue Million Forecast, by Component 2019 & 2032
- Table 46: Global Self-Monitoring Blood Glucose Strips Industry Revenue Million Forecast, by Country 2019 & 2032
- Table 47: United States Self-Monitoring Blood Glucose Strips Industry Revenue (Million) Forecast, by Application 2019 & 2032
- Table 48: Canada Self-Monitoring Blood Glucose Strips Industry Revenue (Million) Forecast, by Application 2019 & 2032
- Table 49: Rest of North America Self-Monitoring Blood Glucose Strips Industry Revenue (Million) Forecast, by Application 2019 & 2032
- Table 50: Global Self-Monitoring Blood Glucose Strips Industry Revenue Million Forecast, by Component 2019 & 2032
- Table 51: Global Self-Monitoring Blood Glucose Strips Industry Revenue Million Forecast, by Country 2019 & 2032
- Table 52: Germany Self-Monitoring Blood Glucose Strips Industry Revenue (Million) Forecast, by Application 2019 & 2032
- Table 53: Spain Self-Monitoring Blood Glucose Strips Industry Revenue (Million) Forecast, by Application 2019 & 2032
- Table 54: Italy Self-Monitoring Blood Glucose Strips Industry Revenue (Million) Forecast, by Application 2019 & 2032
- Table 55: France Self-Monitoring Blood Glucose Strips Industry Revenue (Million) Forecast, by Application 2019 & 2032
- Table 56: United Kingdom Self-Monitoring Blood Glucose Strips Industry Revenue (Million) Forecast, by Application 2019 & 2032
- Table 57: Russia Self-Monitoring Blood Glucose Strips Industry Revenue (Million) Forecast, by Application 2019 & 2032
- Table 58: Rest of Europe Self-Monitoring Blood Glucose Strips Industry Revenue (Million) Forecast, by Application 2019 & 2032
- Table 59: Global Self-Monitoring Blood Glucose Strips Industry Revenue Million Forecast, by Component 2019 & 2032
- Table 60: Global Self-Monitoring Blood Glucose Strips Industry Revenue Million Forecast, by Country 2019 & 2032
- Table 61: Japan Self-Monitoring Blood Glucose Strips Industry Revenue (Million) Forecast, by Application 2019 & 2032
- Table 62: China Self-Monitoring Blood Glucose Strips Industry Revenue (Million) Forecast, by Application 2019 & 2032
- Table 63: Australia Self-Monitoring Blood Glucose Strips Industry Revenue (Million) Forecast, by Application 2019 & 2032
- Table 64: India Self-Monitoring Blood Glucose Strips Industry Revenue (Million) Forecast, by Application 2019 & 2032
- Table 65: South Korea Self-Monitoring Blood Glucose Strips Industry Revenue (Million) Forecast, by Application 2019 & 2032
- Table 66: Malaysia Self-Monitoring Blood Glucose Strips Industry Revenue (Million) Forecast, by Application 2019 & 2032
- Table 67: Indonesia Self-Monitoring Blood Glucose Strips Industry Revenue (Million) Forecast, by Application 2019 & 2032
- Table 68: Thailand Self-Monitoring Blood Glucose Strips Industry Revenue (Million) Forecast, by Application 2019 & 2032
- Table 69: Philippines Self-Monitoring Blood Glucose Strips Industry Revenue (Million) Forecast, by Application 2019 & 2032
- Table 70: Vietnam Self-Monitoring Blood Glucose Strips Industry Revenue (Million) Forecast, by Application 2019 & 2032
- Table 71: Rest of Asia Pacific Self-Monitoring Blood Glucose Strips Industry Revenue (Million) Forecast, by Application 2019 & 2032
- Table 72: Global Self-Monitoring Blood Glucose Strips Industry Revenue Million Forecast, by Component 2019 & 2032
- Table 73: Global Self-Monitoring Blood Glucose Strips Industry Revenue Million Forecast, by Country 2019 & 2032
- Table 74: Brazil Self-Monitoring Blood Glucose Strips Industry Revenue (Million) Forecast, by Application 2019 & 2032
- Table 75: Mexico Self-Monitoring Blood Glucose Strips Industry Revenue (Million) Forecast, by Application 2019 & 2032
- Table 76: Rest of Latin America Self-Monitoring Blood Glucose Strips Industry Revenue (Million) Forecast, by Application 2019 & 2032
- Table 77: Global Self-Monitoring Blood Glucose Strips Industry Revenue Million Forecast, by Component 2019 & 2032
- Table 78: Global Self-Monitoring Blood Glucose Strips Industry Revenue Million Forecast, by Country 2019 & 2032
- Table 79: South Africa Self-Monitoring Blood Glucose Strips Industry Revenue (Million) Forecast, by Application 2019 & 2032
- Table 80: Saudi Arabia Self-Monitoring Blood Glucose Strips Industry Revenue (Million) Forecast, by Application 2019 & 2032
- Table 81: Oman Self-Monitoring Blood Glucose Strips Industry Revenue (Million) Forecast, by Application 2019 & 2032
- Table 82: Egypt Self-Monitoring Blood Glucose Strips Industry Revenue (Million) Forecast, by Application 2019 & 2032
- Table 83: Iran Self-Monitoring Blood Glucose Strips Industry Revenue (Million) Forecast, by Application 2019 & 2032
- Table 84: Rest of Middle East and Africa Self-Monitoring Blood Glucose Strips Industry Revenue (Million) Forecast, by Application 2019 & 2032
Frequently Asked Questions
1. What is the projected Compound Annual Growth Rate (CAGR) of the Self-Monitoring Blood Glucose Strips Industry?
The projected CAGR is approximately 6.23%.
2. Which companies are prominent players in the Self-Monitoring Blood Glucose Strips Industry?
Key companies in the market include Agamatrix, Roche Diabetes Care, Abbott Diabetes Care, Rossmax International*List Not Exhaustive 7 2 Company Share Analysi, Medisana, Acon, Bionime Corporation, Arkray, LifeScan, Ascensia Diabetes Care.
3. What are the main segments of the Self-Monitoring Blood Glucose Strips Industry?
The market segments include Component.
4. Can you provide details about the market size?
The market size is estimated to be USD 7.22 Million as of 2022.
5. What are some drivers contributing to market growth?
Rising Prevalence of Cancer Worldwide; Technological Advancements in Diagnostic Testing; Increasing Demand for Point-of-care Treatment.
6. What are the notable trends driving market growth?
The glucometer devices segment is expected to register the highest CAGR over the forecast period.
7. Are there any restraints impacting market growth?
High Cost of Molecular Diagnostic Tests; Lack of Skilled Workforce and Stringent Regulatory Framework.
8. Can you provide examples of recent developments in the market?
April 2023: NHS england relased recommendations for commissioning after the national evaluation of blood glucose meters, testing strips, and lancets.
9. What pricing options are available for accessing the report?
Pricing options include single-user, multi-user, and enterprise licenses priced at USD 4750, USD 5250, and USD 8750 respectively.
10. Is the market size provided in terms of value or volume?
The market size is provided in terms of value, measured in Million.
11. Are there any specific market keywords associated with the report?
Yes, the market keyword associated with the report is "Self-Monitoring Blood Glucose Strips Industry," which aids in identifying and referencing the specific market segment covered.
12. How do I determine which pricing option suits my needs best?
The pricing options vary based on user requirements and access needs. Individual users may opt for single-user licenses, while businesses requiring broader access may choose multi-user or enterprise licenses for cost-effective access to the report.
13. Are there any additional resources or data provided in the Self-Monitoring Blood Glucose Strips Industry report?
While the report offers comprehensive insights, it's advisable to review the specific contents or supplementary materials provided to ascertain if additional resources or data are available.
14. How can I stay updated on further developments or reports in the Self-Monitoring Blood Glucose Strips Industry?
To stay informed about further developments, trends, and reports in the Self-Monitoring Blood Glucose Strips Industry, consider subscribing to industry newsletters, following relevant companies and organizations, or regularly checking reputable industry news sources and publications.
Methodology
Step 1 - Identification of Relevant Samples Size from Population Database


Step 2 - Approaches for Defining Global Market Size (Value, Volume* & Price*)

Note*: In applicable scenarios
Step 3 - Data Sources
Primary Research
- Web Analytics
- Survey Reports
- Research Institute
- Latest Research Reports
- Opinion Leaders
Secondary Research
- Annual Reports
- White Paper
- Latest Press Release
- Industry Association
- Paid Database
- Investor Presentations

Step 4 - Data Triangulation
Involves using different sources of information in order to increase the validity of a study
These sources are likely to be stakeholders in a program - participants, other researchers, program staff, other community members, and so on.
Then we put all data in single framework & apply various statistical tools to find out the dynamic on the market.
During the analysis stage, feedback from the stakeholder groups would be compared to determine areas of agreement as well as areas of divergence


