
Key Insights
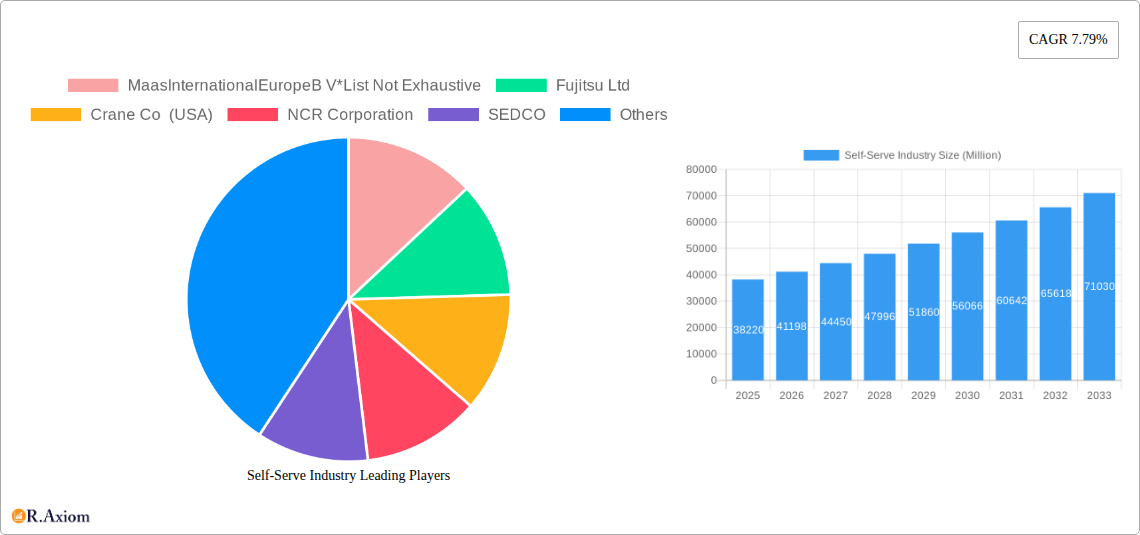
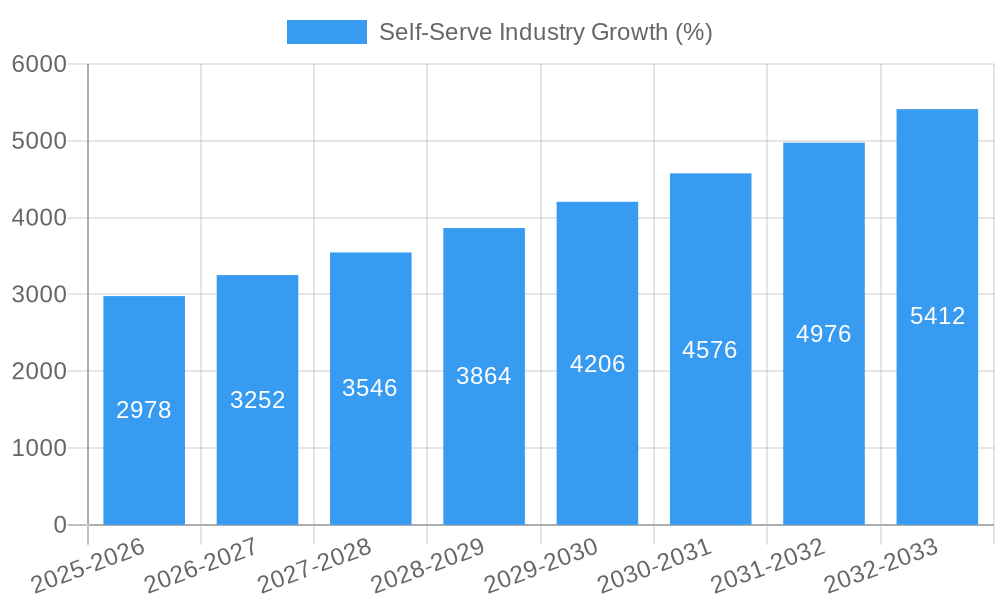
The self-service industry, encompassing kiosks, ATMs, vending machines, and other automated solutions, is experiencing robust growth, projected to reach a market size of $38.22 billion in 2025 and maintain a Compound Annual Growth Rate (CAGR) of 7.79% from 2025 to 2033. This expansion is driven by several key factors. Firstly, the increasing adoption of digital technologies and the rising demand for contactless services are fueling the demand for self-service solutions across various sectors. Consumers are increasingly seeking convenience, speed, and 24/7 accessibility, which self-service technologies effectively deliver. Secondly, businesses are leveraging these technologies to streamline operations, reduce labor costs, and improve efficiency. The BFSI (Banking, Financial Services, and Insurance) sector, retail and fast-food chains, and the hospitality industry are significant adopters, with significant growth expected in healthcare and travel & transportation sectors as well. The growing adoption of advanced technologies like AI and machine learning in self-service systems further enhances their capabilities, improving user experience and operational efficiency, driving market expansion.
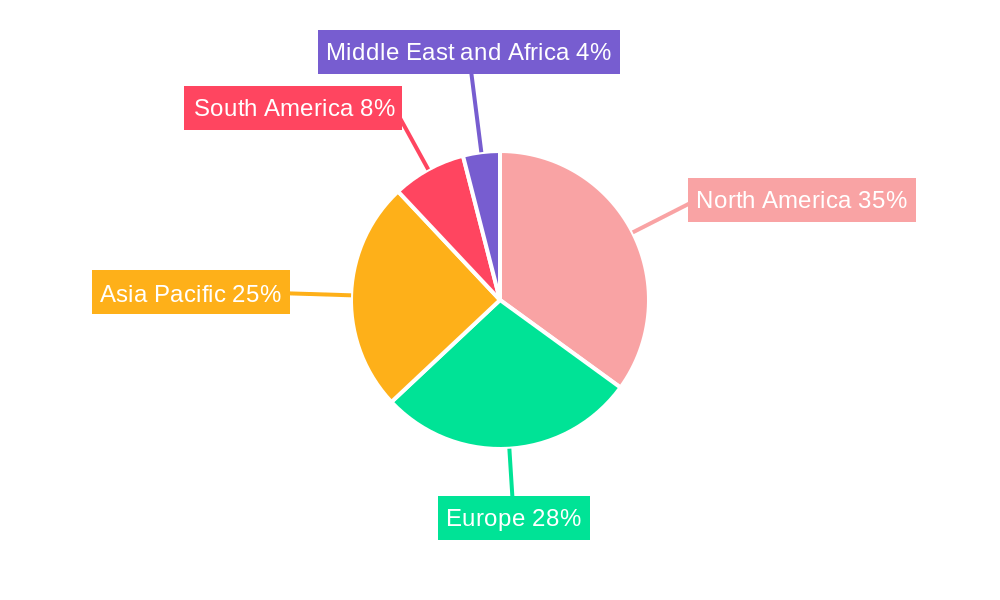
The self-service market is segmented by type (kiosk, ATM, vending machine) and end-user (BFSI, retail, hospitality, healthcare, travel & transportation, others). While kiosk and ATM segments currently dominate, vending machines are poised for significant growth, particularly with the integration of smart technologies and cashless payment options. Geographical distribution reveals strong growth potential across various regions. While North America and Europe currently hold substantial market share, the Asia-Pacific region is expected to experience accelerated growth due to increasing urbanization, rising disposable incomes, and expanding technological infrastructure. Competitive forces are shaping the industry with established players like NCR Corporation and Diebold Nixdorf alongside innovative smaller companies introducing cutting-edge solutions. The industry faces challenges such as security concerns, technological advancements, and ensuring seamless integration with existing systems. However, the overall trajectory suggests continued growth driven by consumer demand and the ever-increasing need for efficient, accessible, and cost-effective service delivery.
This comprehensive report provides an in-depth analysis of the global self-serve industry, encompassing market size, growth drivers, key players, and emerging trends from 2019 to 2033. With a focus on kiosks, ATMs, and vending machines across diverse end-user sectors, this report is an essential resource for industry stakeholders, investors, and strategic decision-makers. The report projects a market value exceeding $XX Million by 2033.
Self-Serve Industry Market Concentration & Innovation
This section analyzes the competitive landscape of the self-serve industry, focusing on market concentration, innovation drivers, regulatory frameworks, product substitutes, end-user trends, and mergers & acquisitions (M&A) activities. The market is characterized by a mix of large multinational corporations and smaller specialized companies. Market share is highly dynamic, with leading players constantly innovating to maintain their competitive edge.
- Market Concentration: The self-serve industry exhibits moderate concentration, with a few dominant players holding significant market share, while numerous smaller players cater to niche segments. The top 5 players collectively hold an estimated xx% of the global market share (2024).
- Innovation Drivers: Key innovation drivers include advancements in automation technology, artificial intelligence (AI), and payment systems. The integration of mobile applications and cloud-based services enhances customer experience and operational efficiency.
- Regulatory Frameworks: Government regulations related to data privacy, security, and accessibility impact the self-serve industry. Compliance costs and evolving standards drive innovation in secure and user-friendly designs.
- Product Substitutes: The self-serve industry faces competition from traditional service models, online platforms, and other emerging technologies. The competitive landscape necessitates continuous improvement and feature enhancements.
- End-User Trends: Growing demand for convenience, 24/7 accessibility, and personalized experiences fuels market growth. End-users increasingly prefer self-service options across various sectors.
- M&A Activities: The self-serve industry has witnessed significant M&A activity in recent years, with larger companies acquiring smaller firms to expand their product portfolio, geographical reach, and technological capabilities. Total M&A deal value exceeded $XX Million in the last five years.
Self-Serve Industry Industry Trends & Insights
This section explores the dynamic trends and insights shaping the self-serve industry. The market exhibits strong growth potential, driven by factors such as the rising adoption of self-service technologies across multiple sectors, increasing urbanization, and evolving consumer preferences.
The self-serve industry is experiencing robust growth, with a Compound Annual Growth Rate (CAGR) of xx% projected from 2025 to 2033. Market penetration varies significantly across segments and regions, with higher penetration observed in developed economies compared to developing countries. Technological advancements, such as AI-powered kiosks and contactless payment options, are disrupting the industry and creating new opportunities. Consumer preferences toward speed, convenience, and personalized experiences are further accelerating market growth. The competitive landscape is characterized by intense competition among established players and emerging startups, prompting companies to continuously innovate and adapt to meet evolving consumer demands. The market is also witnessing a shift toward software-as-a-service (SaaS) models, enhancing flexibility and scalability for businesses.
Dominant Markets & Segments in Self-Serve Industry
This section identifies the leading regions, countries, and segments within the self-serve industry, analyzing the key drivers contributing to their dominance.
- Leading Regions/Countries: North America and Europe currently dominate the self-serve market, driven by high technology adoption rates, advanced infrastructure, and strong consumer demand. However, the Asia-Pacific region is expected to witness significant growth in the coming years.
- Dominant Segments (by Type):
- Kiosks: The kiosk segment holds a substantial market share, propelled by increasing applications in retail, hospitality, and healthcare.
- ATMs: The ATM segment remains a significant contributor, though facing competitive pressure from mobile payment solutions.
- Vending Machines: The vending machine segment is growing steadily, driven by technological advancements and increasing demand for convenience.
- Dominant Segments (by End-User):
- BFSI (Banking, Financial Services, and Insurance): This sector leads in ATM adoption, driving substantial market growth.
- Retail & Fast Food Chains: High adoption of self-checkout kiosks and vending machines significantly contributes to this segment's dominance.
- Key Drivers:
- Strong economic growth and rising disposable incomes.
- Increasing urbanization and changing lifestyles.
- Government initiatives promoting digitalization and technological advancements.
- Development of robust infrastructure supporting self-service technologies.
Self-Serve Industry Product Developments
Recent product innovations focus on enhancing user experience, improving security, and integrating advanced technologies. The market is witnessing a surge in AI-powered kiosks capable of personalized interactions and improved efficiency. Contactless payment options are becoming increasingly prevalent, catering to hygiene concerns and consumer preference. Self-service technologies are gaining traction in various sectors, driven by the need for increased efficiency and cost reduction. Innovative solutions tailored to specific industry needs are driving market expansion.
Report Scope & Segmentation Analysis
This report segments the self-serve industry by type (kiosk, ATM, vending machine) and end-user (BFSI, retail & fast food, hospitality, healthcare, travel & transportation, other). Each segment is analyzed based on market size, growth projections, and competitive dynamics. The report provides detailed insights into the current market landscape and future growth potential of each segment. Growth projections vary across segments, with some experiencing faster growth compared to others. Competitive intensity varies across segments depending on the number of players and market concentration.
Key Drivers of Self-Serve Industry Growth
The self-serve industry's growth is driven by technological advancements (AI, contactless payments), rising consumer demand for convenience and 24/7 accessibility, and increasing adoption across various sectors. Government initiatives promoting digitalization and favorable economic conditions further fuel market expansion. The growing preference for personalized experiences and enhanced security features also drives market growth.
Challenges in the Self-Serve Industry Sector
The self-serve industry faces challenges such as high initial investment costs, security concerns (data breaches, vandalism), and the need for robust maintenance and support. Competition from other service models and technological disruptions also pose challenges. The industry faces supply chain issues and potential regulatory hurdles related to data privacy and accessibility standards impacting profitability and market share.
Emerging Opportunities in Self-Serve Industry
Emerging opportunities include the integration of IoT (Internet of Things) technologies, expansion into new markets (developing countries), and the development of specialized self-service solutions for niche sectors. The growing demand for personalized experiences and the increasing adoption of AI and machine learning present significant opportunities. The development of sustainable and eco-friendly self-service technologies also presents a major opportunity.
Leading Players in the Self-Serve Industry Market
- MaasInternationalEurope BV
- Fujitsu Ltd (Fujitsu Ltd)
- Crane Co (USA) (Crane Co)
- NCR Corporation (NCR Corporation)
- SEDCO
- Frank Mayer & Associates Inc (Frank Mayer & Associates Inc)
- Advanced Kiosks
- Azkoyen Group (Azkoyen Group)
- Advantech Co Limited (Advantech Co Limited)
- ProtouchUK
- Zebra Technologies (Zebra Technologies)
- HESS Cash systems GmbH & Co
- Diebold Nixdorf (Diebold Nixdorf)
- Embross
- IER Group
Key Developments in Self-Serve Industry Industry
- January 2024: NCR Corporation launched its Next Generation Self-Checkout Solution, NCR Voyix commerce platform. This SaaS-based solution offers retailers a flexible and adaptable checkout experience.
- June 2023: Gem OpenCube technologies pvt ltd introduced the world's first automated Water, Tea, and Coffee (WTC) vending machine, offering 24/7 service without human intervention.
Strategic Outlook for Self-Serve Industry Market
The self-serve industry is poised for significant growth, driven by technological innovations, evolving consumer preferences, and expanding applications across diverse sectors. The market's future potential is considerable, with continued expansion expected in both developed and developing economies. Strategic investments in R&D, partnerships, and expansion into new markets will be crucial for success in this dynamic industry.
Self-Serve Industry Segmentation
-
1. Type
- 1.1. Kiosk
- 1.2. ATM
- 1.3. Vending Machine
-
2. End-user
- 2.1. BFSI
- 2.2. Retail & Fast Food Chain
- 2.3. Hospitality
- 2.4. Healthcare
- 2.5. Travel & Transportation
- 2.6. Other End-users
Self-Serve Industry Segmentation By Geography
- 1. North America
- 2. Europe
- 3. Asia Pacific
- 4. South America
- 5. Middle East and Africa
Self-Serve Industry REPORT HIGHLIGHTS
| Aspects | Details |
|---|---|
| Study Period | 2019-2033 |
| Base Year | 2024 |
| Estimated Year | 2025 |
| Forecast Period | 2025-2033 |
| Historical Period | 2019-2024 |
| Growth Rate | CAGR of 7.79% from 2019-2033 |
| Segmentation |
|
Table of Contents
- 1. Introduction
- 1.1. Research Scope
- 1.2. Market Segmentation
- 1.3. Research Methodology
- 1.4. Definitions and Assumptions
- 2. Executive Summary
- 2.1. Introduction
- 3. Market Dynamics
- 3.1. Introduction
- 3.2. Market Drivers
- 3.2.1. Growing emphasis on ensuring customer satisfaction to drive demand in the Retail & Food sector; High investments in the infrastructure developments (new & refurbishments) and smart city initiatives; Technological investments to enable greater support for the differently abled populace & new users
- 3.3. Market Restrains
- 3.3.1. Cost and maintenance remains a key consideration
- 3.4. Market Trends
- 3.4.1. Automated Teller Machine (ATM) to Witness the Growth
- 4. Market Factor Analysis
- 4.1. Porters Five Forces
- 4.2. Supply/Value Chain
- 4.3. PESTEL analysis
- 4.4. Market Entropy
- 4.5. Patent/Trademark Analysis
- 5. Global Self-Serve Industry Analysis, Insights and Forecast, 2019-2031
- 5.1. Market Analysis, Insights and Forecast - by Type
- 5.1.1. Kiosk
- 5.1.2. ATM
- 5.1.3. Vending Machine
- 5.2. Market Analysis, Insights and Forecast - by End-user
- 5.2.1. BFSI
- 5.2.2. Retail & Fast Food Chain
- 5.2.3. Hospitality
- 5.2.4. Healthcare
- 5.2.5. Travel & Transportation
- 5.2.6. Other End-users
- 5.3. Market Analysis, Insights and Forecast - by Region
- 5.3.1. North America
- 5.3.2. Europe
- 5.3.3. Asia Pacific
- 5.3.4. South America
- 5.3.5. Middle East and Africa
- 5.1. Market Analysis, Insights and Forecast - by Type
- 6. North America Self-Serve Industry Analysis, Insights and Forecast, 2019-2031
- 6.1. Market Analysis, Insights and Forecast - by Type
- 6.1.1. Kiosk
- 6.1.2. ATM
- 6.1.3. Vending Machine
- 6.2. Market Analysis, Insights and Forecast - by End-user
- 6.2.1. BFSI
- 6.2.2. Retail & Fast Food Chain
- 6.2.3. Hospitality
- 6.2.4. Healthcare
- 6.2.5. Travel & Transportation
- 6.2.6. Other End-users
- 6.1. Market Analysis, Insights and Forecast - by Type
- 7. Europe Self-Serve Industry Analysis, Insights and Forecast, 2019-2031
- 7.1. Market Analysis, Insights and Forecast - by Type
- 7.1.1. Kiosk
- 7.1.2. ATM
- 7.1.3. Vending Machine
- 7.2. Market Analysis, Insights and Forecast - by End-user
- 7.2.1. BFSI
- 7.2.2. Retail & Fast Food Chain
- 7.2.3. Hospitality
- 7.2.4. Healthcare
- 7.2.5. Travel & Transportation
- 7.2.6. Other End-users
- 7.1. Market Analysis, Insights and Forecast - by Type
- 8. Asia Pacific Self-Serve Industry Analysis, Insights and Forecast, 2019-2031
- 8.1. Market Analysis, Insights and Forecast - by Type
- 8.1.1. Kiosk
- 8.1.2. ATM
- 8.1.3. Vending Machine
- 8.2. Market Analysis, Insights and Forecast - by End-user
- 8.2.1. BFSI
- 8.2.2. Retail & Fast Food Chain
- 8.2.3. Hospitality
- 8.2.4. Healthcare
- 8.2.5. Travel & Transportation
- 8.2.6. Other End-users
- 8.1. Market Analysis, Insights and Forecast - by Type
- 9. South America Self-Serve Industry Analysis, Insights and Forecast, 2019-2031
- 9.1. Market Analysis, Insights and Forecast - by Type
- 9.1.1. Kiosk
- 9.1.2. ATM
- 9.1.3. Vending Machine
- 9.2. Market Analysis, Insights and Forecast - by End-user
- 9.2.1. BFSI
- 9.2.2. Retail & Fast Food Chain
- 9.2.3. Hospitality
- 9.2.4. Healthcare
- 9.2.5. Travel & Transportation
- 9.2.6. Other End-users
- 9.1. Market Analysis, Insights and Forecast - by Type
- 10. Middle East and Africa Self-Serve Industry Analysis, Insights and Forecast, 2019-2031
- 10.1. Market Analysis, Insights and Forecast - by Type
- 10.1.1. Kiosk
- 10.1.2. ATM
- 10.1.3. Vending Machine
- 10.2. Market Analysis, Insights and Forecast - by End-user
- 10.2.1. BFSI
- 10.2.2. Retail & Fast Food Chain
- 10.2.3. Hospitality
- 10.2.4. Healthcare
- 10.2.5. Travel & Transportation
- 10.2.6. Other End-users
- 10.1. Market Analysis, Insights and Forecast - by Type
- 11. North America Self-Serve Industry Analysis, Insights and Forecast, 2019-2031
- 11.1. Market Analysis, Insights and Forecast - By Country/Sub-region
- 11.1.1.
- 12. Europe Self-Serve Industry Analysis, Insights and Forecast, 2019-2031
- 12.1. Market Analysis, Insights and Forecast - By Country/Sub-region
- 12.1.1.
- 13. Asia Pacific Self-Serve Industry Analysis, Insights and Forecast, 2019-2031
- 13.1. Market Analysis, Insights and Forecast - By Country/Sub-region
- 13.1.1.
- 14. South America Self-Serve Industry Analysis, Insights and Forecast, 2019-2031
- 14.1. Market Analysis, Insights and Forecast - By Country/Sub-region
- 14.1.1.
- 15. Middle East and Africa Self-Serve Industry Analysis, Insights and Forecast, 2019-2031
- 15.1. Market Analysis, Insights and Forecast - By Country/Sub-region
- 15.1.1.
- 16. Competitive Analysis
- 16.1. Global Market Share Analysis 2024
- 16.2. Company Profiles
- 16.2.1 MaasInternationalEuropeB V*List Not Exhaustive
- 16.2.1.1. Overview
- 16.2.1.2. Products
- 16.2.1.3. SWOT Analysis
- 16.2.1.4. Recent Developments
- 16.2.1.5. Financials (Based on Availability)
- 16.2.2 Fujitsu Ltd
- 16.2.2.1. Overview
- 16.2.2.2. Products
- 16.2.2.3. SWOT Analysis
- 16.2.2.4. Recent Developments
- 16.2.2.5. Financials (Based on Availability)
- 16.2.3 Crane Co (USA)
- 16.2.3.1. Overview
- 16.2.3.2. Products
- 16.2.3.3. SWOT Analysis
- 16.2.3.4. Recent Developments
- 16.2.3.5. Financials (Based on Availability)
- 16.2.4 NCR Corporation
- 16.2.4.1. Overview
- 16.2.4.2. Products
- 16.2.4.3. SWOT Analysis
- 16.2.4.4. Recent Developments
- 16.2.4.5. Financials (Based on Availability)
- 16.2.5 SEDCO
- 16.2.5.1. Overview
- 16.2.5.2. Products
- 16.2.5.3. SWOT Analysis
- 16.2.5.4. Recent Developments
- 16.2.5.5. Financials (Based on Availability)
- 16.2.6 Frank Mayer & Associates Inc
- 16.2.6.1. Overview
- 16.2.6.2. Products
- 16.2.6.3. SWOT Analysis
- 16.2.6.4. Recent Developments
- 16.2.6.5. Financials (Based on Availability)
- 16.2.7 Advanced Kiosks
- 16.2.7.1. Overview
- 16.2.7.2. Products
- 16.2.7.3. SWOT Analysis
- 16.2.7.4. Recent Developments
- 16.2.7.5. Financials (Based on Availability)
- 16.2.8 Azkoyen Group
- 16.2.8.1. Overview
- 16.2.8.2. Products
- 16.2.8.3. SWOT Analysis
- 16.2.8.4. Recent Developments
- 16.2.8.5. Financials (Based on Availability)
- 16.2.9 Advantech Co Limited
- 16.2.9.1. Overview
- 16.2.9.2. Products
- 16.2.9.3. SWOT Analysis
- 16.2.9.4. Recent Developments
- 16.2.9.5. Financials (Based on Availability)
- 16.2.10 ProtouchUK
- 16.2.10.1. Overview
- 16.2.10.2. Products
- 16.2.10.3. SWOT Analysis
- 16.2.10.4. Recent Developments
- 16.2.10.5. Financials (Based on Availability)
- 16.2.11 Zebra Technologies
- 16.2.11.1. Overview
- 16.2.11.2. Products
- 16.2.11.3. SWOT Analysis
- 16.2.11.4. Recent Developments
- 16.2.11.5. Financials (Based on Availability)
- 16.2.12 HESS Cash systems GmbH & Co
- 16.2.12.1. Overview
- 16.2.12.2. Products
- 16.2.12.3. SWOT Analysis
- 16.2.12.4. Recent Developments
- 16.2.12.5. Financials (Based on Availability)
- 16.2.13 Diebold Nixdorf
- 16.2.13.1. Overview
- 16.2.13.2. Products
- 16.2.13.3. SWOT Analysis
- 16.2.13.4. Recent Developments
- 16.2.13.5. Financials (Based on Availability)
- 16.2.14 Embross
- 16.2.14.1. Overview
- 16.2.14.2. Products
- 16.2.14.3. SWOT Analysis
- 16.2.14.4. Recent Developments
- 16.2.14.5. Financials (Based on Availability)
- 16.2.15 IER Group
- 16.2.15.1. Overview
- 16.2.15.2. Products
- 16.2.15.3. SWOT Analysis
- 16.2.15.4. Recent Developments
- 16.2.15.5. Financials (Based on Availability)
- 16.2.1 MaasInternationalEuropeB V*List Not Exhaustive
List of Figures
- Figure 1: Global Self-Serve Industry Revenue Breakdown (Million, %) by Region 2024 & 2032
- Figure 2: North America Self-Serve Industry Revenue (Million), by Country 2024 & 2032
- Figure 3: North America Self-Serve Industry Revenue Share (%), by Country 2024 & 2032
- Figure 4: Europe Self-Serve Industry Revenue (Million), by Country 2024 & 2032
- Figure 5: Europe Self-Serve Industry Revenue Share (%), by Country 2024 & 2032
- Figure 6: Asia Pacific Self-Serve Industry Revenue (Million), by Country 2024 & 2032
- Figure 7: Asia Pacific Self-Serve Industry Revenue Share (%), by Country 2024 & 2032
- Figure 8: South America Self-Serve Industry Revenue (Million), by Country 2024 & 2032
- Figure 9: South America Self-Serve Industry Revenue Share (%), by Country 2024 & 2032
- Figure 10: Middle East and Africa Self-Serve Industry Revenue (Million), by Country 2024 & 2032
- Figure 11: Middle East and Africa Self-Serve Industry Revenue Share (%), by Country 2024 & 2032
- Figure 12: North America Self-Serve Industry Revenue (Million), by Type 2024 & 2032
- Figure 13: North America Self-Serve Industry Revenue Share (%), by Type 2024 & 2032
- Figure 14: North America Self-Serve Industry Revenue (Million), by End-user 2024 & 2032
- Figure 15: North America Self-Serve Industry Revenue Share (%), by End-user 2024 & 2032
- Figure 16: North America Self-Serve Industry Revenue (Million), by Country 2024 & 2032
- Figure 17: North America Self-Serve Industry Revenue Share (%), by Country 2024 & 2032
- Figure 18: Europe Self-Serve Industry Revenue (Million), by Type 2024 & 2032
- Figure 19: Europe Self-Serve Industry Revenue Share (%), by Type 2024 & 2032
- Figure 20: Europe Self-Serve Industry Revenue (Million), by End-user 2024 & 2032
- Figure 21: Europe Self-Serve Industry Revenue Share (%), by End-user 2024 & 2032
- Figure 22: Europe Self-Serve Industry Revenue (Million), by Country 2024 & 2032
- Figure 23: Europe Self-Serve Industry Revenue Share (%), by Country 2024 & 2032
- Figure 24: Asia Pacific Self-Serve Industry Revenue (Million), by Type 2024 & 2032
- Figure 25: Asia Pacific Self-Serve Industry Revenue Share (%), by Type 2024 & 2032
- Figure 26: Asia Pacific Self-Serve Industry Revenue (Million), by End-user 2024 & 2032
- Figure 27: Asia Pacific Self-Serve Industry Revenue Share (%), by End-user 2024 & 2032
- Figure 28: Asia Pacific Self-Serve Industry Revenue (Million), by Country 2024 & 2032
- Figure 29: Asia Pacific Self-Serve Industry Revenue Share (%), by Country 2024 & 2032
- Figure 30: South America Self-Serve Industry Revenue (Million), by Type 2024 & 2032
- Figure 31: South America Self-Serve Industry Revenue Share (%), by Type 2024 & 2032
- Figure 32: South America Self-Serve Industry Revenue (Million), by End-user 2024 & 2032
- Figure 33: South America Self-Serve Industry Revenue Share (%), by End-user 2024 & 2032
- Figure 34: South America Self-Serve Industry Revenue (Million), by Country 2024 & 2032
- Figure 35: South America Self-Serve Industry Revenue Share (%), by Country 2024 & 2032
- Figure 36: Middle East and Africa Self-Serve Industry Revenue (Million), by Type 2024 & 2032
- Figure 37: Middle East and Africa Self-Serve Industry Revenue Share (%), by Type 2024 & 2032
- Figure 38: Middle East and Africa Self-Serve Industry Revenue (Million), by End-user 2024 & 2032
- Figure 39: Middle East and Africa Self-Serve Industry Revenue Share (%), by End-user 2024 & 2032
- Figure 40: Middle East and Africa Self-Serve Industry Revenue (Million), by Country 2024 & 2032
- Figure 41: Middle East and Africa Self-Serve Industry Revenue Share (%), by Country 2024 & 2032
List of Tables
- Table 1: Global Self-Serve Industry Revenue Million Forecast, by Region 2019 & 2032
- Table 2: Global Self-Serve Industry Revenue Million Forecast, by Type 2019 & 2032
- Table 3: Global Self-Serve Industry Revenue Million Forecast, by End-user 2019 & 2032
- Table 4: Global Self-Serve Industry Revenue Million Forecast, by Region 2019 & 2032
- Table 5: Global Self-Serve Industry Revenue Million Forecast, by Country 2019 & 2032
- Table 6: Self-Serve Industry Revenue (Million) Forecast, by Application 2019 & 2032
- Table 7: Global Self-Serve Industry Revenue Million Forecast, by Country 2019 & 2032
- Table 8: Self-Serve Industry Revenue (Million) Forecast, by Application 2019 & 2032
- Table 9: Global Self-Serve Industry Revenue Million Forecast, by Country 2019 & 2032
- Table 10: Self-Serve Industry Revenue (Million) Forecast, by Application 2019 & 2032
- Table 11: Global Self-Serve Industry Revenue Million Forecast, by Country 2019 & 2032
- Table 12: Self-Serve Industry Revenue (Million) Forecast, by Application 2019 & 2032
- Table 13: Global Self-Serve Industry Revenue Million Forecast, by Country 2019 & 2032
- Table 14: Self-Serve Industry Revenue (Million) Forecast, by Application 2019 & 2032
- Table 15: Global Self-Serve Industry Revenue Million Forecast, by Type 2019 & 2032
- Table 16: Global Self-Serve Industry Revenue Million Forecast, by End-user 2019 & 2032
- Table 17: Global Self-Serve Industry Revenue Million Forecast, by Country 2019 & 2032
- Table 18: Global Self-Serve Industry Revenue Million Forecast, by Type 2019 & 2032
- Table 19: Global Self-Serve Industry Revenue Million Forecast, by End-user 2019 & 2032
- Table 20: Global Self-Serve Industry Revenue Million Forecast, by Country 2019 & 2032
- Table 21: Global Self-Serve Industry Revenue Million Forecast, by Type 2019 & 2032
- Table 22: Global Self-Serve Industry Revenue Million Forecast, by End-user 2019 & 2032
- Table 23: Global Self-Serve Industry Revenue Million Forecast, by Country 2019 & 2032
- Table 24: Global Self-Serve Industry Revenue Million Forecast, by Type 2019 & 2032
- Table 25: Global Self-Serve Industry Revenue Million Forecast, by End-user 2019 & 2032
- Table 26: Global Self-Serve Industry Revenue Million Forecast, by Country 2019 & 2032
- Table 27: Global Self-Serve Industry Revenue Million Forecast, by Type 2019 & 2032
- Table 28: Global Self-Serve Industry Revenue Million Forecast, by End-user 2019 & 2032
- Table 29: Global Self-Serve Industry Revenue Million Forecast, by Country 2019 & 2032
Frequently Asked Questions
1. What is the projected Compound Annual Growth Rate (CAGR) of the Self-Serve Industry?
The projected CAGR is approximately 7.79%.
2. Which companies are prominent players in the Self-Serve Industry?
Key companies in the market include MaasInternationalEuropeB V*List Not Exhaustive, Fujitsu Ltd, Crane Co (USA), NCR Corporation, SEDCO, Frank Mayer & Associates Inc, Advanced Kiosks, Azkoyen Group, Advantech Co Limited, ProtouchUK, Zebra Technologies, HESS Cash systems GmbH & Co, Diebold Nixdorf, Embross, IER Group.
3. What are the main segments of the Self-Serve Industry?
The market segments include Type, End-user.
4. Can you provide details about the market size?
The market size is estimated to be USD 38.22 Million as of 2022.
5. What are some drivers contributing to market growth?
Growing emphasis on ensuring customer satisfaction to drive demand in the Retail & Food sector; High investments in the infrastructure developments (new & refurbishments) and smart city initiatives; Technological investments to enable greater support for the differently abled populace & new users.
6. What are the notable trends driving market growth?
Automated Teller Machine (ATM) to Witness the Growth.
7. Are there any restraints impacting market growth?
Cost and maintenance remains a key consideration.
8. Can you provide examples of recent developments in the market?
In Januray 2024 - NCR Corporation announced the launch of its Next Generation Self-Checkout Solution NCR Voyix commerce platform, WHere the NCR Voyix Next Generation Self-Checkout Solution is a significant evolution in the checkout experience for retailers and shoppers alike. It caters to changing shopper journeys, drives inclusion of demographics and payments, and provides an agile, modern software-as-a-service (SaaS) technology stack with a flexible, fabric-like hardware approach.
9. What pricing options are available for accessing the report?
Pricing options include single-user, multi-user, and enterprise licenses priced at USD 4750, USD 5250, and USD 8750 respectively.
10. Is the market size provided in terms of value or volume?
The market size is provided in terms of value, measured in Million.
11. Are there any specific market keywords associated with the report?
Yes, the market keyword associated with the report is "Self-Serve Industry," which aids in identifying and referencing the specific market segment covered.
12. How do I determine which pricing option suits my needs best?
The pricing options vary based on user requirements and access needs. Individual users may opt for single-user licenses, while businesses requiring broader access may choose multi-user or enterprise licenses for cost-effective access to the report.
13. Are there any additional resources or data provided in the Self-Serve Industry report?
While the report offers comprehensive insights, it's advisable to review the specific contents or supplementary materials provided to ascertain if additional resources or data are available.
14. How can I stay updated on further developments or reports in the Self-Serve Industry?
To stay informed about further developments, trends, and reports in the Self-Serve Industry, consider subscribing to industry newsletters, following relevant companies and organizations, or regularly checking reputable industry news sources and publications.
Methodology
Step 1 - Identification of Relevant Samples Size from Population Database


Step 2 - Approaches for Defining Global Market Size (Value, Volume* & Price*)

Note*: In applicable scenarios
Step 3 - Data Sources
Primary Research
- Web Analytics
- Survey Reports
- Research Institute
- Latest Research Reports
- Opinion Leaders
Secondary Research
- Annual Reports
- White Paper
- Latest Press Release
- Industry Association
- Paid Database
- Investor Presentations

Step 4 - Data Triangulation
Involves using different sources of information in order to increase the validity of a study
These sources are likely to be stakeholders in a program - participants, other researchers, program staff, other community members, and so on.
Then we put all data in single framework & apply various statistical tools to find out the dynamic on the market.
During the analysis stage, feedback from the stakeholder groups would be compared to determine areas of agreement as well as areas of divergence


