
Key Insights
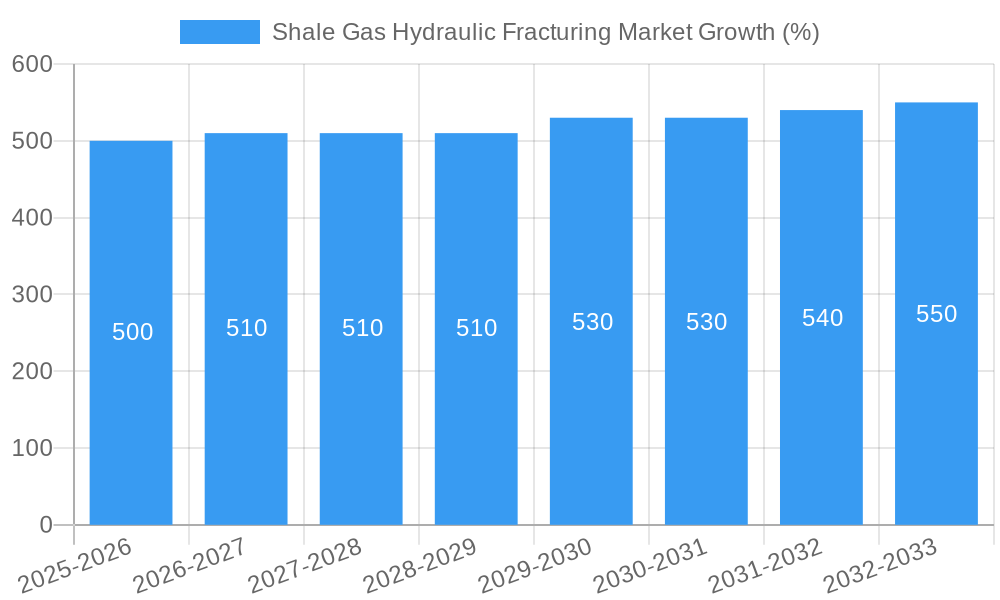
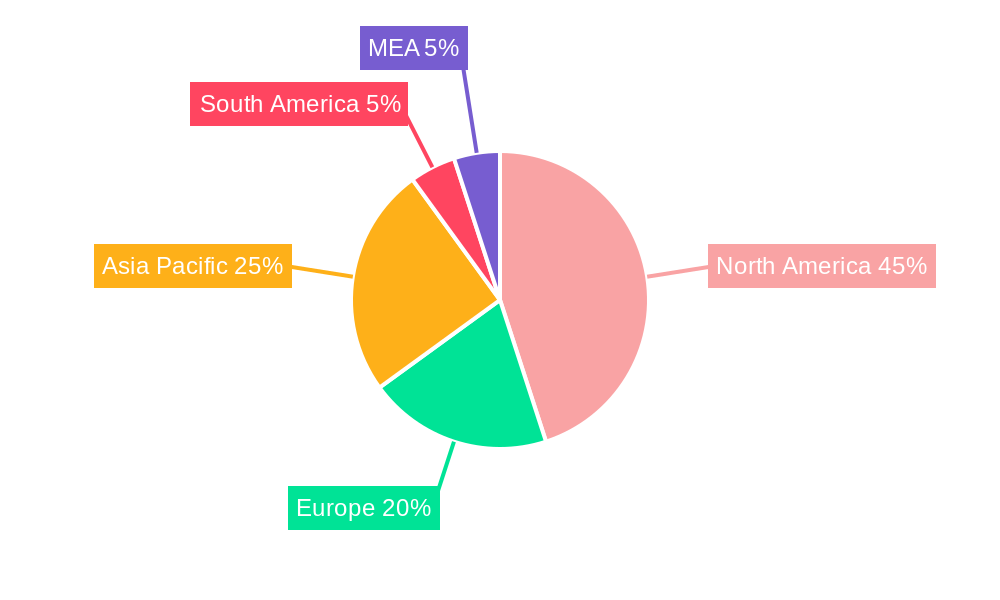
The global shale gas hydraulic fracturing market is experiencing robust growth, driven by the increasing demand for natural gas as a cleaner-burning fossil fuel and a transition fuel in the energy sector. A compound annual growth rate (CAGR) exceeding 2.00% indicates a steady expansion, projected to continue through 2033. Key drivers include advancements in fracturing technologies leading to improved efficiency and reduced environmental impact, coupled with supportive government policies in several regions aiming to enhance energy independence and security. The market is segmented by well type, with horizontal and directional wells dominating due to their higher yield compared to vertical wells. Major players such as Marathon Oil, CNPC, Royal Dutch Shell, ExxonMobil, Chevron, Sinopec, and BP are actively involved, investing significantly in research and development to optimize fracturing techniques and expand their operations across key geographical regions. North America, particularly the United States, currently holds a significant market share, owing to established infrastructure and abundant shale gas reserves. However, Asia Pacific, driven by China and India's growing energy demands, is expected to witness substantial growth in the coming years. While the industry faces challenges such as fluctuating energy prices, environmental concerns, and regulatory hurdles in some regions, the overall outlook remains positive, fueled by the persistent global need for energy and the ongoing technological advancements in shale gas extraction.
The market's growth trajectory is influenced by several factors. The continuous refinement of hydraulic fracturing techniques, including the use of advanced proppants and improved fluid management, is enhancing production efficiency and reducing operational costs. Furthermore, the increasing adoption of digital technologies for better data analysis and predictive modeling contributes to the optimization of fracturing operations, maximizing resource recovery. However, water usage concerns and potential environmental risks associated with hydraulic fracturing remain significant constraints. Addressing these challenges through stricter regulations, technological innovations, and responsible resource management will be crucial for sustainable market growth. The geographical distribution of shale gas reserves, coupled with regional governmental policies and investment strategies, will play a vital role in shaping the market's landscape in the forecast period.
Shale Gas Hydraulic Fracturing Market: A Comprehensive Report (2019-2033)
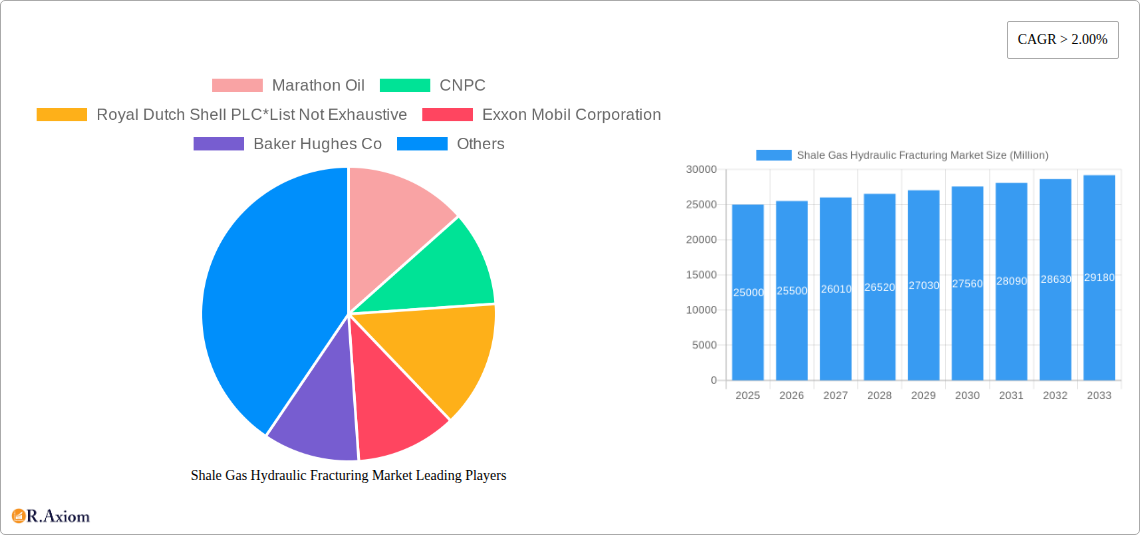
This comprehensive report provides a detailed analysis of the global Shale Gas Hydraulic Fracturing market, offering actionable insights for stakeholders across the value chain. The study covers the period 2019-2033, with 2025 as the base and estimated year, and a forecast period of 2025-2033. The report leverages extensive primary and secondary research to deliver a precise understanding of market dynamics, including growth drivers, challenges, and emerging opportunities. Key players such as Marathon Oil, CNPC, Royal Dutch Shell PLC, Exxon Mobil Corporation, Baker Hughes Co, ExxonMobil, Chevron Corporation, Sinopec Ltd, and BP PLC are analyzed, though this list is not exhaustive. The report segments the market by well type: Horizontal and Directional, and Vertical.
Shale Gas Hydraulic Fracturing Market Concentration & Innovation
The shale gas hydraulic fracturing market exhibits a moderately concentrated landscape, with a few major players holding significant market share. While precise market share figures for individual companies vary and are dependent on proprietary data, ExxonMobil and Chevron Corporation consistently maintain substantial positions, driven by their extensive upstream operations and technological capabilities. The market is characterized by intense competition, with companies vying for market share through technological innovation, strategic partnerships, and mergers and acquisitions (M&A). M&A activity in the sector has seen deal values exceeding $xx Million in recent years, mainly focused on consolidating resources and enhancing technological portfolios.
- Market Concentration: Moderate to High
- Innovation Drivers: Technological advancements in fracturing fluids, improved well completion techniques, and data analytics.
- Regulatory Frameworks: Stringent environmental regulations and permitting processes significantly impact market growth and investment decisions. The fluctuating regulatory landscape adds complexity and risk to market projections.
- Product Substitutes: Limited direct substitutes exist, but advancements in other unconventional gas extraction methods could pose indirect competition.
- End-User Trends: Increased demand for natural gas globally is a major driver, while concerns regarding environmental impact are a significant challenge.
- M&A Activities: Significant M&A activity is seen, with several billion-dollar transactions occurring during the study period.
Shale Gas Hydraulic Fracturing Market Industry Trends & Insights
The shale gas hydraulic fracturing market is characterized by robust growth, driven by a surge in global natural gas demand. The Compound Annual Growth Rate (CAGR) is projected to reach xx% during the forecast period (2025-2033). Technological advancements, such as the adoption of high-density fracking, improve extraction efficiency and reduce costs. While the market penetration rate for shale gas in certain regions is already high, further expansion is anticipated in developing economies. However, fluctuations in energy prices, environmental concerns, and regulatory uncertainties represent significant challenges to market growth. Competitive dynamics are intense, with companies focusing on improving operational efficiency, lowering costs, and enhancing technological capabilities to maintain a competitive edge. Market penetration rates will vary significantly based on local regulations, geological conditions, and infrastructure availability.
Dominant Markets & Segments in Shale Gas Hydraulic Fracturing Market
The North American market, particularly the United States, dominates the global shale gas hydraulic fracturing market. This dominance is attributed to several factors:
- Abundant Shale Gas Reserves: The US possesses vast shale gas reserves, providing a significant resource base for extraction.
- Advanced Technology & Expertise: The North American region has accumulated considerable expertise in shale gas exploration and production technologies.
- Supportive Regulatory Environment (relative to other regions): While facing environmental concerns, the regulatory environment has allowed for significant development relative to other regions with stricter regulations.
- Well-Developed Infrastructure: Existing infrastructure for transportation and processing of natural gas facilitates market expansion.
Segment Dominance: The Horizontal and Directional well type segment significantly outweighs the Vertical well type segment in terms of market share, due to its higher productivity and extraction efficiency. This trend is projected to continue during the forecast period.
Shale Gas Hydraulic Fracturing Market Product Developments
Recent product innovations focus on enhanced fracturing fluids, advanced completion techniques, and data-driven optimization to improve well productivity and reduce environmental impact. This includes the development of environmentally friendly fracturing fluids and the adoption of digital technologies for real-time monitoring and control of the fracturing process. These advancements aim to enhance efficiency, reduce costs, and mitigate environmental concerns.
Report Scope & Segmentation Analysis
This report segments the shale gas hydraulic fracturing market primarily by well type:
Horizontal and Directional: This segment accounts for the majority of the market and is projected to experience substantial growth, driven by its higher extraction efficiency. The competitive landscape is characterized by intense competition, with companies focusing on technological innovation and cost optimization.
Vertical: This segment represents a smaller share of the market and is expected to experience relatively slower growth compared to the horizontal and directional segment. However, vertical drilling remains crucial in certain geological settings and operational scenarios.
Key Drivers of Shale Gas Hydraulic Fracturing Market Growth
The shale gas hydraulic fracturing market's growth is driven by several factors:
- Rising Global Energy Demand: The increasing global demand for natural gas fuels the need for efficient extraction methods.
- Technological Advancements: Improved fracturing techniques and data analytics are enhancing extraction efficiency and reducing costs.
- Government Incentives & Support: Government policies promoting domestic energy production incentivize shale gas development.
Challenges in the Shale Gas Hydraulic Fracturing Market Sector
The shale gas hydraulic fracturing industry faces significant challenges, including:
- Environmental Concerns: Concerns regarding water usage, air emissions, and induced seismicity pose regulatory hurdles and public opposition. This has led to increased costs and delays in project implementation.
- Fluctuating Energy Prices: The volatile nature of energy prices creates uncertainty in investment decisions and profitability.
- Supply Chain Disruptions: Disruptions in the supply of equipment and materials can impede project execution and increase costs.
Emerging Opportunities in Shale Gas Hydraulic Fracturing Market
Emerging opportunities in the shale gas hydraulic fracturing market include:
- Expansion into New Regions: Untapped shale gas reserves in emerging markets present significant growth potential.
- Development of Sustainable Technologies: Advancements in environmentally friendly fracturing fluids and waste management solutions are crucial for mitigating environmental concerns and gaining social acceptance.
- Digitalization & Automation: The increased adoption of data analytics and automation in well design and operation improves efficiency and reduces operational costs.
Leading Players in the Shale Gas Hydraulic Fracturing Market Market
- Marathon Oil
- CNPC
- Royal Dutch Shell PLC
- Exxon Mobil Corporation
- Baker Hughes Co
- ExxonMobil
- Chevron Corporation
- Sinopec Ltd
- BP PLC
Key Developments in Shale Gas Hydraulic Fracturing Market Industry
- 2022-03: ExxonMobil announces a major expansion of its shale gas operations in the Permian Basin.
- 2021-10: Chevron Corporation invests in advanced fracturing technology to improve efficiency and reduce environmental impact.
- 2020-05: Several major players form strategic partnerships to develop new technologies in shale gas extraction. (Specific details of these partnerships would need to be filled in)
Strategic Outlook for Shale Gas Hydraulic Fracturing Market Market
The shale gas hydraulic fracturing market is poised for sustained growth over the next decade, driven by rising global energy demand and continued technological advancements. Companies that can effectively manage environmental concerns, optimize operational costs, and adopt innovative technologies will be best positioned to capitalize on emerging opportunities. Focus on sustainability and efficiency will become increasingly important for maintaining market competitiveness and securing long-term growth.
Shale Gas Hydraulic Fracturing Market Segmentation
-
1. Well Type
- 1.1. Horizontal and Directional
- 1.2. Vertical
Shale Gas Hydraulic Fracturing Market Segmentation By Geography
- 1. North America
- 2. Asia Pacific
- 3. Europe
- 4. South America
- 5. Middle East and Africa
Shale Gas Hydraulic Fracturing Market REPORT HIGHLIGHTS
| Aspects | Details |
|---|---|
| Study Period | 2019-2033 |
| Base Year | 2024 |
| Estimated Year | 2025 |
| Forecast Period | 2025-2033 |
| Historical Period | 2019-2024 |
| Growth Rate | CAGR of > 2.00% from 2019-2033 |
| Segmentation |
|
Table of Contents
- 1. Introduction
- 1.1. Research Scope
- 1.2. Market Segmentation
- 1.3. Research Methodology
- 1.4. Definitions and Assumptions
- 2. Executive Summary
- 2.1. Introduction
- 3. Market Dynamics
- 3.1. Introduction
- 3.2. Market Drivers
- 3.2.1. Increasing Demand from Industrial Applications4.; Growing Infrastructure Across the World
- 3.3. Market Restrains
- 3.3.1. A Rise in Concerns Related to Carbon Emissions and a Shift Towards Electric Vehicles and Renewable Sources of Energy
- 3.4. Market Trends
- 3.4.1. Horizontal and Directional Well Type to Witness a Significant Growth
- 4. Market Factor Analysis
- 4.1. Porters Five Forces
- 4.2. Supply/Value Chain
- 4.3. PESTEL analysis
- 4.4. Market Entropy
- 4.5. Patent/Trademark Analysis
- 5. Global Shale Gas Hydraulic Fracturing Market Analysis, Insights and Forecast, 2019-2031
- 5.1. Market Analysis, Insights and Forecast - by Well Type
- 5.1.1. Horizontal and Directional
- 5.1.2. Vertical
- 5.2. Market Analysis, Insights and Forecast - by Region
- 5.2.1. North America
- 5.2.2. Asia Pacific
- 5.2.3. Europe
- 5.2.4. South America
- 5.2.5. Middle East and Africa
- 5.1. Market Analysis, Insights and Forecast - by Well Type
- 6. North America Shale Gas Hydraulic Fracturing Market Analysis, Insights and Forecast, 2019-2031
- 6.1. Market Analysis, Insights and Forecast - by Well Type
- 6.1.1. Horizontal and Directional
- 6.1.2. Vertical
- 6.1. Market Analysis, Insights and Forecast - by Well Type
- 7. Asia Pacific Shale Gas Hydraulic Fracturing Market Analysis, Insights and Forecast, 2019-2031
- 7.1. Market Analysis, Insights and Forecast - by Well Type
- 7.1.1. Horizontal and Directional
- 7.1.2. Vertical
- 7.1. Market Analysis, Insights and Forecast - by Well Type
- 8. Europe Shale Gas Hydraulic Fracturing Market Analysis, Insights and Forecast, 2019-2031
- 8.1. Market Analysis, Insights and Forecast - by Well Type
- 8.1.1. Horizontal and Directional
- 8.1.2. Vertical
- 8.1. Market Analysis, Insights and Forecast - by Well Type
- 9. South America Shale Gas Hydraulic Fracturing Market Analysis, Insights and Forecast, 2019-2031
- 9.1. Market Analysis, Insights and Forecast - by Well Type
- 9.1.1. Horizontal and Directional
- 9.1.2. Vertical
- 9.1. Market Analysis, Insights and Forecast - by Well Type
- 10. Middle East and Africa Shale Gas Hydraulic Fracturing Market Analysis, Insights and Forecast, 2019-2031
- 10.1. Market Analysis, Insights and Forecast - by Well Type
- 10.1.1. Horizontal and Directional
- 10.1.2. Vertical
- 10.1. Market Analysis, Insights and Forecast - by Well Type
- 11. North America Shale Gas Hydraulic Fracturing Market Analysis, Insights and Forecast, 2019-2031
- 11.1. Market Analysis, Insights and Forecast - By Country/Sub-region
- 11.1.1 United States
- 11.1.2 Canada
- 11.1.3 Mexico
- 12. Europe Shale Gas Hydraulic Fracturing Market Analysis, Insights and Forecast, 2019-2031
- 12.1. Market Analysis, Insights and Forecast - By Country/Sub-region
- 12.1.1 Germany
- 12.1.2 United Kingdom
- 12.1.3 France
- 12.1.4 Spain
- 12.1.5 Italy
- 12.1.6 Spain
- 12.1.7 Belgium
- 12.1.8 Netherland
- 12.1.9 Nordics
- 12.1.10 Rest of Europe
- 13. Asia Pacific Shale Gas Hydraulic Fracturing Market Analysis, Insights and Forecast, 2019-2031
- 13.1. Market Analysis, Insights and Forecast - By Country/Sub-region
- 13.1.1 China
- 13.1.2 Japan
- 13.1.3 India
- 13.1.4 South Korea
- 13.1.5 Southeast Asia
- 13.1.6 Australia
- 13.1.7 Indonesia
- 13.1.8 Phillipes
- 13.1.9 Singapore
- 13.1.10 Thailandc
- 13.1.11 Rest of Asia Pacific
- 14. South America Shale Gas Hydraulic Fracturing Market Analysis, Insights and Forecast, 2019-2031
- 14.1. Market Analysis, Insights and Forecast - By Country/Sub-region
- 14.1.1 Brazil
- 14.1.2 Argentina
- 14.1.3 Peru
- 14.1.4 Chile
- 14.1.5 Colombia
- 14.1.6 Ecuador
- 14.1.7 Venezuela
- 14.1.8 Rest of South America
- 15. North America Shale Gas Hydraulic Fracturing Market Analysis, Insights and Forecast, 2019-2031
- 15.1. Market Analysis, Insights and Forecast - By Country/Sub-region
- 15.1.1 United States
- 15.1.2 Canada
- 15.1.3 Mexico
- 16. MEA Shale Gas Hydraulic Fracturing Market Analysis, Insights and Forecast, 2019-2031
- 16.1. Market Analysis, Insights and Forecast - By Country/Sub-region
- 16.1.1 United Arab Emirates
- 16.1.2 Saudi Arabia
- 16.1.3 South Africa
- 16.1.4 Rest of Middle East and Africa
- 17. Competitive Analysis
- 17.1. Global Market Share Analysis 2024
- 17.2. Company Profiles
- 17.2.1 Marathon Oil
- 17.2.1.1. Overview
- 17.2.1.2. Products
- 17.2.1.3. SWOT Analysis
- 17.2.1.4. Recent Developments
- 17.2.1.5. Financials (Based on Availability)
- 17.2.2 CNPC
- 17.2.2.1. Overview
- 17.2.2.2. Products
- 17.2.2.3. SWOT Analysis
- 17.2.2.4. Recent Developments
- 17.2.2.5. Financials (Based on Availability)
- 17.2.3 Royal Dutch Shell PLC*List Not Exhaustive
- 17.2.3.1. Overview
- 17.2.3.2. Products
- 17.2.3.3. SWOT Analysis
- 17.2.3.4. Recent Developments
- 17.2.3.5. Financials (Based on Availability)
- 17.2.4 Exxon Mobil Corporation
- 17.2.4.1. Overview
- 17.2.4.2. Products
- 17.2.4.3. SWOT Analysis
- 17.2.4.4. Recent Developments
- 17.2.4.5. Financials (Based on Availability)
- 17.2.5 Baker Hughes Co
- 17.2.5.1. Overview
- 17.2.5.2. Products
- 17.2.5.3. SWOT Analysis
- 17.2.5.4. Recent Developments
- 17.2.5.5. Financials (Based on Availability)
- 17.2.6 ExxonMobil
- 17.2.6.1. Overview
- 17.2.6.2. Products
- 17.2.6.3. SWOT Analysis
- 17.2.6.4. Recent Developments
- 17.2.6.5. Financials (Based on Availability)
- 17.2.7 Chevron Corporation
- 17.2.7.1. Overview
- 17.2.7.2. Products
- 17.2.7.3. SWOT Analysis
- 17.2.7.4. Recent Developments
- 17.2.7.5. Financials (Based on Availability)
- 17.2.8 Sinopec Ltd
- 17.2.8.1. Overview
- 17.2.8.2. Products
- 17.2.8.3. SWOT Analysis
- 17.2.8.4. Recent Developments
- 17.2.8.5. Financials (Based on Availability)
- 17.2.9 BP PLC
- 17.2.9.1. Overview
- 17.2.9.2. Products
- 17.2.9.3. SWOT Analysis
- 17.2.9.4. Recent Developments
- 17.2.9.5. Financials (Based on Availability)
- 17.2.1 Marathon Oil
List of Figures
- Figure 1: Global Shale Gas Hydraulic Fracturing Market Revenue Breakdown (Million, %) by Region 2024 & 2032
- Figure 2: Global Shale Gas Hydraulic Fracturing Market Volume Breakdown (metric tonnes, %) by Region 2024 & 2032
- Figure 3: North America Shale Gas Hydraulic Fracturing Market Revenue (Million), by Country 2024 & 2032
- Figure 4: North America Shale Gas Hydraulic Fracturing Market Volume (metric tonnes), by Country 2024 & 2032
- Figure 5: North America Shale Gas Hydraulic Fracturing Market Revenue Share (%), by Country 2024 & 2032
- Figure 6: North America Shale Gas Hydraulic Fracturing Market Volume Share (%), by Country 2024 & 2032
- Figure 7: Europe Shale Gas Hydraulic Fracturing Market Revenue (Million), by Country 2024 & 2032
- Figure 8: Europe Shale Gas Hydraulic Fracturing Market Volume (metric tonnes), by Country 2024 & 2032
- Figure 9: Europe Shale Gas Hydraulic Fracturing Market Revenue Share (%), by Country 2024 & 2032
- Figure 10: Europe Shale Gas Hydraulic Fracturing Market Volume Share (%), by Country 2024 & 2032
- Figure 11: Asia Pacific Shale Gas Hydraulic Fracturing Market Revenue (Million), by Country 2024 & 2032
- Figure 12: Asia Pacific Shale Gas Hydraulic Fracturing Market Volume (metric tonnes), by Country 2024 & 2032
- Figure 13: Asia Pacific Shale Gas Hydraulic Fracturing Market Revenue Share (%), by Country 2024 & 2032
- Figure 14: Asia Pacific Shale Gas Hydraulic Fracturing Market Volume Share (%), by Country 2024 & 2032
- Figure 15: South America Shale Gas Hydraulic Fracturing Market Revenue (Million), by Country 2024 & 2032
- Figure 16: South America Shale Gas Hydraulic Fracturing Market Volume (metric tonnes), by Country 2024 & 2032
- Figure 17: South America Shale Gas Hydraulic Fracturing Market Revenue Share (%), by Country 2024 & 2032
- Figure 18: South America Shale Gas Hydraulic Fracturing Market Volume Share (%), by Country 2024 & 2032
- Figure 19: North America Shale Gas Hydraulic Fracturing Market Revenue (Million), by Country 2024 & 2032
- Figure 20: North America Shale Gas Hydraulic Fracturing Market Volume (metric tonnes), by Country 2024 & 2032
- Figure 21: North America Shale Gas Hydraulic Fracturing Market Revenue Share (%), by Country 2024 & 2032
- Figure 22: North America Shale Gas Hydraulic Fracturing Market Volume Share (%), by Country 2024 & 2032
- Figure 23: MEA Shale Gas Hydraulic Fracturing Market Revenue (Million), by Country 2024 & 2032
- Figure 24: MEA Shale Gas Hydraulic Fracturing Market Volume (metric tonnes), by Country 2024 & 2032
- Figure 25: MEA Shale Gas Hydraulic Fracturing Market Revenue Share (%), by Country 2024 & 2032
- Figure 26: MEA Shale Gas Hydraulic Fracturing Market Volume Share (%), by Country 2024 & 2032
- Figure 27: North America Shale Gas Hydraulic Fracturing Market Revenue (Million), by Well Type 2024 & 2032
- Figure 28: North America Shale Gas Hydraulic Fracturing Market Volume (metric tonnes), by Well Type 2024 & 2032
- Figure 29: North America Shale Gas Hydraulic Fracturing Market Revenue Share (%), by Well Type 2024 & 2032
- Figure 30: North America Shale Gas Hydraulic Fracturing Market Volume Share (%), by Well Type 2024 & 2032
- Figure 31: North America Shale Gas Hydraulic Fracturing Market Revenue (Million), by Country 2024 & 2032
- Figure 32: North America Shale Gas Hydraulic Fracturing Market Volume (metric tonnes), by Country 2024 & 2032
- Figure 33: North America Shale Gas Hydraulic Fracturing Market Revenue Share (%), by Country 2024 & 2032
- Figure 34: North America Shale Gas Hydraulic Fracturing Market Volume Share (%), by Country 2024 & 2032
- Figure 35: Asia Pacific Shale Gas Hydraulic Fracturing Market Revenue (Million), by Well Type 2024 & 2032
- Figure 36: Asia Pacific Shale Gas Hydraulic Fracturing Market Volume (metric tonnes), by Well Type 2024 & 2032
- Figure 37: Asia Pacific Shale Gas Hydraulic Fracturing Market Revenue Share (%), by Well Type 2024 & 2032
- Figure 38: Asia Pacific Shale Gas Hydraulic Fracturing Market Volume Share (%), by Well Type 2024 & 2032
- Figure 39: Asia Pacific Shale Gas Hydraulic Fracturing Market Revenue (Million), by Country 2024 & 2032
- Figure 40: Asia Pacific Shale Gas Hydraulic Fracturing Market Volume (metric tonnes), by Country 2024 & 2032
- Figure 41: Asia Pacific Shale Gas Hydraulic Fracturing Market Revenue Share (%), by Country 2024 & 2032
- Figure 42: Asia Pacific Shale Gas Hydraulic Fracturing Market Volume Share (%), by Country 2024 & 2032
- Figure 43: Europe Shale Gas Hydraulic Fracturing Market Revenue (Million), by Well Type 2024 & 2032
- Figure 44: Europe Shale Gas Hydraulic Fracturing Market Volume (metric tonnes), by Well Type 2024 & 2032
- Figure 45: Europe Shale Gas Hydraulic Fracturing Market Revenue Share (%), by Well Type 2024 & 2032
- Figure 46: Europe Shale Gas Hydraulic Fracturing Market Volume Share (%), by Well Type 2024 & 2032
- Figure 47: Europe Shale Gas Hydraulic Fracturing Market Revenue (Million), by Country 2024 & 2032
- Figure 48: Europe Shale Gas Hydraulic Fracturing Market Volume (metric tonnes), by Country 2024 & 2032
- Figure 49: Europe Shale Gas Hydraulic Fracturing Market Revenue Share (%), by Country 2024 & 2032
- Figure 50: Europe Shale Gas Hydraulic Fracturing Market Volume Share (%), by Country 2024 & 2032
- Figure 51: South America Shale Gas Hydraulic Fracturing Market Revenue (Million), by Well Type 2024 & 2032
- Figure 52: South America Shale Gas Hydraulic Fracturing Market Volume (metric tonnes), by Well Type 2024 & 2032
- Figure 53: South America Shale Gas Hydraulic Fracturing Market Revenue Share (%), by Well Type 2024 & 2032
- Figure 54: South America Shale Gas Hydraulic Fracturing Market Volume Share (%), by Well Type 2024 & 2032
- Figure 55: South America Shale Gas Hydraulic Fracturing Market Revenue (Million), by Country 2024 & 2032
- Figure 56: South America Shale Gas Hydraulic Fracturing Market Volume (metric tonnes), by Country 2024 & 2032
- Figure 57: South America Shale Gas Hydraulic Fracturing Market Revenue Share (%), by Country 2024 & 2032
- Figure 58: South America Shale Gas Hydraulic Fracturing Market Volume Share (%), by Country 2024 & 2032
- Figure 59: Middle East and Africa Shale Gas Hydraulic Fracturing Market Revenue (Million), by Well Type 2024 & 2032
- Figure 60: Middle East and Africa Shale Gas Hydraulic Fracturing Market Volume (metric tonnes), by Well Type 2024 & 2032
- Figure 61: Middle East and Africa Shale Gas Hydraulic Fracturing Market Revenue Share (%), by Well Type 2024 & 2032
- Figure 62: Middle East and Africa Shale Gas Hydraulic Fracturing Market Volume Share (%), by Well Type 2024 & 2032
- Figure 63: Middle East and Africa Shale Gas Hydraulic Fracturing Market Revenue (Million), by Country 2024 & 2032
- Figure 64: Middle East and Africa Shale Gas Hydraulic Fracturing Market Volume (metric tonnes), by Country 2024 & 2032
- Figure 65: Middle East and Africa Shale Gas Hydraulic Fracturing Market Revenue Share (%), by Country 2024 & 2032
- Figure 66: Middle East and Africa Shale Gas Hydraulic Fracturing Market Volume Share (%), by Country 2024 & 2032
List of Tables
- Table 1: Global Shale Gas Hydraulic Fracturing Market Revenue Million Forecast, by Region 2019 & 2032
- Table 2: Global Shale Gas Hydraulic Fracturing Market Volume metric tonnes Forecast, by Region 2019 & 2032
- Table 3: Global Shale Gas Hydraulic Fracturing Market Revenue Million Forecast, by Well Type 2019 & 2032
- Table 4: Global Shale Gas Hydraulic Fracturing Market Volume metric tonnes Forecast, by Well Type 2019 & 2032
- Table 5: Global Shale Gas Hydraulic Fracturing Market Revenue Million Forecast, by Region 2019 & 2032
- Table 6: Global Shale Gas Hydraulic Fracturing Market Volume metric tonnes Forecast, by Region 2019 & 2032
- Table 7: Global Shale Gas Hydraulic Fracturing Market Revenue Million Forecast, by Country 2019 & 2032
- Table 8: Global Shale Gas Hydraulic Fracturing Market Volume metric tonnes Forecast, by Country 2019 & 2032
- Table 9: United States Shale Gas Hydraulic Fracturing Market Revenue (Million) Forecast, by Application 2019 & 2032
- Table 10: United States Shale Gas Hydraulic Fracturing Market Volume (metric tonnes) Forecast, by Application 2019 & 2032
- Table 11: Canada Shale Gas Hydraulic Fracturing Market Revenue (Million) Forecast, by Application 2019 & 2032
- Table 12: Canada Shale Gas Hydraulic Fracturing Market Volume (metric tonnes) Forecast, by Application 2019 & 2032
- Table 13: Mexico Shale Gas Hydraulic Fracturing Market Revenue (Million) Forecast, by Application 2019 & 2032
- Table 14: Mexico Shale Gas Hydraulic Fracturing Market Volume (metric tonnes) Forecast, by Application 2019 & 2032
- Table 15: Global Shale Gas Hydraulic Fracturing Market Revenue Million Forecast, by Country 2019 & 2032
- Table 16: Global Shale Gas Hydraulic Fracturing Market Volume metric tonnes Forecast, by Country 2019 & 2032
- Table 17: Germany Shale Gas Hydraulic Fracturing Market Revenue (Million) Forecast, by Application 2019 & 2032
- Table 18: Germany Shale Gas Hydraulic Fracturing Market Volume (metric tonnes) Forecast, by Application 2019 & 2032
- Table 19: United Kingdom Shale Gas Hydraulic Fracturing Market Revenue (Million) Forecast, by Application 2019 & 2032
- Table 20: United Kingdom Shale Gas Hydraulic Fracturing Market Volume (metric tonnes) Forecast, by Application 2019 & 2032
- Table 21: France Shale Gas Hydraulic Fracturing Market Revenue (Million) Forecast, by Application 2019 & 2032
- Table 22: France Shale Gas Hydraulic Fracturing Market Volume (metric tonnes) Forecast, by Application 2019 & 2032
- Table 23: Spain Shale Gas Hydraulic Fracturing Market Revenue (Million) Forecast, by Application 2019 & 2032
- Table 24: Spain Shale Gas Hydraulic Fracturing Market Volume (metric tonnes) Forecast, by Application 2019 & 2032
- Table 25: Italy Shale Gas Hydraulic Fracturing Market Revenue (Million) Forecast, by Application 2019 & 2032
- Table 26: Italy Shale Gas Hydraulic Fracturing Market Volume (metric tonnes) Forecast, by Application 2019 & 2032
- Table 27: Spain Shale Gas Hydraulic Fracturing Market Revenue (Million) Forecast, by Application 2019 & 2032
- Table 28: Spain Shale Gas Hydraulic Fracturing Market Volume (metric tonnes) Forecast, by Application 2019 & 2032
- Table 29: Belgium Shale Gas Hydraulic Fracturing Market Revenue (Million) Forecast, by Application 2019 & 2032
- Table 30: Belgium Shale Gas Hydraulic Fracturing Market Volume (metric tonnes) Forecast, by Application 2019 & 2032
- Table 31: Netherland Shale Gas Hydraulic Fracturing Market Revenue (Million) Forecast, by Application 2019 & 2032
- Table 32: Netherland Shale Gas Hydraulic Fracturing Market Volume (metric tonnes) Forecast, by Application 2019 & 2032
- Table 33: Nordics Shale Gas Hydraulic Fracturing Market Revenue (Million) Forecast, by Application 2019 & 2032
- Table 34: Nordics Shale Gas Hydraulic Fracturing Market Volume (metric tonnes) Forecast, by Application 2019 & 2032
- Table 35: Rest of Europe Shale Gas Hydraulic Fracturing Market Revenue (Million) Forecast, by Application 2019 & 2032
- Table 36: Rest of Europe Shale Gas Hydraulic Fracturing Market Volume (metric tonnes) Forecast, by Application 2019 & 2032
- Table 37: Global Shale Gas Hydraulic Fracturing Market Revenue Million Forecast, by Country 2019 & 2032
- Table 38: Global Shale Gas Hydraulic Fracturing Market Volume metric tonnes Forecast, by Country 2019 & 2032
- Table 39: China Shale Gas Hydraulic Fracturing Market Revenue (Million) Forecast, by Application 2019 & 2032
- Table 40: China Shale Gas Hydraulic Fracturing Market Volume (metric tonnes) Forecast, by Application 2019 & 2032
- Table 41: Japan Shale Gas Hydraulic Fracturing Market Revenue (Million) Forecast, by Application 2019 & 2032
- Table 42: Japan Shale Gas Hydraulic Fracturing Market Volume (metric tonnes) Forecast, by Application 2019 & 2032
- Table 43: India Shale Gas Hydraulic Fracturing Market Revenue (Million) Forecast, by Application 2019 & 2032
- Table 44: India Shale Gas Hydraulic Fracturing Market Volume (metric tonnes) Forecast, by Application 2019 & 2032
- Table 45: South Korea Shale Gas Hydraulic Fracturing Market Revenue (Million) Forecast, by Application 2019 & 2032
- Table 46: South Korea Shale Gas Hydraulic Fracturing Market Volume (metric tonnes) Forecast, by Application 2019 & 2032
- Table 47: Southeast Asia Shale Gas Hydraulic Fracturing Market Revenue (Million) Forecast, by Application 2019 & 2032
- Table 48: Southeast Asia Shale Gas Hydraulic Fracturing Market Volume (metric tonnes) Forecast, by Application 2019 & 2032
- Table 49: Australia Shale Gas Hydraulic Fracturing Market Revenue (Million) Forecast, by Application 2019 & 2032
- Table 50: Australia Shale Gas Hydraulic Fracturing Market Volume (metric tonnes) Forecast, by Application 2019 & 2032
- Table 51: Indonesia Shale Gas Hydraulic Fracturing Market Revenue (Million) Forecast, by Application 2019 & 2032
- Table 52: Indonesia Shale Gas Hydraulic Fracturing Market Volume (metric tonnes) Forecast, by Application 2019 & 2032
- Table 53: Phillipes Shale Gas Hydraulic Fracturing Market Revenue (Million) Forecast, by Application 2019 & 2032
- Table 54: Phillipes Shale Gas Hydraulic Fracturing Market Volume (metric tonnes) Forecast, by Application 2019 & 2032
- Table 55: Singapore Shale Gas Hydraulic Fracturing Market Revenue (Million) Forecast, by Application 2019 & 2032
- Table 56: Singapore Shale Gas Hydraulic Fracturing Market Volume (metric tonnes) Forecast, by Application 2019 & 2032
- Table 57: Thailandc Shale Gas Hydraulic Fracturing Market Revenue (Million) Forecast, by Application 2019 & 2032
- Table 58: Thailandc Shale Gas Hydraulic Fracturing Market Volume (metric tonnes) Forecast, by Application 2019 & 2032
- Table 59: Rest of Asia Pacific Shale Gas Hydraulic Fracturing Market Revenue (Million) Forecast, by Application 2019 & 2032
- Table 60: Rest of Asia Pacific Shale Gas Hydraulic Fracturing Market Volume (metric tonnes) Forecast, by Application 2019 & 2032
- Table 61: Global Shale Gas Hydraulic Fracturing Market Revenue Million Forecast, by Country 2019 & 2032
- Table 62: Global Shale Gas Hydraulic Fracturing Market Volume metric tonnes Forecast, by Country 2019 & 2032
- Table 63: Brazil Shale Gas Hydraulic Fracturing Market Revenue (Million) Forecast, by Application 2019 & 2032
- Table 64: Brazil Shale Gas Hydraulic Fracturing Market Volume (metric tonnes) Forecast, by Application 2019 & 2032
- Table 65: Argentina Shale Gas Hydraulic Fracturing Market Revenue (Million) Forecast, by Application 2019 & 2032
- Table 66: Argentina Shale Gas Hydraulic Fracturing Market Volume (metric tonnes) Forecast, by Application 2019 & 2032
- Table 67: Peru Shale Gas Hydraulic Fracturing Market Revenue (Million) Forecast, by Application 2019 & 2032
- Table 68: Peru Shale Gas Hydraulic Fracturing Market Volume (metric tonnes) Forecast, by Application 2019 & 2032
- Table 69: Chile Shale Gas Hydraulic Fracturing Market Revenue (Million) Forecast, by Application 2019 & 2032
- Table 70: Chile Shale Gas Hydraulic Fracturing Market Volume (metric tonnes) Forecast, by Application 2019 & 2032
- Table 71: Colombia Shale Gas Hydraulic Fracturing Market Revenue (Million) Forecast, by Application 2019 & 2032
- Table 72: Colombia Shale Gas Hydraulic Fracturing Market Volume (metric tonnes) Forecast, by Application 2019 & 2032
- Table 73: Ecuador Shale Gas Hydraulic Fracturing Market Revenue (Million) Forecast, by Application 2019 & 2032
- Table 74: Ecuador Shale Gas Hydraulic Fracturing Market Volume (metric tonnes) Forecast, by Application 2019 & 2032
- Table 75: Venezuela Shale Gas Hydraulic Fracturing Market Revenue (Million) Forecast, by Application 2019 & 2032
- Table 76: Venezuela Shale Gas Hydraulic Fracturing Market Volume (metric tonnes) Forecast, by Application 2019 & 2032
- Table 77: Rest of South America Shale Gas Hydraulic Fracturing Market Revenue (Million) Forecast, by Application 2019 & 2032
- Table 78: Rest of South America Shale Gas Hydraulic Fracturing Market Volume (metric tonnes) Forecast, by Application 2019 & 2032
- Table 79: Global Shale Gas Hydraulic Fracturing Market Revenue Million Forecast, by Country 2019 & 2032
- Table 80: Global Shale Gas Hydraulic Fracturing Market Volume metric tonnes Forecast, by Country 2019 & 2032
- Table 81: United States Shale Gas Hydraulic Fracturing Market Revenue (Million) Forecast, by Application 2019 & 2032
- Table 82: United States Shale Gas Hydraulic Fracturing Market Volume (metric tonnes) Forecast, by Application 2019 & 2032
- Table 83: Canada Shale Gas Hydraulic Fracturing Market Revenue (Million) Forecast, by Application 2019 & 2032
- Table 84: Canada Shale Gas Hydraulic Fracturing Market Volume (metric tonnes) Forecast, by Application 2019 & 2032
- Table 85: Mexico Shale Gas Hydraulic Fracturing Market Revenue (Million) Forecast, by Application 2019 & 2032
- Table 86: Mexico Shale Gas Hydraulic Fracturing Market Volume (metric tonnes) Forecast, by Application 2019 & 2032
- Table 87: Global Shale Gas Hydraulic Fracturing Market Revenue Million Forecast, by Country 2019 & 2032
- Table 88: Global Shale Gas Hydraulic Fracturing Market Volume metric tonnes Forecast, by Country 2019 & 2032
- Table 89: United Arab Emirates Shale Gas Hydraulic Fracturing Market Revenue (Million) Forecast, by Application 2019 & 2032
- Table 90: United Arab Emirates Shale Gas Hydraulic Fracturing Market Volume (metric tonnes) Forecast, by Application 2019 & 2032
- Table 91: Saudi Arabia Shale Gas Hydraulic Fracturing Market Revenue (Million) Forecast, by Application 2019 & 2032
- Table 92: Saudi Arabia Shale Gas Hydraulic Fracturing Market Volume (metric tonnes) Forecast, by Application 2019 & 2032
- Table 93: South Africa Shale Gas Hydraulic Fracturing Market Revenue (Million) Forecast, by Application 2019 & 2032
- Table 94: South Africa Shale Gas Hydraulic Fracturing Market Volume (metric tonnes) Forecast, by Application 2019 & 2032
- Table 95: Rest of Middle East and Africa Shale Gas Hydraulic Fracturing Market Revenue (Million) Forecast, by Application 2019 & 2032
- Table 96: Rest of Middle East and Africa Shale Gas Hydraulic Fracturing Market Volume (metric tonnes) Forecast, by Application 2019 & 2032
- Table 97: Global Shale Gas Hydraulic Fracturing Market Revenue Million Forecast, by Well Type 2019 & 2032
- Table 98: Global Shale Gas Hydraulic Fracturing Market Volume metric tonnes Forecast, by Well Type 2019 & 2032
- Table 99: Global Shale Gas Hydraulic Fracturing Market Revenue Million Forecast, by Country 2019 & 2032
- Table 100: Global Shale Gas Hydraulic Fracturing Market Volume metric tonnes Forecast, by Country 2019 & 2032
- Table 101: Global Shale Gas Hydraulic Fracturing Market Revenue Million Forecast, by Well Type 2019 & 2032
- Table 102: Global Shale Gas Hydraulic Fracturing Market Volume metric tonnes Forecast, by Well Type 2019 & 2032
- Table 103: Global Shale Gas Hydraulic Fracturing Market Revenue Million Forecast, by Country 2019 & 2032
- Table 104: Global Shale Gas Hydraulic Fracturing Market Volume metric tonnes Forecast, by Country 2019 & 2032
- Table 105: Global Shale Gas Hydraulic Fracturing Market Revenue Million Forecast, by Well Type 2019 & 2032
- Table 106: Global Shale Gas Hydraulic Fracturing Market Volume metric tonnes Forecast, by Well Type 2019 & 2032
- Table 107: Global Shale Gas Hydraulic Fracturing Market Revenue Million Forecast, by Country 2019 & 2032
- Table 108: Global Shale Gas Hydraulic Fracturing Market Volume metric tonnes Forecast, by Country 2019 & 2032
- Table 109: Global Shale Gas Hydraulic Fracturing Market Revenue Million Forecast, by Well Type 2019 & 2032
- Table 110: Global Shale Gas Hydraulic Fracturing Market Volume metric tonnes Forecast, by Well Type 2019 & 2032
- Table 111: Global Shale Gas Hydraulic Fracturing Market Revenue Million Forecast, by Country 2019 & 2032
- Table 112: Global Shale Gas Hydraulic Fracturing Market Volume metric tonnes Forecast, by Country 2019 & 2032
- Table 113: Global Shale Gas Hydraulic Fracturing Market Revenue Million Forecast, by Well Type 2019 & 2032
- Table 114: Global Shale Gas Hydraulic Fracturing Market Volume metric tonnes Forecast, by Well Type 2019 & 2032
- Table 115: Global Shale Gas Hydraulic Fracturing Market Revenue Million Forecast, by Country 2019 & 2032
- Table 116: Global Shale Gas Hydraulic Fracturing Market Volume metric tonnes Forecast, by Country 2019 & 2032
Frequently Asked Questions
1. What is the projected Compound Annual Growth Rate (CAGR) of the Shale Gas Hydraulic Fracturing Market?
The projected CAGR is approximately > 2.00%.
2. Which companies are prominent players in the Shale Gas Hydraulic Fracturing Market?
Key companies in the market include Marathon Oil, CNPC, Royal Dutch Shell PLC*List Not Exhaustive, Exxon Mobil Corporation, Baker Hughes Co, ExxonMobil, Chevron Corporation, Sinopec Ltd, BP PLC.
3. What are the main segments of the Shale Gas Hydraulic Fracturing Market?
The market segments include Well Type.
4. Can you provide details about the market size?
The market size is estimated to be USD XX Million as of 2022.
5. What are some drivers contributing to market growth?
Increasing Demand from Industrial Applications4.; Growing Infrastructure Across the World.
6. What are the notable trends driving market growth?
Horizontal and Directional Well Type to Witness a Significant Growth.
7. Are there any restraints impacting market growth?
A Rise in Concerns Related to Carbon Emissions and a Shift Towards Electric Vehicles and Renewable Sources of Energy.
8. Can you provide examples of recent developments in the market?
N/A
9. What pricing options are available for accessing the report?
Pricing options include single-user, multi-user, and enterprise licenses priced at USD 4750, USD 5250, and USD 8750 respectively.
10. Is the market size provided in terms of value or volume?
The market size is provided in terms of value, measured in Million and volume, measured in metric tonnes.
11. Are there any specific market keywords associated with the report?
Yes, the market keyword associated with the report is "Shale Gas Hydraulic Fracturing Market," which aids in identifying and referencing the specific market segment covered.
12. How do I determine which pricing option suits my needs best?
The pricing options vary based on user requirements and access needs. Individual users may opt for single-user licenses, while businesses requiring broader access may choose multi-user or enterprise licenses for cost-effective access to the report.
13. Are there any additional resources or data provided in the Shale Gas Hydraulic Fracturing Market report?
While the report offers comprehensive insights, it's advisable to review the specific contents or supplementary materials provided to ascertain if additional resources or data are available.
14. How can I stay updated on further developments or reports in the Shale Gas Hydraulic Fracturing Market?
To stay informed about further developments, trends, and reports in the Shale Gas Hydraulic Fracturing Market, consider subscribing to industry newsletters, following relevant companies and organizations, or regularly checking reputable industry news sources and publications.
Methodology
Step 1 - Identification of Relevant Samples Size from Population Database


Step 2 - Approaches for Defining Global Market Size (Value, Volume* & Price*)

Note*: In applicable scenarios
Step 3 - Data Sources
Primary Research
- Web Analytics
- Survey Reports
- Research Institute
- Latest Research Reports
- Opinion Leaders
Secondary Research
- Annual Reports
- White Paper
- Latest Press Release
- Industry Association
- Paid Database
- Investor Presentations

Step 4 - Data Triangulation
Involves using different sources of information in order to increase the validity of a study
These sources are likely to be stakeholders in a program - participants, other researchers, program staff, other community members, and so on.
Then we put all data in single framework & apply various statistical tools to find out the dynamic on the market.
During the analysis stage, feedback from the stakeholder groups would be compared to determine areas of agreement as well as areas of divergence


