
Key Insights
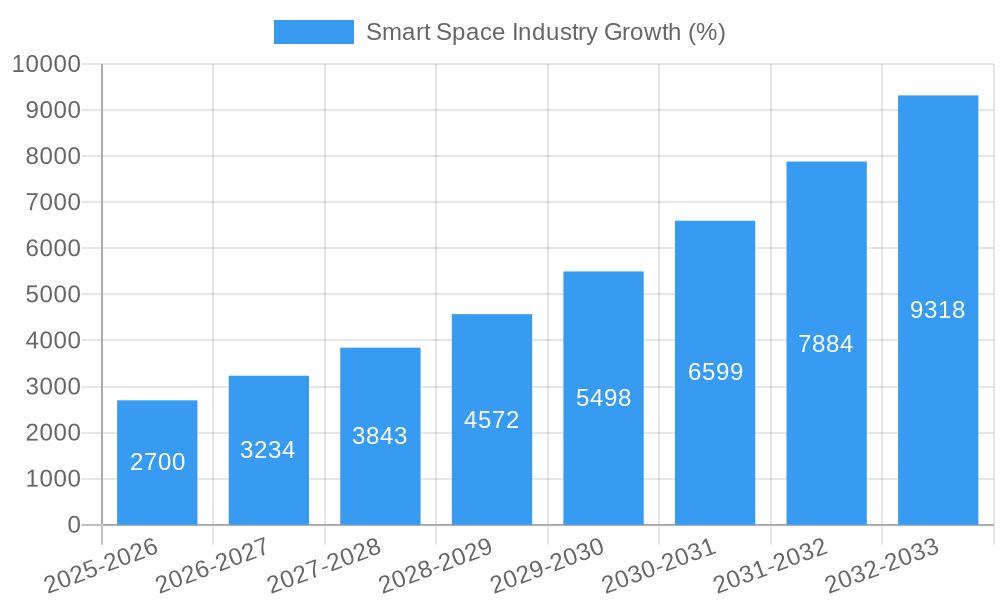
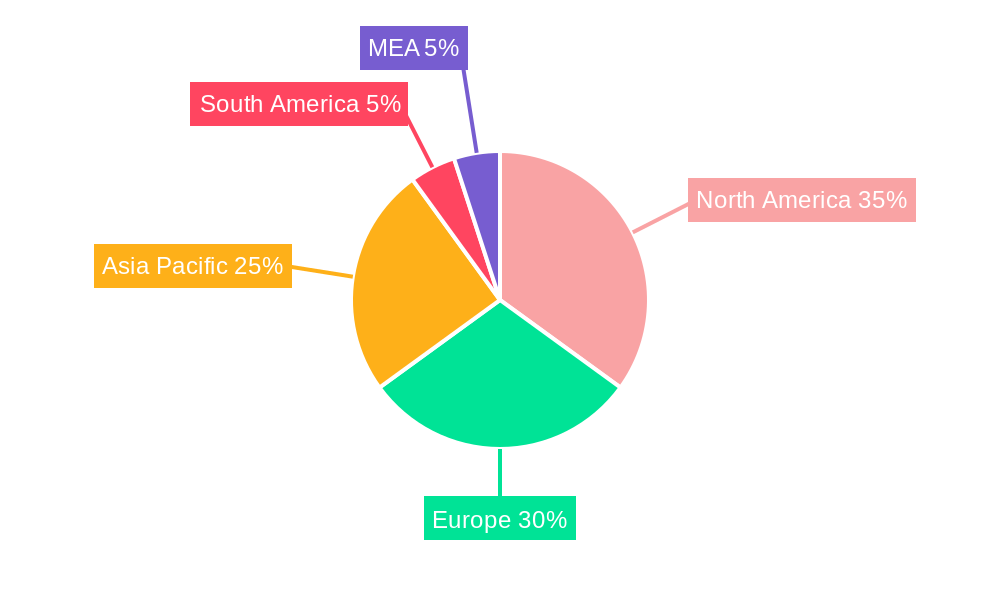
The smart space market, encompassing solutions and services for commercial and residential applications, is experiencing robust growth, projected to reach a substantial size driven by increasing demand for enhanced building efficiency, improved occupant experience, and the proliferation of IoT devices. The compound annual growth rate (CAGR) of 18.40% from 2019 to 2024 indicates a significant upward trajectory. This expansion is fueled by several key drivers: the need for optimized energy consumption in buildings, the growing adoption of smart building technologies to improve operational efficiency, and the increasing focus on creating safer and more secure environments through advanced surveillance and access control systems. Furthermore, the integration of artificial intelligence (AI) and machine learning (ML) is revolutionizing smart space management, enabling predictive maintenance and personalized experiences for occupants. While data privacy concerns and the high initial investment costs of implementing smart space solutions represent potential restraints, the long-term benefits in terms of cost savings, enhanced productivity, and improved sustainability are expected to outweigh these challenges. The market is segmented by solutions (hardware, software, and integrated systems) and services (installation, maintenance, and support), with the solutions segment currently holding a larger market share due to increasing adoption of smart devices and systems. North America and Europe are currently leading the market, but the Asia-Pacific region is anticipated to experience the highest growth rate in the coming years driven by rapid urbanization and technological advancements.
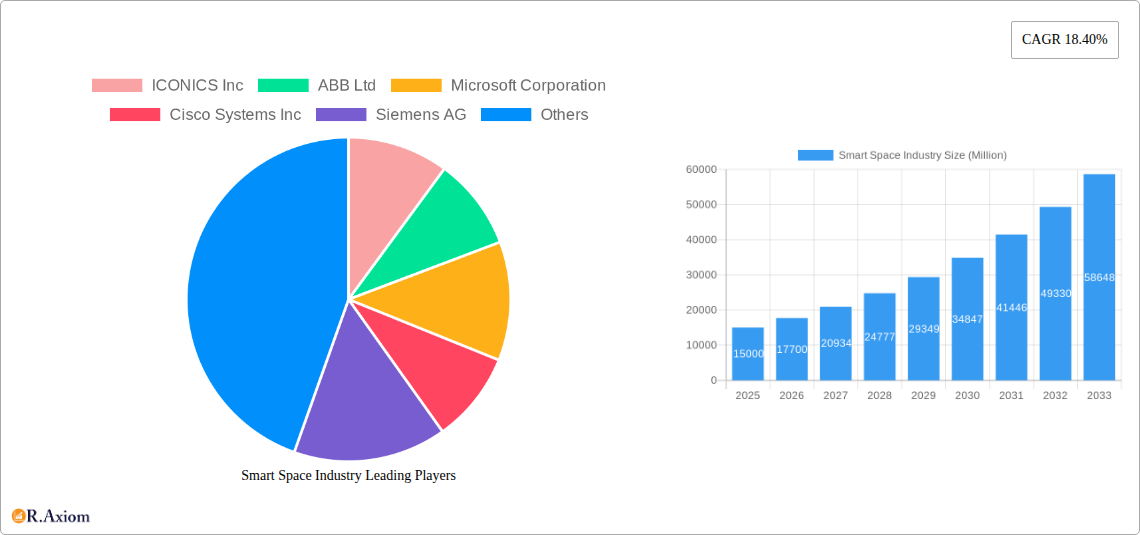
The competitive landscape is characterized by a mix of established technology giants like ABB, Siemens, and Microsoft, alongside specialized smart space solution providers such as ICONICS and SmartSpace Software. These companies are continually innovating to offer more integrated, user-friendly, and scalable solutions. The forecast period (2025-2033) anticipates continued strong growth, driven by the increasing adoption of smart technologies across various sectors, including healthcare, education, and retail. The market's evolution will likely be shaped by the development of more sophisticated AI-powered analytics, enhanced cybersecurity measures, and the integration of edge computing to address data processing challenges in large-scale deployments. This convergence of technologies will further unlock the potential of smart spaces to improve efficiency, sustainability, and overall quality of life.
Smart Space Industry Market Report: 2019-2033 Forecast
This comprehensive report provides an in-depth analysis of the global Smart Space industry, projecting robust growth from $XX Million in 2025 to $XX Million by 2033, exhibiting a CAGR of XX%. The study covers the period 2019-2033, with 2025 as the base year and 2025 as the estimated year. This report is essential for investors, industry stakeholders, and strategic decision-makers seeking actionable insights into this rapidly evolving market.
Smart Space Industry Market Concentration & Innovation
The Smart Space industry is characterized by a moderately concentrated market with key players like ICONICS Inc, ABB Ltd, Microsoft Corporation, Cisco Systems Inc, and Siemens AG holding significant market share. In 2024, these companies collectively held an estimated XX% of the market, with Microsoft Corporation leading at approximately XX%. Innovation is driven by advancements in IoT, AI, cloud computing, and big data analytics. Regulatory frameworks, particularly concerning data privacy and security (e.g., GDPR), significantly impact market dynamics. Product substitutes, such as traditional building management systems, continue to present competition. End-user trends favor integrated, user-friendly solutions that enhance operational efficiency and sustainability. M&A activity has been significant, with deal values exceeding $XX Million in 2024, primarily focused on consolidating market share and acquiring niche technologies. Specific deals include: *Acquisition of Company X by Company Y for $XX Million (2024). *Partnership between Company A and Company B to develop new solutions. This activity is expected to intensify in the coming years driving further industry consolidation.
Smart Space Industry Industry Trends & Insights
The Smart Space industry is experiencing exponential growth, fueled by the increasing adoption of smart technologies across various sectors. Market drivers include the rising demand for enhanced building automation, improved energy efficiency, and better occupant experience. Technological disruptions, such as the proliferation of 5G networks and edge computing, are revolutionizing connectivity and data processing capabilities within smart spaces. Consumer preferences are shifting towards personalized and intuitive smart space solutions. Competitive dynamics are intensifying, with established players facing pressure from emerging technology providers. The market is witnessing a gradual shift toward software-defined solutions, cloud-based platforms, and increased integration of AI and machine learning. The industry is expected to witness a strong growth trajectory, exceeding $XX Million by 2033. Market penetration rates for smart building technologies are increasing steadily, reaching approximately XX% in key regions by 2025, and projected to reach XX% by 2033.
Dominant Markets & Segments in Smart Space Industry
The Commercial segment currently dominates the Smart Space market, accounting for approximately XX% of the total revenue in 2025, driven by the high adoption of smart solutions in office buildings, retail spaces, and healthcare facilities. *Key drivers for this dominance include the potential for increased operational efficiency, cost savings, and enhanced tenant experience. The North American region shows the highest market share at approximately XX%, followed by Europe and Asia-Pacific. Within the “Type” segment, Solutions hold a larger market share than Services, driven by the higher initial investment required for implementing smart building infrastructure. Residential adoption is growing, but at a slower pace compared to Commercial, as the return on investment and consumer awareness are still evolving.
- Key Drivers in Dominant Regions:
- North America: Strong government initiatives promoting energy efficiency and smart city development, coupled with significant technological advancements.
- Europe: Growing awareness of sustainability and the implementation of stringent environmental regulations.
- Asia-Pacific: Rapid urbanization, increasing disposable incomes, and the rise of smart city projects.
Smart Space Industry Product Developments
Recent product innovations in the Smart Space industry focus on integrating AI, enhanced analytics, and improved user interfaces. The emphasis is on providing seamless user experiences and incorporating predictive maintenance capabilities. These innovations are enhancing the competitive advantage of leading players by enabling them to offer more personalized and effective solutions. Advanced sensors, real-time data visualization, and cloud-based platforms are transforming the market, offering scalability and improved data management. The integration of various IoT devices for comprehensive space monitoring also marks a significant product development.
Report Scope & Segmentation Analysis
This report segments the Smart Space market by Type (Solutions and Services) and End-user Industry (Commercial and Residential). The Solutions segment encompasses hardware, software, and platforms, exhibiting faster growth due to higher initial investment and long-term operational benefits. The Services segment comprises installation, maintenance, and support, showing steady growth driven by the need for ongoing management of smart space systems. The Commercial segment dominates the market, showing considerable growth due to the high concentration of smart building deployments. The Residential segment is showing slower, yet steady, growth as the cost and awareness factors moderate adoption.
Key Drivers of Smart Space Industry Growth
Technological advancements in IoT, AI, and cloud computing are major catalysts, enabling enhanced data collection, analysis, and automation. Economic factors like increasing disposable income in developing economies and government incentives to promote smart city development further fuel growth. Regulatory mandates focusing on energy efficiency and sustainability provide additional impetus. The rising demand for improved building management and enhanced occupant experience also contributes significantly to the market's expansion.
Challenges in the Smart Space Industry Sector
High initial investment costs for implementing smart space systems pose a challenge, particularly for smaller businesses and residential users. Cybersecurity concerns, the need for seamless data integration across different systems, and potential interoperability issues present significant obstacles. Supply chain disruptions and the complexity of deploying and maintaining sophisticated smart systems also impact growth. These factors collectively represent an estimated $XX Million annual loss to market growth, in 2025.
Emerging Opportunities in Smart Space Industry
The integration of AR/VR technology for space design and management offers significant potential. Expansion into new verticals, such as smart agriculture and smart transportation, presents exciting opportunities. The increasing adoption of edge computing improves real-time data processing and enhances responsiveness. The focus on sustainable smart spaces, including energy-efficient solutions and green building technologies, is creating new market avenues.
Leading Players in the Smart Space Industry Market
- ICONICS Inc
- ABB Ltd
- Microsoft Corporation
- Cisco Systems Inc
- Siemens AG
- Hitachi Vantara Corporation
- SmartSpace Software PLC
- Ubisense Limited
- Spacewell Faseas (Nemetschek Group)
- Adappt Intelligence Inc
Key Developments in Smart Space Industry Industry
- January 2024: Microsoft announced a new AI-powered platform for smart buildings.
- March 2024: Siemens launched an advanced sensor technology for smart spaces.
- June 2024: ABB acquired a smaller smart building technology firm for $XX Million.
Strategic Outlook for Smart Space Industry Market
The Smart Space industry is poised for continued expansion, driven by technological advancements and the growing adoption of smart technologies across various sectors. The convergence of IoT, AI, and cloud computing will further propel innovation and market penetration. Future growth will be influenced by the development of more sophisticated and user-friendly solutions addressing the needs of various user groups. The focus on sustainable smart spaces will continue to be a key driver. The predicted market size of $XX Million by 2033 reflects a strong positive outlook and substantial growth potential.
Smart Space Industry Segmentation
-
1. Type
- 1.1. Solutions
- 1.2. Services
-
2. End-user Industry
- 2.1. Commercial
- 2.2. Residential
Smart Space Industry Segmentation By Geography
- 1. North America
- 2. Europe
- 3. Asia Pacific
- 4. Latin America
- 5. Middle East
Smart Space Industry REPORT HIGHLIGHTS
| Aspects | Details |
|---|---|
| Study Period | 2019-2033 |
| Base Year | 2024 |
| Estimated Year | 2025 |
| Forecast Period | 2025-2033 |
| Historical Period | 2019-2024 |
| Growth Rate | CAGR of 18.40% from 2019-2033 |
| Segmentation |
|
Table of Contents
- 1. Introduction
- 1.1. Research Scope
- 1.2. Market Segmentation
- 1.3. Research Methodology
- 1.4. Definitions and Assumptions
- 2. Executive Summary
- 2.1. Introduction
- 3. Market Dynamics
- 3.1. Introduction
- 3.2. Market Drivers
- 3.2.1. ; Increasing Adoption of IoT; Increasing Urban Population
- 3.3. Market Restrains
- 3.3.1. ; High Initial Infrastructure Expenditure
- 3.4. Market Trends
- 3.4.1. Commercial Segment Estimated to Hold the Largest Market Share
- 4. Market Factor Analysis
- 4.1. Porters Five Forces
- 4.2. Supply/Value Chain
- 4.3. PESTEL analysis
- 4.4. Market Entropy
- 4.5. Patent/Trademark Analysis
- 5. Global Smart Space Industry Analysis, Insights and Forecast, 2019-2031
- 5.1. Market Analysis, Insights and Forecast - by Type
- 5.1.1. Solutions
- 5.1.2. Services
- 5.2. Market Analysis, Insights and Forecast - by End-user Industry
- 5.2.1. Commercial
- 5.2.2. Residential
- 5.3. Market Analysis, Insights and Forecast - by Region
- 5.3.1. North America
- 5.3.2. Europe
- 5.3.3. Asia Pacific
- 5.3.4. Latin America
- 5.3.5. Middle East
- 5.1. Market Analysis, Insights and Forecast - by Type
- 6. North America Smart Space Industry Analysis, Insights and Forecast, 2019-2031
- 6.1. Market Analysis, Insights and Forecast - by Type
- 6.1.1. Solutions
- 6.1.2. Services
- 6.2. Market Analysis, Insights and Forecast - by End-user Industry
- 6.2.1. Commercial
- 6.2.2. Residential
- 6.1. Market Analysis, Insights and Forecast - by Type
- 7. Europe Smart Space Industry Analysis, Insights and Forecast, 2019-2031
- 7.1. Market Analysis, Insights and Forecast - by Type
- 7.1.1. Solutions
- 7.1.2. Services
- 7.2. Market Analysis, Insights and Forecast - by End-user Industry
- 7.2.1. Commercial
- 7.2.2. Residential
- 7.1. Market Analysis, Insights and Forecast - by Type
- 8. Asia Pacific Smart Space Industry Analysis, Insights and Forecast, 2019-2031
- 8.1. Market Analysis, Insights and Forecast - by Type
- 8.1.1. Solutions
- 8.1.2. Services
- 8.2. Market Analysis, Insights and Forecast - by End-user Industry
- 8.2.1. Commercial
- 8.2.2. Residential
- 8.1. Market Analysis, Insights and Forecast - by Type
- 9. Latin America Smart Space Industry Analysis, Insights and Forecast, 2019-2031
- 9.1. Market Analysis, Insights and Forecast - by Type
- 9.1.1. Solutions
- 9.1.2. Services
- 9.2. Market Analysis, Insights and Forecast - by End-user Industry
- 9.2.1. Commercial
- 9.2.2. Residential
- 9.1. Market Analysis, Insights and Forecast - by Type
- 10. Middle East Smart Space Industry Analysis, Insights and Forecast, 2019-2031
- 10.1. Market Analysis, Insights and Forecast - by Type
- 10.1.1. Solutions
- 10.1.2. Services
- 10.2. Market Analysis, Insights and Forecast - by End-user Industry
- 10.2.1. Commercial
- 10.2.2. Residential
- 10.1. Market Analysis, Insights and Forecast - by Type
- 11. North America Smart Space Industry Analysis, Insights and Forecast, 2019-2031
- 11.1. Market Analysis, Insights and Forecast - By Country/Sub-region
- 11.1.1. undefined
- 12. Europe Smart Space Industry Analysis, Insights and Forecast, 2019-2031
- 12.1. Market Analysis, Insights and Forecast - By Country/Sub-region
- 12.1.1. undefined
- 13. Asia Pacific Smart Space Industry Analysis, Insights and Forecast, 2019-2031
- 13.1. Market Analysis, Insights and Forecast - By Country/Sub-region
- 13.1.1. undefined
- 14. South America Smart Space Industry Analysis, Insights and Forecast, 2019-2031
- 14.1. Market Analysis, Insights and Forecast - By Country/Sub-region
- 14.1.1. undefined
- 15. North America Smart Space Industry Analysis, Insights and Forecast, 2019-2031
- 15.1. Market Analysis, Insights and Forecast - By Country/Sub-region
- 15.1.1. undefined
- 16. MEA Smart Space Industry Analysis, Insights and Forecast, 2019-2031
- 16.1. Market Analysis, Insights and Forecast - By Country/Sub-region
- 16.1.1. undefined
- 17. Competitive Analysis
- 17.1. Global Market Share Analysis 2024
- 17.2. Company Profiles
- 17.2.1 ICONICS Inc
- 17.2.1.1. Overview
- 17.2.1.2. Products
- 17.2.1.3. SWOT Analysis
- 17.2.1.4. Recent Developments
- 17.2.1.5. Financials (Based on Availability)
- 17.2.2 ABB Ltd
- 17.2.2.1. Overview
- 17.2.2.2. Products
- 17.2.2.3. SWOT Analysis
- 17.2.2.4. Recent Developments
- 17.2.2.5. Financials (Based on Availability)
- 17.2.3 Microsoft Corporation
- 17.2.3.1. Overview
- 17.2.3.2. Products
- 17.2.3.3. SWOT Analysis
- 17.2.3.4. Recent Developments
- 17.2.3.5. Financials (Based on Availability)
- 17.2.4 Cisco Systems Inc
- 17.2.4.1. Overview
- 17.2.4.2. Products
- 17.2.4.3. SWOT Analysis
- 17.2.4.4. Recent Developments
- 17.2.4.5. Financials (Based on Availability)
- 17.2.5 Siemens AG
- 17.2.5.1. Overview
- 17.2.5.2. Products
- 17.2.5.3. SWOT Analysis
- 17.2.5.4. Recent Developments
- 17.2.5.5. Financials (Based on Availability)
- 17.2.6 Hitachi Vantara Corporation
- 17.2.6.1. Overview
- 17.2.6.2. Products
- 17.2.6.3. SWOT Analysis
- 17.2.6.4. Recent Developments
- 17.2.6.5. Financials (Based on Availability)
- 17.2.7 SmartSpace Software PLC
- 17.2.7.1. Overview
- 17.2.7.2. Products
- 17.2.7.3. SWOT Analysis
- 17.2.7.4. Recent Developments
- 17.2.7.5. Financials (Based on Availability)
- 17.2.8 Ubisense Limited
- 17.2.8.1. Overview
- 17.2.8.2. Products
- 17.2.8.3. SWOT Analysis
- 17.2.8.4. Recent Developments
- 17.2.8.5. Financials (Based on Availability)
- 17.2.9 Spacewell Faseas (Nemetschek Group)
- 17.2.9.1. Overview
- 17.2.9.2. Products
- 17.2.9.3. SWOT Analysis
- 17.2.9.4. Recent Developments
- 17.2.9.5. Financials (Based on Availability)
- 17.2.10 Adappt Intelligence Inc
- 17.2.10.1. Overview
- 17.2.10.2. Products
- 17.2.10.3. SWOT Analysis
- 17.2.10.4. Recent Developments
- 17.2.10.5. Financials (Based on Availability)
- 17.2.1 ICONICS Inc
List of Figures
- Figure 1: Global Smart Space Industry Revenue Breakdown (Million, %) by Region 2024 & 2032
- Figure 2: Global Smart Space Industry Volume Breakdown (K Unit, %) by Region 2024 & 2032
- Figure 3: North America Smart Space Industry Revenue (Million), by Country 2024 & 2032
- Figure 4: North America Smart Space Industry Volume (K Unit), by Country 2024 & 2032
- Figure 5: North America Smart Space Industry Revenue Share (%), by Country 2024 & 2032
- Figure 6: North America Smart Space Industry Volume Share (%), by Country 2024 & 2032
- Figure 7: Europe Smart Space Industry Revenue (Million), by Country 2024 & 2032
- Figure 8: Europe Smart Space Industry Volume (K Unit), by Country 2024 & 2032
- Figure 9: Europe Smart Space Industry Revenue Share (%), by Country 2024 & 2032
- Figure 10: Europe Smart Space Industry Volume Share (%), by Country 2024 & 2032
- Figure 11: Asia Pacific Smart Space Industry Revenue (Million), by Country 2024 & 2032
- Figure 12: Asia Pacific Smart Space Industry Volume (K Unit), by Country 2024 & 2032
- Figure 13: Asia Pacific Smart Space Industry Revenue Share (%), by Country 2024 & 2032
- Figure 14: Asia Pacific Smart Space Industry Volume Share (%), by Country 2024 & 2032
- Figure 15: South America Smart Space Industry Revenue (Million), by Country 2024 & 2032
- Figure 16: South America Smart Space Industry Volume (K Unit), by Country 2024 & 2032
- Figure 17: South America Smart Space Industry Revenue Share (%), by Country 2024 & 2032
- Figure 18: South America Smart Space Industry Volume Share (%), by Country 2024 & 2032
- Figure 19: North America Smart Space Industry Revenue (Million), by Country 2024 & 2032
- Figure 20: North America Smart Space Industry Volume (K Unit), by Country 2024 & 2032
- Figure 21: North America Smart Space Industry Revenue Share (%), by Country 2024 & 2032
- Figure 22: North America Smart Space Industry Volume Share (%), by Country 2024 & 2032
- Figure 23: MEA Smart Space Industry Revenue (Million), by Country 2024 & 2032
- Figure 24: MEA Smart Space Industry Volume (K Unit), by Country 2024 & 2032
- Figure 25: MEA Smart Space Industry Revenue Share (%), by Country 2024 & 2032
- Figure 26: MEA Smart Space Industry Volume Share (%), by Country 2024 & 2032
- Figure 27: North America Smart Space Industry Revenue (Million), by Type 2024 & 2032
- Figure 28: North America Smart Space Industry Volume (K Unit), by Type 2024 & 2032
- Figure 29: North America Smart Space Industry Revenue Share (%), by Type 2024 & 2032
- Figure 30: North America Smart Space Industry Volume Share (%), by Type 2024 & 2032
- Figure 31: North America Smart Space Industry Revenue (Million), by End-user Industry 2024 & 2032
- Figure 32: North America Smart Space Industry Volume (K Unit), by End-user Industry 2024 & 2032
- Figure 33: North America Smart Space Industry Revenue Share (%), by End-user Industry 2024 & 2032
- Figure 34: North America Smart Space Industry Volume Share (%), by End-user Industry 2024 & 2032
- Figure 35: North America Smart Space Industry Revenue (Million), by Country 2024 & 2032
- Figure 36: North America Smart Space Industry Volume (K Unit), by Country 2024 & 2032
- Figure 37: North America Smart Space Industry Revenue Share (%), by Country 2024 & 2032
- Figure 38: North America Smart Space Industry Volume Share (%), by Country 2024 & 2032
- Figure 39: Europe Smart Space Industry Revenue (Million), by Type 2024 & 2032
- Figure 40: Europe Smart Space Industry Volume (K Unit), by Type 2024 & 2032
- Figure 41: Europe Smart Space Industry Revenue Share (%), by Type 2024 & 2032
- Figure 42: Europe Smart Space Industry Volume Share (%), by Type 2024 & 2032
- Figure 43: Europe Smart Space Industry Revenue (Million), by End-user Industry 2024 & 2032
- Figure 44: Europe Smart Space Industry Volume (K Unit), by End-user Industry 2024 & 2032
- Figure 45: Europe Smart Space Industry Revenue Share (%), by End-user Industry 2024 & 2032
- Figure 46: Europe Smart Space Industry Volume Share (%), by End-user Industry 2024 & 2032
- Figure 47: Europe Smart Space Industry Revenue (Million), by Country 2024 & 2032
- Figure 48: Europe Smart Space Industry Volume (K Unit), by Country 2024 & 2032
- Figure 49: Europe Smart Space Industry Revenue Share (%), by Country 2024 & 2032
- Figure 50: Europe Smart Space Industry Volume Share (%), by Country 2024 & 2032
- Figure 51: Asia Pacific Smart Space Industry Revenue (Million), by Type 2024 & 2032
- Figure 52: Asia Pacific Smart Space Industry Volume (K Unit), by Type 2024 & 2032
- Figure 53: Asia Pacific Smart Space Industry Revenue Share (%), by Type 2024 & 2032
- Figure 54: Asia Pacific Smart Space Industry Volume Share (%), by Type 2024 & 2032
- Figure 55: Asia Pacific Smart Space Industry Revenue (Million), by End-user Industry 2024 & 2032
- Figure 56: Asia Pacific Smart Space Industry Volume (K Unit), by End-user Industry 2024 & 2032
- Figure 57: Asia Pacific Smart Space Industry Revenue Share (%), by End-user Industry 2024 & 2032
- Figure 58: Asia Pacific Smart Space Industry Volume Share (%), by End-user Industry 2024 & 2032
- Figure 59: Asia Pacific Smart Space Industry Revenue (Million), by Country 2024 & 2032
- Figure 60: Asia Pacific Smart Space Industry Volume (K Unit), by Country 2024 & 2032
- Figure 61: Asia Pacific Smart Space Industry Revenue Share (%), by Country 2024 & 2032
- Figure 62: Asia Pacific Smart Space Industry Volume Share (%), by Country 2024 & 2032
- Figure 63: Latin America Smart Space Industry Revenue (Million), by Type 2024 & 2032
- Figure 64: Latin America Smart Space Industry Volume (K Unit), by Type 2024 & 2032
- Figure 65: Latin America Smart Space Industry Revenue Share (%), by Type 2024 & 2032
- Figure 66: Latin America Smart Space Industry Volume Share (%), by Type 2024 & 2032
- Figure 67: Latin America Smart Space Industry Revenue (Million), by End-user Industry 2024 & 2032
- Figure 68: Latin America Smart Space Industry Volume (K Unit), by End-user Industry 2024 & 2032
- Figure 69: Latin America Smart Space Industry Revenue Share (%), by End-user Industry 2024 & 2032
- Figure 70: Latin America Smart Space Industry Volume Share (%), by End-user Industry 2024 & 2032
- Figure 71: Latin America Smart Space Industry Revenue (Million), by Country 2024 & 2032
- Figure 72: Latin America Smart Space Industry Volume (K Unit), by Country 2024 & 2032
- Figure 73: Latin America Smart Space Industry Revenue Share (%), by Country 2024 & 2032
- Figure 74: Latin America Smart Space Industry Volume Share (%), by Country 2024 & 2032
- Figure 75: Middle East Smart Space Industry Revenue (Million), by Type 2024 & 2032
- Figure 76: Middle East Smart Space Industry Volume (K Unit), by Type 2024 & 2032
- Figure 77: Middle East Smart Space Industry Revenue Share (%), by Type 2024 & 2032
- Figure 78: Middle East Smart Space Industry Volume Share (%), by Type 2024 & 2032
- Figure 79: Middle East Smart Space Industry Revenue (Million), by End-user Industry 2024 & 2032
- Figure 80: Middle East Smart Space Industry Volume (K Unit), by End-user Industry 2024 & 2032
- Figure 81: Middle East Smart Space Industry Revenue Share (%), by End-user Industry 2024 & 2032
- Figure 82: Middle East Smart Space Industry Volume Share (%), by End-user Industry 2024 & 2032
- Figure 83: Middle East Smart Space Industry Revenue (Million), by Country 2024 & 2032
- Figure 84: Middle East Smart Space Industry Volume (K Unit), by Country 2024 & 2032
- Figure 85: Middle East Smart Space Industry Revenue Share (%), by Country 2024 & 2032
- Figure 86: Middle East Smart Space Industry Volume Share (%), by Country 2024 & 2032
List of Tables
- Table 1: Global Smart Space Industry Revenue Million Forecast, by Region 2019 & 2032
- Table 2: Global Smart Space Industry Volume K Unit Forecast, by Region 2019 & 2032
- Table 3: Global Smart Space Industry Revenue Million Forecast, by Type 2019 & 2032
- Table 4: Global Smart Space Industry Volume K Unit Forecast, by Type 2019 & 2032
- Table 5: Global Smart Space Industry Revenue Million Forecast, by End-user Industry 2019 & 2032
- Table 6: Global Smart Space Industry Volume K Unit Forecast, by End-user Industry 2019 & 2032
- Table 7: Global Smart Space Industry Revenue Million Forecast, by Region 2019 & 2032
- Table 8: Global Smart Space Industry Volume K Unit Forecast, by Region 2019 & 2032
- Table 9: Global Smart Space Industry Revenue Million Forecast, by Country 2019 & 2032
- Table 10: Global Smart Space Industry Volume K Unit Forecast, by Country 2019 & 2032
- Table 11: Global Smart Space Industry Revenue Million Forecast, by Country 2019 & 2032
- Table 12: Global Smart Space Industry Volume K Unit Forecast, by Country 2019 & 2032
- Table 13: Global Smart Space Industry Revenue Million Forecast, by Country 2019 & 2032
- Table 14: Global Smart Space Industry Volume K Unit Forecast, by Country 2019 & 2032
- Table 15: Global Smart Space Industry Revenue Million Forecast, by Country 2019 & 2032
- Table 16: Global Smart Space Industry Volume K Unit Forecast, by Country 2019 & 2032
- Table 17: Global Smart Space Industry Revenue Million Forecast, by Country 2019 & 2032
- Table 18: Global Smart Space Industry Volume K Unit Forecast, by Country 2019 & 2032
- Table 19: Global Smart Space Industry Revenue Million Forecast, by Country 2019 & 2032
- Table 20: Global Smart Space Industry Volume K Unit Forecast, by Country 2019 & 2032
- Table 21: Global Smart Space Industry Revenue Million Forecast, by Type 2019 & 2032
- Table 22: Global Smart Space Industry Volume K Unit Forecast, by Type 2019 & 2032
- Table 23: Global Smart Space Industry Revenue Million Forecast, by End-user Industry 2019 & 2032
- Table 24: Global Smart Space Industry Volume K Unit Forecast, by End-user Industry 2019 & 2032
- Table 25: Global Smart Space Industry Revenue Million Forecast, by Country 2019 & 2032
- Table 26: Global Smart Space Industry Volume K Unit Forecast, by Country 2019 & 2032
- Table 27: Global Smart Space Industry Revenue Million Forecast, by Type 2019 & 2032
- Table 28: Global Smart Space Industry Volume K Unit Forecast, by Type 2019 & 2032
- Table 29: Global Smart Space Industry Revenue Million Forecast, by End-user Industry 2019 & 2032
- Table 30: Global Smart Space Industry Volume K Unit Forecast, by End-user Industry 2019 & 2032
- Table 31: Global Smart Space Industry Revenue Million Forecast, by Country 2019 & 2032
- Table 32: Global Smart Space Industry Volume K Unit Forecast, by Country 2019 & 2032
- Table 33: Global Smart Space Industry Revenue Million Forecast, by Type 2019 & 2032
- Table 34: Global Smart Space Industry Volume K Unit Forecast, by Type 2019 & 2032
- Table 35: Global Smart Space Industry Revenue Million Forecast, by End-user Industry 2019 & 2032
- Table 36: Global Smart Space Industry Volume K Unit Forecast, by End-user Industry 2019 & 2032
- Table 37: Global Smart Space Industry Revenue Million Forecast, by Country 2019 & 2032
- Table 38: Global Smart Space Industry Volume K Unit Forecast, by Country 2019 & 2032
- Table 39: Global Smart Space Industry Revenue Million Forecast, by Type 2019 & 2032
- Table 40: Global Smart Space Industry Volume K Unit Forecast, by Type 2019 & 2032
- Table 41: Global Smart Space Industry Revenue Million Forecast, by End-user Industry 2019 & 2032
- Table 42: Global Smart Space Industry Volume K Unit Forecast, by End-user Industry 2019 & 2032
- Table 43: Global Smart Space Industry Revenue Million Forecast, by Country 2019 & 2032
- Table 44: Global Smart Space Industry Volume K Unit Forecast, by Country 2019 & 2032
- Table 45: Global Smart Space Industry Revenue Million Forecast, by Type 2019 & 2032
- Table 46: Global Smart Space Industry Volume K Unit Forecast, by Type 2019 & 2032
- Table 47: Global Smart Space Industry Revenue Million Forecast, by End-user Industry 2019 & 2032
- Table 48: Global Smart Space Industry Volume K Unit Forecast, by End-user Industry 2019 & 2032
- Table 49: Global Smart Space Industry Revenue Million Forecast, by Country 2019 & 2032
- Table 50: Global Smart Space Industry Volume K Unit Forecast, by Country 2019 & 2032
Frequently Asked Questions
1. What is the projected Compound Annual Growth Rate (CAGR) of the Smart Space Industry?
The projected CAGR is approximately 18.40%.
2. Which companies are prominent players in the Smart Space Industry?
Key companies in the market include ICONICS Inc, ABB Ltd, Microsoft Corporation, Cisco Systems Inc, Siemens AG, Hitachi Vantara Corporation, SmartSpace Software PLC, Ubisense Limited, Spacewell Faseas (Nemetschek Group), Adappt Intelligence Inc.
3. What are the main segments of the Smart Space Industry?
The market segments include Type, End-user Industry.
4. Can you provide details about the market size?
The market size is estimated to be USD XX Million as of 2022.
5. What are some drivers contributing to market growth?
; Increasing Adoption of IoT; Increasing Urban Population.
6. What are the notable trends driving market growth?
Commercial Segment Estimated to Hold the Largest Market Share.
7. Are there any restraints impacting market growth?
; High Initial Infrastructure Expenditure.
8. Can you provide examples of recent developments in the market?
N/A
9. What pricing options are available for accessing the report?
Pricing options include single-user, multi-user, and enterprise licenses priced at USD 4750, USD 5250, and USD 8750 respectively.
10. Is the market size provided in terms of value or volume?
The market size is provided in terms of value, measured in Million and volume, measured in K Unit.
11. Are there any specific market keywords associated with the report?
Yes, the market keyword associated with the report is "Smart Space Industry," which aids in identifying and referencing the specific market segment covered.
12. How do I determine which pricing option suits my needs best?
The pricing options vary based on user requirements and access needs. Individual users may opt for single-user licenses, while businesses requiring broader access may choose multi-user or enterprise licenses for cost-effective access to the report.
13. Are there any additional resources or data provided in the Smart Space Industry report?
While the report offers comprehensive insights, it's advisable to review the specific contents or supplementary materials provided to ascertain if additional resources or data are available.
14. How can I stay updated on further developments or reports in the Smart Space Industry?
To stay informed about further developments, trends, and reports in the Smart Space Industry, consider subscribing to industry newsletters, following relevant companies and organizations, or regularly checking reputable industry news sources and publications.
Methodology
Step 1 - Identification of Relevant Samples Size from Population Database


Step 2 - Approaches for Defining Global Market Size (Value, Volume* & Price*)

Note*: In applicable scenarios
Step 3 - Data Sources
Primary Research
- Web Analytics
- Survey Reports
- Research Institute
- Latest Research Reports
- Opinion Leaders
Secondary Research
- Annual Reports
- White Paper
- Latest Press Release
- Industry Association
- Paid Database
- Investor Presentations

Step 4 - Data Triangulation
Involves using different sources of information in order to increase the validity of a study
These sources are likely to be stakeholders in a program - participants, other researchers, program staff, other community members, and so on.
Then we put all data in single framework & apply various statistical tools to find out the dynamic on the market.
During the analysis stage, feedback from the stakeholder groups would be compared to determine areas of agreement as well as areas of divergence


