


Key Insights
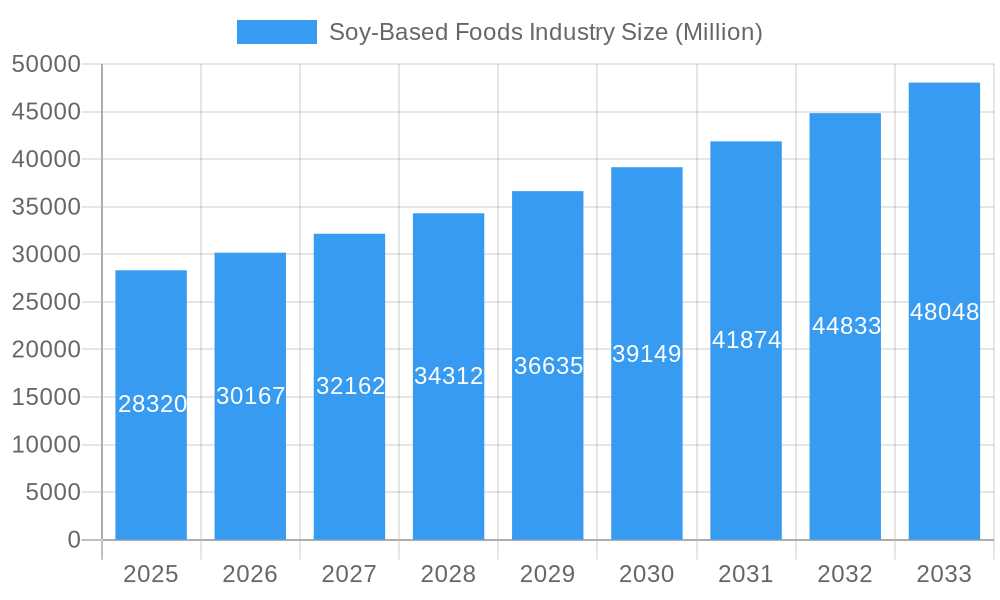
The soy-based foods market, valued at $28.32 billion in 2025, is experiencing robust growth, projected to expand at a Compound Annual Growth Rate (CAGR) of 6.45% from 2025 to 2033. This expansion is fueled by several key drivers. Increasing consumer awareness of the health benefits of soy – including its high protein content, fiber, and isoflavones – is a significant factor. The growing adoption of plant-based diets, driven by concerns about animal welfare, environmental sustainability, and health, further boosts demand. The versatility of soy, enabling its use in a wide array of products like meat substitutes, dairy alternatives (ice cream, cheese, yogurt), and spreads, contributes to market breadth. Innovation in product development, focusing on improved taste and texture to appeal to a broader consumer base, is also a key driver. Furthermore, the increasing availability of soy-based products through diverse distribution channels, including hypermarkets, supermarkets, convenience stores, and online retail, enhances market accessibility and fuels growth.

Soy-Based Foods Industry Market Size (In Billion)

Geographic distribution of the market reveals strong regional variations. North America and Europe are currently leading markets, driven by high consumer awareness and established plant-based food culture. However, the Asia-Pacific region presents significant growth potential due to its large and rapidly expanding population, coupled with increasing disposable incomes and adoption of Western dietary trends. Market restraints include potential concerns about soy allergies and the perception of soy products as less palatable compared to traditional animal-based alternatives. However, ongoing innovation in product formulation and marketing strategies are effectively mitigating these challenges. The competitive landscape is characterized by the presence of both large multinational corporations and smaller, specialized players, reflecting the diverse nature of the soy-based food market. Future growth is expected to be driven by continued product innovation, expansion into new markets, and strategic partnerships within the food industry.
Soy-Based Foods Industry Company Market Share
Soy-Based Foods Industry: A Comprehensive Market Report (2019-2033)
This comprehensive report provides an in-depth analysis of the global soy-based foods industry, encompassing market size, growth projections, competitive landscape, and emerging trends from 2019 to 2033. The study period covers the historical period (2019-2024), the base year (2025), and the forecast period (2025-2033). This report is crucial for industry stakeholders, investors, and businesses seeking to understand the dynamics and future potential of this rapidly evolving market, valued at xx Million in 2025 and projected to reach xx Million by 2033.
Soy-Based Foods Industry Market Concentration & Innovation
This section analyzes the market concentration, innovation drivers, regulatory frameworks, product substitutes, end-user trends, and mergers & acquisitions (M&A) activities within the soy-based foods industry. The leading players, including Nestle SA, Unilever PLC, and Danone SA, hold a significant market share, estimated at xx% collectively in 2025. However, the market is also characterized by the emergence of innovative startups like Impossible Foods Inc and Good Catch Foods, driving competition and product diversification.
- Market Concentration: The industry exhibits a moderately concentrated structure with a few major players dominating specific segments. Smaller players focus on niche markets or specific product types.
- Innovation Drivers: Growing consumer demand for plant-based alternatives, advancements in soy protein technology, and increasing health consciousness are major drivers of innovation.
- Regulatory Frameworks: Government regulations regarding food labeling, safety standards, and sustainability impact market dynamics. Variations in regulations across different regions influence product development and market access.
- Product Substitutes: Other plant-based protein sources, such as pea protein and mycoprotein, present competitive challenges. However, soy remains a dominant source due to its affordability and versatility.
- End-User Trends: Increasing awareness of the environmental and health benefits of plant-based diets is driving strong consumer demand. The preference for convenient, ready-to-eat soy-based products is also prominent.
- M&A Activities: The industry has witnessed significant M&A activity in recent years, with major players acquiring smaller companies to expand their product portfolios and market reach. The total value of M&A deals in the soy-based foods industry from 2019 to 2024 is estimated at xx Million.
Soy-Based Foods Industry Industry Trends & Insights
This section delves into the key trends and insights shaping the soy-based foods industry. The market is experiencing robust growth, driven by increasing consumer demand for plant-based alternatives, healthier diets and concerns about animal welfare. Technological advancements in soy processing and product formulation are enhancing the taste, texture, and nutritional profile of soy-based foods, thereby increasing their appeal. The competitive landscape is dynamic, characterized by both established players and emerging startups.
The Compound Annual Growth Rate (CAGR) for the soy-based foods market is projected at xx% during the forecast period (2025-2033), with market penetration expected to reach xx% by 2033. Consumer preferences are shifting towards healthier, more sustainable, and convenient food options, further propelling market growth. The rise of online retail channels is also creating new opportunities for soy-based food companies.
Dominant Markets & Segments in Soy-Based Foods Industry
This section highlights the leading regions, countries, and segments within the soy-based foods market. While precise figures for individual segments are unavailable, market dominance is analyzed based on available data and industry trends.
By Product Type: Meat substitutes are the dominant segment, driven by the growing popularity of vegetarian and vegan diets.
By Distribution Channel: Hypermarkets/supermarkets are the primary distribution channel due to their wide reach and established infrastructure. However, online retail is rapidly gaining traction and is expected to demonstrate significant growth in the forecast period.
- Key Drivers (Hypermarkets/Supermarkets): Extensive retail networks, established supply chains, and consumer familiarity.
- Key Drivers (Online Retail Stores): Increased convenience, wider product selection, and targeted marketing.
- Key Drivers (Meat Substitutes): Growing demand for plant-based alternatives to meat products.
- Regional Dominance: North America and Europe are currently the leading markets, but Asia-Pacific is expected to experience rapid growth due to rising disposable incomes and changing dietary habits.
Soy-Based Foods Industry Product Developments
The soy-based foods industry is witnessing continuous product innovation, with a focus on improving taste, texture, and nutritional value. Technological advancements, such as advanced protein extraction and texturization techniques, are leading to products that closely mimic the sensory experience of traditional meat and dairy products. This improved sensory profile is key to broader market acceptance and further expansion of the industry. Companies are also focusing on developing healthier and more sustainable soy-based products to meet the evolving consumer preferences.
Report Scope & Segmentation Analysis
This report segments the soy-based foods market by product type (meat substitutes, tempeh, non-dairy ice cream, non-dairy cheese, non-dairy yogurt, non-dairy spreads), and distribution channel (hypermarkets/supermarkets, convenience stores, online retail stores, other distribution channels). Each segment’s growth trajectory, market size, and competitive dynamics are analyzed individually. The projections for market size and growth vary across segments, reflecting differences in consumer demand and competitive intensity.
Key Drivers of Soy-Based Foods Industry Growth
Several factors are driving the growth of the soy-based foods industry. Firstly, the increasing global population and rising concerns about health and sustainability are fuelling demand for plant-based protein sources. Secondly, technological advancements in soy processing have led to the development of tastier, more nutritious, and versatile soy-based products. Thirdly, supportive government policies and initiatives promoting plant-based diets in various regions are bolstering market growth.
Challenges in the Soy-Based Foods Industry Sector
Despite its considerable potential, the soy-based foods industry faces certain challenges. Fluctuations in soy prices and supply chain disruptions can impact production costs and profitability. Maintaining consistent product quality and addressing consumer concerns about taste and texture remain ongoing challenges. Stringent regulatory requirements and food safety standards necessitate significant investments in research and development and compliance.
Emerging Opportunities in Soy-Based Foods Industry
The soy-based foods industry presents several emerging opportunities. The growing popularity of plant-based diets opens up vast potential for expansion into new markets. Advancements in biotechnology and food technology pave the way for developing innovative soy-based products with enhanced nutritional profiles and functionalities. Moreover, exploring new applications of soy protein in food and non-food products opens further avenues for growth.
Leading Players in the Soy-Based Foods Industry Market
- Nestle SA
- Vitasoy International Holdings Ltd
- The Amy's Kitchen
- Unilever PLC
- Conagra Brands Inc
- Danone SA
- Monde Nissin Corporation
- Impossible Foods Inc
- Hain Celestial Group
- Good Catch Foods
Key Developments in Soy-Based Foods Industry Industry
- 2022-Q4: Nestle SA launched a new line of soy-based yogurt alternatives.
- 2023-Q1: Unilever PLC acquired a smaller soy-based food company, expanding its product portfolio.
- 2023-Q2: Impossible Foods Inc announced a significant investment in research and development for improved soy protein technology. (Further details on other key developments would be included in the full report.)
Strategic Outlook for Soy-Based Foods Industry Market
The soy-based foods market is poised for significant growth, driven by increasing consumer demand for plant-based alternatives and continuous product innovation. The focus on sustainability and health benefits further strengthens the market outlook. Strategic partnerships, investments in research and development, and expansion into new markets will be key to success for companies operating in this sector. The long-term prospects for the soy-based foods industry remain highly positive.
Soy-Based Foods Industry Segmentation
-
1. Product Type
-
1.1. Meat Substitutes
- 1.1.1. Textured Vegetable Protein
- 1.1.2. Tofu
- 1.1.3. Tempeh
- 1.2. Non-Dairy Ice Cream
- 1.3. Non-Dairy Cheese
- 1.4. Non-Dairy Yogurt
- 1.5. Non-Dairy Spread
-
1.1. Meat Substitutes
-
2. Distribution Channel
- 2.1. Hypermarkets/Supermarkets
- 2.2. Convenience Stores
- 2.3. Online Retail Stores
- 2.4. Other Distribution Channel
Soy-Based Foods Industry Segmentation By Geography
-
1. North America
- 1.1. United States
- 1.2. Canada
- 1.3. Mexico
- 1.4. Rest of North America
-
2. Europe
- 2.1. Germany
- 2.2. United Kingdom
- 2.3. France
- 2.4. Russia
- 2.5. Spain
- 2.6. Rest of Europe
-
3. Asia Pacific
- 3.1. China
- 3.2. Japan
- 3.3. Japan
- 3.4. Australia
- 3.5. Rest of Asia Pacific
-
4. South America
- 4.1. Brazil
- 4.2. Argentina
- 4.3. Rest of South America
-
5. Middle East and Africa
- 5.1. South Africa
- 5.2. Saudi Arabia
- 5.3. Rest of Middle East and Africa

Soy-Based Foods Industry Regional Market Share
Geographic Coverage of Soy-Based Foods Industry
Soy-Based Foods Industry REPORT HIGHLIGHTS
| Aspects | Details |
|---|---|
| Study Period | 2020-2034 |
| Base Year | 2025 |
| Estimated Year | 2026 |
| Forecast Period | 2026-2034 |
| Historical Period | 2020-2025 |
| Growth Rate | CAGR of 6.45% from 2020-2034 |
| Segmentation |
|
Table of Contents
- 1. Introduction
- 1.1. Research Scope
- 1.2. Market Segmentation
- 1.3. Research Methodology
- 1.4. Definitions and Assumptions
- 2. Executive Summary
- 2.1. Introduction
- 3. Market Dynamics
- 3.1. Introduction
- 3.2. Market Drivers
- 3.3. Market Restrains
- 3.4. Market Trends
- 3.4.1. Rising Prevalence of Lactose Intolerant Population
- 4. Market Factor Analysis
- 4.1. Porters Five Forces
- 4.2. Supply/Value Chain
- 4.3. PESTEL analysis
- 4.4. Market Entropy
- 4.5. Patent/Trademark Analysis
- 5. Global Soy-Based Foods Industry Analysis, Insights and Forecast, 2020-2032
- 5.1. Market Analysis, Insights and Forecast - by Product Type
- 5.1.1. Meat Substitutes
- 5.1.1.1. Textured Vegetable Protein
- 5.1.1.2. Tofu
- 5.1.1.3. Tempeh
- 5.1.2. Non-Dairy Ice Cream
- 5.1.3. Non-Dairy Cheese
- 5.1.4. Non-Dairy Yogurt
- 5.1.5. Non-Dairy Spread
- 5.1.1. Meat Substitutes
- 5.2. Market Analysis, Insights and Forecast - by Distribution Channel
- 5.2.1. Hypermarkets/Supermarkets
- 5.2.2. Convenience Stores
- 5.2.3. Online Retail Stores
- 5.2.4. Other Distribution Channel
- 5.3. Market Analysis, Insights and Forecast - by Region
- 5.3.1. North America
- 5.3.2. Europe
- 5.3.3. Asia Pacific
- 5.3.4. South America
- 5.3.5. Middle East and Africa
- 5.1. Market Analysis, Insights and Forecast - by Product Type
- 6. North America Soy-Based Foods Industry Analysis, Insights and Forecast, 2020-2032
- 6.1. Market Analysis, Insights and Forecast - by Product Type
- 6.1.1. Meat Substitutes
- 6.1.1.1. Textured Vegetable Protein
- 6.1.1.2. Tofu
- 6.1.1.3. Tempeh
- 6.1.2. Non-Dairy Ice Cream
- 6.1.3. Non-Dairy Cheese
- 6.1.4. Non-Dairy Yogurt
- 6.1.5. Non-Dairy Spread
- 6.1.1. Meat Substitutes
- 6.2. Market Analysis, Insights and Forecast - by Distribution Channel
- 6.2.1. Hypermarkets/Supermarkets
- 6.2.2. Convenience Stores
- 6.2.3. Online Retail Stores
- 6.2.4. Other Distribution Channel
- 6.1. Market Analysis, Insights and Forecast - by Product Type
- 7. Europe Soy-Based Foods Industry Analysis, Insights and Forecast, 2020-2032
- 7.1. Market Analysis, Insights and Forecast - by Product Type
- 7.1.1. Meat Substitutes
- 7.1.1.1. Textured Vegetable Protein
- 7.1.1.2. Tofu
- 7.1.1.3. Tempeh
- 7.1.2. Non-Dairy Ice Cream
- 7.1.3. Non-Dairy Cheese
- 7.1.4. Non-Dairy Yogurt
- 7.1.5. Non-Dairy Spread
- 7.1.1. Meat Substitutes
- 7.2. Market Analysis, Insights and Forecast - by Distribution Channel
- 7.2.1. Hypermarkets/Supermarkets
- 7.2.2. Convenience Stores
- 7.2.3. Online Retail Stores
- 7.2.4. Other Distribution Channel
- 7.1. Market Analysis, Insights and Forecast - by Product Type
- 8. Asia Pacific Soy-Based Foods Industry Analysis, Insights and Forecast, 2020-2032
- 8.1. Market Analysis, Insights and Forecast - by Product Type
- 8.1.1. Meat Substitutes
- 8.1.1.1. Textured Vegetable Protein
- 8.1.1.2. Tofu
- 8.1.1.3. Tempeh
- 8.1.2. Non-Dairy Ice Cream
- 8.1.3. Non-Dairy Cheese
- 8.1.4. Non-Dairy Yogurt
- 8.1.5. Non-Dairy Spread
- 8.1.1. Meat Substitutes
- 8.2. Market Analysis, Insights and Forecast - by Distribution Channel
- 8.2.1. Hypermarkets/Supermarkets
- 8.2.2. Convenience Stores
- 8.2.3. Online Retail Stores
- 8.2.4. Other Distribution Channel
- 8.1. Market Analysis, Insights and Forecast - by Product Type
- 9. South America Soy-Based Foods Industry Analysis, Insights and Forecast, 2020-2032
- 9.1. Market Analysis, Insights and Forecast - by Product Type
- 9.1.1. Meat Substitutes
- 9.1.1.1. Textured Vegetable Protein
- 9.1.1.2. Tofu
- 9.1.1.3. Tempeh
- 9.1.2. Non-Dairy Ice Cream
- 9.1.3. Non-Dairy Cheese
- 9.1.4. Non-Dairy Yogurt
- 9.1.5. Non-Dairy Spread
- 9.1.1. Meat Substitutes
- 9.2. Market Analysis, Insights and Forecast - by Distribution Channel
- 9.2.1. Hypermarkets/Supermarkets
- 9.2.2. Convenience Stores
- 9.2.3. Online Retail Stores
- 9.2.4. Other Distribution Channel
- 9.1. Market Analysis, Insights and Forecast - by Product Type
- 10. Middle East and Africa Soy-Based Foods Industry Analysis, Insights and Forecast, 2020-2032
- 10.1. Market Analysis, Insights and Forecast - by Product Type
- 10.1.1. Meat Substitutes
- 10.1.1.1. Textured Vegetable Protein
- 10.1.1.2. Tofu
- 10.1.1.3. Tempeh
- 10.1.2. Non-Dairy Ice Cream
- 10.1.3. Non-Dairy Cheese
- 10.1.4. Non-Dairy Yogurt
- 10.1.5. Non-Dairy Spread
- 10.1.1. Meat Substitutes
- 10.2. Market Analysis, Insights and Forecast - by Distribution Channel
- 10.2.1. Hypermarkets/Supermarkets
- 10.2.2. Convenience Stores
- 10.2.3. Online Retail Stores
- 10.2.4. Other Distribution Channel
- 10.1. Market Analysis, Insights and Forecast - by Product Type
- 11. Competitive Analysis
- 11.1. Global Market Share Analysis 2025
- 11.2. Company Profiles
- 11.2.1 Nestle SA
- 11.2.1.1. Overview
- 11.2.1.2. Products
- 11.2.1.3. SWOT Analysis
- 11.2.1.4. Recent Developments
- 11.2.1.5. Financials (Based on Availability)
- 11.2.2 Vitasoy International Holdings Ltd
- 11.2.2.1. Overview
- 11.2.2.2. Products
- 11.2.2.3. SWOT Analysis
- 11.2.2.4. Recent Developments
- 11.2.2.5. Financials (Based on Availability)
- 11.2.3 The Amy's Kitche
- 11.2.3.1. Overview
- 11.2.3.2. Products
- 11.2.3.3. SWOT Analysis
- 11.2.3.4. Recent Developments
- 11.2.3.5. Financials (Based on Availability)
- 11.2.4 Unilever PLC
- 11.2.4.1. Overview
- 11.2.4.2. Products
- 11.2.4.3. SWOT Analysis
- 11.2.4.4. Recent Developments
- 11.2.4.5. Financials (Based on Availability)
- 11.2.5 Conagra Brands Inc
- 11.2.5.1. Overview
- 11.2.5.2. Products
- 11.2.5.3. SWOT Analysis
- 11.2.5.4. Recent Developments
- 11.2.5.5. Financials (Based on Availability)
- 11.2.6 Danone SA
- 11.2.6.1. Overview
- 11.2.6.2. Products
- 11.2.6.3. SWOT Analysis
- 11.2.6.4. Recent Developments
- 11.2.6.5. Financials (Based on Availability)
- 11.2.7 Monde Nissin Corporation
- 11.2.7.1. Overview
- 11.2.7.2. Products
- 11.2.7.3. SWOT Analysis
- 11.2.7.4. Recent Developments
- 11.2.7.5. Financials (Based on Availability)
- 11.2.8 Impossible Foods Inc
- 11.2.8.1. Overview
- 11.2.8.2. Products
- 11.2.8.3. SWOT Analysis
- 11.2.8.4. Recent Developments
- 11.2.8.5. Financials (Based on Availability)
- 11.2.9 Hain Celestial Group
- 11.2.9.1. Overview
- 11.2.9.2. Products
- 11.2.9.3. SWOT Analysis
- 11.2.9.4. Recent Developments
- 11.2.9.5. Financials (Based on Availability)
- 11.2.10 Good Catch Foods
- 11.2.10.1. Overview
- 11.2.10.2. Products
- 11.2.10.3. SWOT Analysis
- 11.2.10.4. Recent Developments
- 11.2.10.5. Financials (Based on Availability)
- 11.2.1 Nestle SA
List of Figures
- Figure 1: Global Soy-Based Foods Industry Revenue Breakdown (Million, %) by Region 2025 & 2033
- Figure 2: North America Soy-Based Foods Industry Revenue (Million), by Product Type 2025 & 2033
- Figure 3: North America Soy-Based Foods Industry Revenue Share (%), by Product Type 2025 & 2033
- Figure 4: North America Soy-Based Foods Industry Revenue (Million), by Distribution Channel 2025 & 2033
- Figure 5: North America Soy-Based Foods Industry Revenue Share (%), by Distribution Channel 2025 & 2033
- Figure 6: North America Soy-Based Foods Industry Revenue (Million), by Country 2025 & 2033
- Figure 7: North America Soy-Based Foods Industry Revenue Share (%), by Country 2025 & 2033
- Figure 8: Europe Soy-Based Foods Industry Revenue (Million), by Product Type 2025 & 2033
- Figure 9: Europe Soy-Based Foods Industry Revenue Share (%), by Product Type 2025 & 2033
- Figure 10: Europe Soy-Based Foods Industry Revenue (Million), by Distribution Channel 2025 & 2033
- Figure 11: Europe Soy-Based Foods Industry Revenue Share (%), by Distribution Channel 2025 & 2033
- Figure 12: Europe Soy-Based Foods Industry Revenue (Million), by Country 2025 & 2033
- Figure 13: Europe Soy-Based Foods Industry Revenue Share (%), by Country 2025 & 2033
- Figure 14: Asia Pacific Soy-Based Foods Industry Revenue (Million), by Product Type 2025 & 2033
- Figure 15: Asia Pacific Soy-Based Foods Industry Revenue Share (%), by Product Type 2025 & 2033
- Figure 16: Asia Pacific Soy-Based Foods Industry Revenue (Million), by Distribution Channel 2025 & 2033
- Figure 17: Asia Pacific Soy-Based Foods Industry Revenue Share (%), by Distribution Channel 2025 & 2033
- Figure 18: Asia Pacific Soy-Based Foods Industry Revenue (Million), by Country 2025 & 2033
- Figure 19: Asia Pacific Soy-Based Foods Industry Revenue Share (%), by Country 2025 & 2033
- Figure 20: South America Soy-Based Foods Industry Revenue (Million), by Product Type 2025 & 2033
- Figure 21: South America Soy-Based Foods Industry Revenue Share (%), by Product Type 2025 & 2033
- Figure 22: South America Soy-Based Foods Industry Revenue (Million), by Distribution Channel 2025 & 2033
- Figure 23: South America Soy-Based Foods Industry Revenue Share (%), by Distribution Channel 2025 & 2033
- Figure 24: South America Soy-Based Foods Industry Revenue (Million), by Country 2025 & 2033
- Figure 25: South America Soy-Based Foods Industry Revenue Share (%), by Country 2025 & 2033
- Figure 26: Middle East and Africa Soy-Based Foods Industry Revenue (Million), by Product Type 2025 & 2033
- Figure 27: Middle East and Africa Soy-Based Foods Industry Revenue Share (%), by Product Type 2025 & 2033
- Figure 28: Middle East and Africa Soy-Based Foods Industry Revenue (Million), by Distribution Channel 2025 & 2033
- Figure 29: Middle East and Africa Soy-Based Foods Industry Revenue Share (%), by Distribution Channel 2025 & 2033
- Figure 30: Middle East and Africa Soy-Based Foods Industry Revenue (Million), by Country 2025 & 2033
- Figure 31: Middle East and Africa Soy-Based Foods Industry Revenue Share (%), by Country 2025 & 2033
List of Tables
- Table 1: Global Soy-Based Foods Industry Revenue Million Forecast, by Product Type 2020 & 2033
- Table 2: Global Soy-Based Foods Industry Revenue Million Forecast, by Distribution Channel 2020 & 2033
- Table 3: Global Soy-Based Foods Industry Revenue Million Forecast, by Region 2020 & 2033
- Table 4: Global Soy-Based Foods Industry Revenue Million Forecast, by Product Type 2020 & 2033
- Table 5: Global Soy-Based Foods Industry Revenue Million Forecast, by Distribution Channel 2020 & 2033
- Table 6: Global Soy-Based Foods Industry Revenue Million Forecast, by Country 2020 & 2033
- Table 7: United States Soy-Based Foods Industry Revenue (Million) Forecast, by Application 2020 & 2033
- Table 8: Canada Soy-Based Foods Industry Revenue (Million) Forecast, by Application 2020 & 2033
- Table 9: Mexico Soy-Based Foods Industry Revenue (Million) Forecast, by Application 2020 & 2033
- Table 10: Rest of North America Soy-Based Foods Industry Revenue (Million) Forecast, by Application 2020 & 2033
- Table 11: Global Soy-Based Foods Industry Revenue Million Forecast, by Product Type 2020 & 2033
- Table 12: Global Soy-Based Foods Industry Revenue Million Forecast, by Distribution Channel 2020 & 2033
- Table 13: Global Soy-Based Foods Industry Revenue Million Forecast, by Country 2020 & 2033
- Table 14: Germany Soy-Based Foods Industry Revenue (Million) Forecast, by Application 2020 & 2033
- Table 15: United Kingdom Soy-Based Foods Industry Revenue (Million) Forecast, by Application 2020 & 2033
- Table 16: France Soy-Based Foods Industry Revenue (Million) Forecast, by Application 2020 & 2033
- Table 17: Russia Soy-Based Foods Industry Revenue (Million) Forecast, by Application 2020 & 2033
- Table 18: Spain Soy-Based Foods Industry Revenue (Million) Forecast, by Application 2020 & 2033
- Table 19: Rest of Europe Soy-Based Foods Industry Revenue (Million) Forecast, by Application 2020 & 2033
- Table 20: Global Soy-Based Foods Industry Revenue Million Forecast, by Product Type 2020 & 2033
- Table 21: Global Soy-Based Foods Industry Revenue Million Forecast, by Distribution Channel 2020 & 2033
- Table 22: Global Soy-Based Foods Industry Revenue Million Forecast, by Country 2020 & 2033
- Table 23: China Soy-Based Foods Industry Revenue (Million) Forecast, by Application 2020 & 2033
- Table 24: Japan Soy-Based Foods Industry Revenue (Million) Forecast, by Application 2020 & 2033
- Table 25: Japan Soy-Based Foods Industry Revenue (Million) Forecast, by Application 2020 & 2033
- Table 26: Australia Soy-Based Foods Industry Revenue (Million) Forecast, by Application 2020 & 2033
- Table 27: Rest of Asia Pacific Soy-Based Foods Industry Revenue (Million) Forecast, by Application 2020 & 2033
- Table 28: Global Soy-Based Foods Industry Revenue Million Forecast, by Product Type 2020 & 2033
- Table 29: Global Soy-Based Foods Industry Revenue Million Forecast, by Distribution Channel 2020 & 2033
- Table 30: Global Soy-Based Foods Industry Revenue Million Forecast, by Country 2020 & 2033
- Table 31: Brazil Soy-Based Foods Industry Revenue (Million) Forecast, by Application 2020 & 2033
- Table 32: Argentina Soy-Based Foods Industry Revenue (Million) Forecast, by Application 2020 & 2033
- Table 33: Rest of South America Soy-Based Foods Industry Revenue (Million) Forecast, by Application 2020 & 2033
- Table 34: Global Soy-Based Foods Industry Revenue Million Forecast, by Product Type 2020 & 2033
- Table 35: Global Soy-Based Foods Industry Revenue Million Forecast, by Distribution Channel 2020 & 2033
- Table 36: Global Soy-Based Foods Industry Revenue Million Forecast, by Country 2020 & 2033
- Table 37: South Africa Soy-Based Foods Industry Revenue (Million) Forecast, by Application 2020 & 2033
- Table 38: Saudi Arabia Soy-Based Foods Industry Revenue (Million) Forecast, by Application 2020 & 2033
- Table 39: Rest of Middle East and Africa Soy-Based Foods Industry Revenue (Million) Forecast, by Application 2020 & 2033
Frequently Asked Questions
1. What is the projected Compound Annual Growth Rate (CAGR) of the Soy-Based Foods Industry?
The projected CAGR is approximately 6.45%.
2. Which companies are prominent players in the Soy-Based Foods Industry?
Key companies in the market include Nestle SA, Vitasoy International Holdings Ltd, The Amy's Kitche, Unilever PLC, Conagra Brands Inc, Danone SA, Monde Nissin Corporation, Impossible Foods Inc, Hain Celestial Group, Good Catch Foods.
3. What are the main segments of the Soy-Based Foods Industry?
The market segments include Product Type, Distribution Channel.
4. Can you provide details about the market size?
The market size is estimated to be USD 28.32 Million as of 2022.
5. What are some drivers contributing to market growth?
N/A
6. What are the notable trends driving market growth?
Rising Prevalence of Lactose Intolerant Population.
7. Are there any restraints impacting market growth?
N/A
8. Can you provide examples of recent developments in the market?
N/A
9. What pricing options are available for accessing the report?
Pricing options include single-user, multi-user, and enterprise licenses priced at USD 4750, USD 5250, and USD 8750 respectively.
10. Is the market size provided in terms of value or volume?
The market size is provided in terms of value, measured in Million.
11. Are there any specific market keywords associated with the report?
Yes, the market keyword associated with the report is "Soy-Based Foods Industry," which aids in identifying and referencing the specific market segment covered.
12. How do I determine which pricing option suits my needs best?
The pricing options vary based on user requirements and access needs. Individual users may opt for single-user licenses, while businesses requiring broader access may choose multi-user or enterprise licenses for cost-effective access to the report.
13. Are there any additional resources or data provided in the Soy-Based Foods Industry report?
While the report offers comprehensive insights, it's advisable to review the specific contents or supplementary materials provided to ascertain if additional resources or data are available.
14. How can I stay updated on further developments or reports in the Soy-Based Foods Industry?
To stay informed about further developments, trends, and reports in the Soy-Based Foods Industry, consider subscribing to industry newsletters, following relevant companies and organizations, or regularly checking reputable industry news sources and publications.
Methodology
Step 1 - Identification of Relevant Samples Size from Population Database


Step 2 - Approaches for Defining Global Market Size (Value, Volume* & Price*)

Note*: In applicable scenarios
Step 3 - Data Sources
Primary Research
- Web Analytics
- Survey Reports
- Research Institute
- Latest Research Reports
- Opinion Leaders
Secondary Research
- Annual Reports
- White Paper
- Latest Press Release
- Industry Association
- Paid Database
- Investor Presentations

Step 4 - Data Triangulation
Involves using different sources of information in order to increase the validity of a study
These sources are likely to be stakeholders in a program - participants, other researchers, program staff, other community members, and so on.
Then we put all data in single framework & apply various statistical tools to find out the dynamic on the market.
During the analysis stage, feedback from the stakeholder groups would be compared to determine areas of agreement as well as areas of divergence