
Key Insights
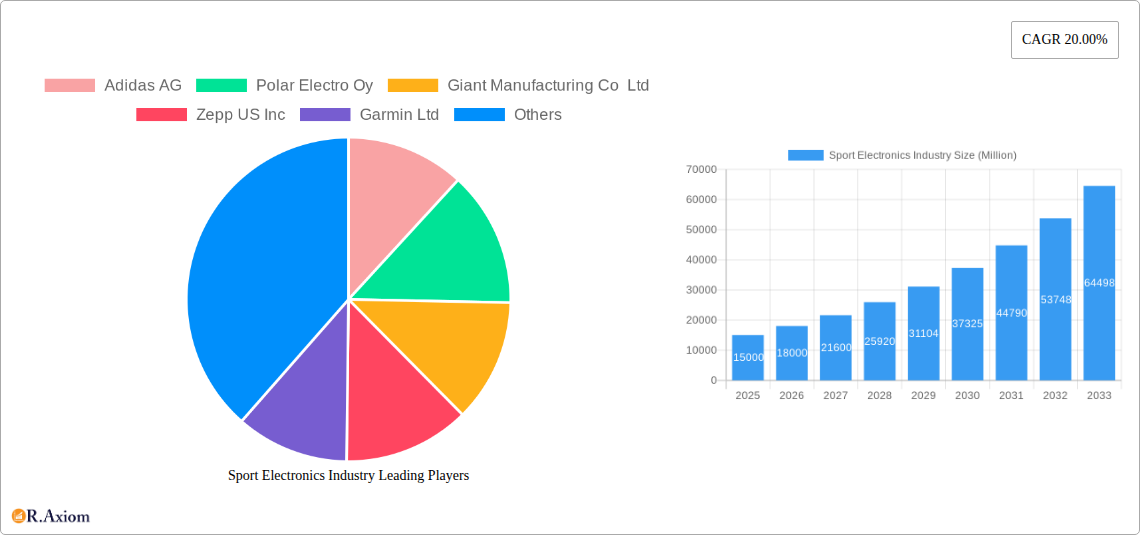
The global sport electronics market, exhibiting a robust Compound Annual Growth Rate (CAGR) of 20%, is projected to experience significant expansion from 2025 to 2033. This growth is fueled by several key drivers. The increasing popularity of fitness activities and athletic training, coupled with the rising adoption of wearable technology for performance monitoring and data analysis, are significantly boosting market demand. Technological advancements, such as the development of more sophisticated sensors, improved battery life, and enhanced data analytics capabilities within wearable devices are further propelling market growth. Furthermore, the integration of sport electronics into broader health and wellness ecosystems, along with the increasing availability of user-friendly applications and platforms for data visualization and personalized training plans, contribute to sustained market expansion. The market segments, dominated by wearable devices (including standalone units), are experiencing a rapid rise due to their convenience and user-friendly interface. Major players like Adidas, Polar, Garmin, Fitbit, and Apple are leveraging technological innovations and strategic partnerships to maintain a competitive edge within this rapidly evolving landscape.
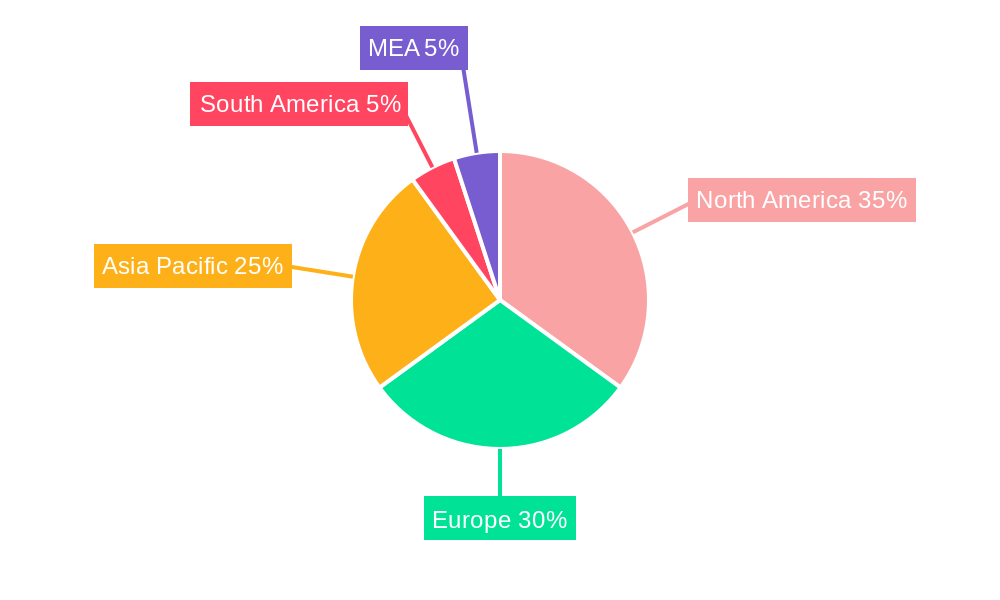
Geographic expansion also plays a crucial role in market growth. North America and Europe currently hold significant market shares due to high consumer spending on fitness and technology. However, the Asia-Pacific region is poised for considerable growth, driven by increasing disposable incomes, rising health awareness, and expanding adoption of smart technology across countries like China, India, and Japan. While challenges such as high initial costs of advanced devices and concerns regarding data privacy may pose some restraints, the overall market trajectory remains strongly positive, promising substantial growth opportunities for existing and emerging players throughout the forecast period. This strong growth suggests a substantial market expansion well beyond the initial projected value, driven by sustained technological advancement and increasing consumer demand.
This comprehensive report provides a detailed analysis of the global Sport Electronics industry, covering market size, growth projections, key segments, competitive landscape, and future outlook. The study period spans from 2019 to 2033, with 2025 serving as both the base and estimated year. The forecast period extends from 2025 to 2033, while historical data covers 2019–2024. The report offers actionable insights for industry stakeholders, including manufacturers, investors, and researchers. Total market value is projected to reach xx Million by 2033.
Sport Electronics Industry Market Concentration & Innovation
This section analyzes the market concentration, innovation drivers, regulatory frameworks, product substitutes, end-user trends, and mergers & acquisitions (M&A) activities within the sport electronics industry.
The industry exhibits moderate concentration, with a few major players holding significant market share. For instance, Apple Inc. and Nike Inc. together account for an estimated xx% of the global market in 2025. However, numerous smaller players focusing on niche segments contribute to overall market dynamism.
- Market Share (2025): Apple Inc. (xx%), Nike Inc. (xx%), Adidas AG (xx%), Garmin Ltd. (xx%), Fitbit Inc. (xx%), Others (xx%).
- Innovation Drivers: Advancements in sensor technology, miniaturization, data analytics, and connectivity are key innovation drivers. The integration of AI and machine learning is also significantly impacting product development and user experience.
- Regulatory Framework: Regulations regarding data privacy, product safety, and intellectual property rights influence industry operations. Variations in regulations across different regions pose challenges for global players.
- Product Substitutes: Traditional methods of fitness tracking and performance monitoring represent the primary substitute for sport electronics. However, the increasing accuracy, convenience, and functionality of sport electronics are gradually reducing their relevance.
- End-User Trends: Growing health consciousness, increasing participation in sports and fitness activities, and the rising adoption of wearable technology are driving market growth.
- M&A Activities: Significant M&A activity has been observed in the past five years, with deal values exceeding xx Million. These activities are driven by the need to expand product portfolios, enhance technological capabilities, and secure market share. Notable examples include [Insert specific examples of M&A deals if available, along with values. Otherwise state "Specific details are not publicly available"].
Sport Electronics Industry Industry Trends & Insights
This section explores the key trends and insights shaping the sport electronics industry. The industry is experiencing robust growth driven by several factors, including:
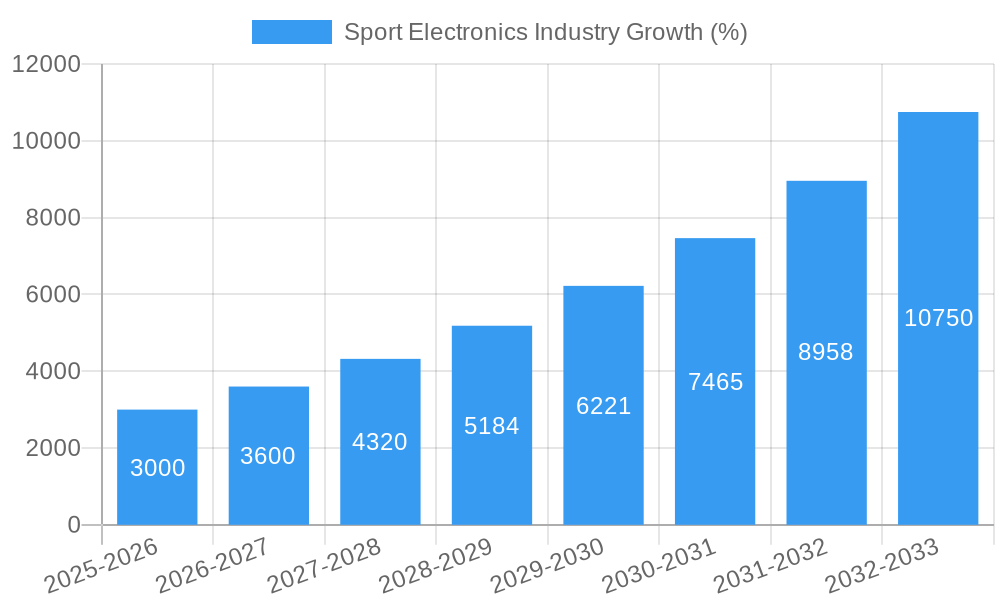
The market demonstrates a Compound Annual Growth Rate (CAGR) of xx% during the forecast period (2025-2033). This growth is primarily attributed to rising consumer disposable income, increased health awareness, technological advancements, and the growing popularity of fitness and sports activities globally. Market penetration of wearable devices is expected to reach xx% by 2033.
Technological disruptions, including the integration of advanced sensors, improved battery life, and more sophisticated data analysis capabilities, are transforming the landscape. Consumer preferences are shifting towards personalized experiences, smart features, and seamless data integration with other health and fitness apps. Competitive dynamics are characterized by both intense competition among established players and the emergence of innovative startups. Key competitive strategies include product differentiation, strategic partnerships, and aggressive marketing campaigns.
Dominant Markets & Segments in Sport Electronics Industry
This section identifies the leading regions, countries, and segments within the sport electronics industry.
By Product Type:
Wearable Devices: This segment dominates the market, driven by the increasing popularity of smartwatches, fitness trackers, and other wearable electronics. Key drivers for dominance include:
- Technological advancements: Miniaturization, improved sensor technology, and longer battery life have enhanced usability and appeal.
- Convenience and accessibility: Wearable devices provide users with convenient and readily available health and fitness data.
- Growing health awareness: Consumers are increasingly focused on personal health and wellness, driving demand for wearable devices to track fitness activities and vital signs.
Other Wearable Devices: Standalone Devices: This segment includes devices like GPS sports watches, heart rate monitors, and cycling computers. Growth is driven by the increasing demand for specialized devices in professional and amateur sports. Key factors include:
- Advanced features: These devices offer specialized features tailored to specific sports and activities.
- Accuracy and reliability: Standalone devices are often preferred for their accuracy and reliability in capturing crucial data.
- Increased participation in sports: Higher participation in athletic and outdoor activities boosts demand for dedicated equipment.
Geographic Dominance: North America currently holds the largest market share, followed by Europe and Asia-Pacific. The dominance is primarily due to high disposable incomes, strong adoption rates of technology, and a high degree of health consciousness. Growth in emerging markets is expected to accelerate in the forecast period, driven by rising middle-class populations and increasing access to technology.
- Key drivers for North America's dominance include: well-established sports culture, high disposable incomes, access to advanced technology, and robust healthcare infrastructure.
- Key drivers for Europe's market include strong government support for sports and wellness initiatives, high awareness of health and fitness, and a well-developed technology sector.
- Key drivers for Asia-Pacific's market include a rapidly growing middle-class population, increasing urbanization, rising health consciousness, and a booming e-commerce sector.
Sport Electronics Industry Product Developments
Recent product innovations include enhanced sensor technology, improved data analytics capabilities, and the integration of artificial intelligence. New applications focus on personalized training programs, injury prevention, and enhanced performance monitoring. Competitive advantages are derived from superior accuracy, innovative designs, seamless integration with other health and fitness platforms, and compelling user interfaces. The market trend moves toward user-friendly interfaces with personalized data presentation and actionable insights.
Report Scope & Segmentation Analysis
This report segments the sport electronics market by product type: Wearable Devices (Smartwatches, Fitness Trackers, etc.) and Other Wearable Devices (Standalone GPS devices, Heart Rate Monitors, etc.). Each segment is analyzed based on historical data, current market size, and future growth projections. Competitive dynamics within each segment are also examined, including key players, market share, and strategies. The wearable device segment is projected to experience a xx% CAGR, reaching xx Million by 2033. The other wearable devices segment is expected to have a xx% CAGR, reaching xx Million by 2033.
Key Drivers of Sport Electronics Industry Growth
Several key factors are driving the growth of the sport electronics industry. These include: technological advancements in sensor technology and data analytics, increasing health consciousness among consumers globally, rising disposable incomes, particularly in emerging markets, and government initiatives promoting healthy lifestyles and sporting activities. The rise in popularity of wearable fitness trackers and smartwatches is a major catalyst for market growth.
Challenges in the Sport Electronics Industry Sector
The sport electronics industry faces challenges including intense competition, rising component costs, the need for continuous innovation to stay ahead, and the potential for data privacy concerns. Supply chain disruptions can also impact production and availability of products. Furthermore, stringent regulatory requirements related to data security and product safety add complexity to operations. These factors collectively impact profitability and overall market growth. Specifically, supply chain disruptions in 2022 resulted in a xx% decrease in production for some major players, highlighting vulnerability in this area.
Emerging Opportunities in Sport Electronics Industry
Emerging opportunities lie in the development of highly personalized training programs based on AI-powered data analysis, integration with broader health and wellness platforms, and expansion into new markets, especially in emerging economies. The integration of augmented and virtual reality technologies into fitness and sports training also presents significant opportunities. There is also potential in developing specialized devices for niche sports and activities.
Leading Players in the Sport Electronics Industry Market
- Adidas AG
- Polar Electro Oy
- Giant Manufacturing Co Ltd
- Zepp US Inc
- Garmin Ltd
- StretchSense Ltd
- SZ DJI Technology Co Ltd
- Fitbit Inc
- Catapult Sports Pty Ltd
- Apple Inc
- Nike Inc
- Under Armour
Key Developments in Sport Electronics Industry Industry
- January 2023: Apple Inc. launched a new generation of Apple Watch with enhanced health monitoring capabilities.
- March 2022: Garmin Ltd. released a new line of GPS sports watches with improved battery life and enhanced features.
- [Insert other significant developments with dates and brief descriptions of impact]
Strategic Outlook for Sport Electronics Industry Market
The future of the sport electronics industry is bright, driven by continuous technological advancements, increasing health awareness, and growing participation in sports and fitness activities globally. The market will witness further innovation in areas such as personalized fitness solutions, advanced data analytics, and seamless integration with other health and wellness platforms. Expansion into new markets and the development of specialized devices for niche sports will also contribute to sustained growth in the coming years. The focus will be on delivering accurate, personalized, and actionable insights to help users improve their health and performance.
Sport Electronics Industry Segmentation
-
1. Product Type
-
1.1. Wearable Devices
- 1.1.1. Pedometers
- 1.1.2. Activity Monitors
- 1.1.3. Smart Fabrics
- 1.1.4. Fitness and Heart Rate Monitors
- 1.1.5. Other Wearable Devices
-
1.2. Standalone Devices
- 1.2.1. Electronics Scales
- 1.2.2. Cameras
- 1.2.3. Cycling Computers
- 1.2.4. Other Standalone Devices
-
1.1. Wearable Devices
Sport Electronics Industry Segmentation By Geography
- 1. North America
- 2. Europe
- 3. Asia Pacific
- 4. Latin America
- 5. Middle East
Sport Electronics Industry REPORT HIGHLIGHTS
| Aspects | Details |
|---|---|
| Study Period | 2019-2033 |
| Base Year | 2024 |
| Estimated Year | 2025 |
| Forecast Period | 2025-2033 |
| Historical Period | 2019-2024 |
| Growth Rate | CAGR of 20.00% from 2019-2033 |
| Segmentation |
|
Table of Contents
- 1. Introduction
- 1.1. Research Scope
- 1.2. Market Segmentation
- 1.3. Research Methodology
- 1.4. Definitions and Assumptions
- 2. Executive Summary
- 2.1. Introduction
- 3. Market Dynamics
- 3.1. Introduction
- 3.2. Market Drivers
- 3.2.1. ; Technological Advancements in Wearable Sports Devices; Rising Demand for Round-The-Clock Monitoring
- 3.3. Market Restrains
- 3.3.1. ; High Cost of Wearable Devices
- 3.4. Market Trends
- 3.4.1. Smartwatch is Expected to Register a Significant Growth
- 4. Market Factor Analysis
- 4.1. Porters Five Forces
- 4.2. Supply/Value Chain
- 4.3. PESTEL analysis
- 4.4. Market Entropy
- 4.5. Patent/Trademark Analysis
- 5. Global Sport Electronics Industry Analysis, Insights and Forecast, 2019-2031
- 5.1. Market Analysis, Insights and Forecast - by Product Type
- 5.1.1. Wearable Devices
- 5.1.1.1. Pedometers
- 5.1.1.2. Activity Monitors
- 5.1.1.3. Smart Fabrics
- 5.1.1.4. Fitness and Heart Rate Monitors
- 5.1.1.5. Other Wearable Devices
- 5.1.2. Standalone Devices
- 5.1.2.1. Electronics Scales
- 5.1.2.2. Cameras
- 5.1.2.3. Cycling Computers
- 5.1.2.4. Other Standalone Devices
- 5.1.1. Wearable Devices
- 5.2. Market Analysis, Insights and Forecast - by Region
- 5.2.1. North America
- 5.2.2. Europe
- 5.2.3. Asia Pacific
- 5.2.4. Latin America
- 5.2.5. Middle East
- 5.1. Market Analysis, Insights and Forecast - by Product Type
- 6. North America Sport Electronics Industry Analysis, Insights and Forecast, 2019-2031
- 6.1. Market Analysis, Insights and Forecast - by Product Type
- 6.1.1. Wearable Devices
- 6.1.1.1. Pedometers
- 6.1.1.2. Activity Monitors
- 6.1.1.3. Smart Fabrics
- 6.1.1.4. Fitness and Heart Rate Monitors
- 6.1.1.5. Other Wearable Devices
- 6.1.2. Standalone Devices
- 6.1.2.1. Electronics Scales
- 6.1.2.2. Cameras
- 6.1.2.3. Cycling Computers
- 6.1.2.4. Other Standalone Devices
- 6.1.1. Wearable Devices
- 6.1. Market Analysis, Insights and Forecast - by Product Type
- 7. Europe Sport Electronics Industry Analysis, Insights and Forecast, 2019-2031
- 7.1. Market Analysis, Insights and Forecast - by Product Type
- 7.1.1. Wearable Devices
- 7.1.1.1. Pedometers
- 7.1.1.2. Activity Monitors
- 7.1.1.3. Smart Fabrics
- 7.1.1.4. Fitness and Heart Rate Monitors
- 7.1.1.5. Other Wearable Devices
- 7.1.2. Standalone Devices
- 7.1.2.1. Electronics Scales
- 7.1.2.2. Cameras
- 7.1.2.3. Cycling Computers
- 7.1.2.4. Other Standalone Devices
- 7.1.1. Wearable Devices
- 7.1. Market Analysis, Insights and Forecast - by Product Type
- 8. Asia Pacific Sport Electronics Industry Analysis, Insights and Forecast, 2019-2031
- 8.1. Market Analysis, Insights and Forecast - by Product Type
- 8.1.1. Wearable Devices
- 8.1.1.1. Pedometers
- 8.1.1.2. Activity Monitors
- 8.1.1.3. Smart Fabrics
- 8.1.1.4. Fitness and Heart Rate Monitors
- 8.1.1.5. Other Wearable Devices
- 8.1.2. Standalone Devices
- 8.1.2.1. Electronics Scales
- 8.1.2.2. Cameras
- 8.1.2.3. Cycling Computers
- 8.1.2.4. Other Standalone Devices
- 8.1.1. Wearable Devices
- 8.1. Market Analysis, Insights and Forecast - by Product Type
- 9. Latin America Sport Electronics Industry Analysis, Insights and Forecast, 2019-2031
- 9.1. Market Analysis, Insights and Forecast - by Product Type
- 9.1.1. Wearable Devices
- 9.1.1.1. Pedometers
- 9.1.1.2. Activity Monitors
- 9.1.1.3. Smart Fabrics
- 9.1.1.4. Fitness and Heart Rate Monitors
- 9.1.1.5. Other Wearable Devices
- 9.1.2. Standalone Devices
- 9.1.2.1. Electronics Scales
- 9.1.2.2. Cameras
- 9.1.2.3. Cycling Computers
- 9.1.2.4. Other Standalone Devices
- 9.1.1. Wearable Devices
- 9.1. Market Analysis, Insights and Forecast - by Product Type
- 10. Middle East Sport Electronics Industry Analysis, Insights and Forecast, 2019-2031
- 10.1. Market Analysis, Insights and Forecast - by Product Type
- 10.1.1. Wearable Devices
- 10.1.1.1. Pedometers
- 10.1.1.2. Activity Monitors
- 10.1.1.3. Smart Fabrics
- 10.1.1.4. Fitness and Heart Rate Monitors
- 10.1.1.5. Other Wearable Devices
- 10.1.2. Standalone Devices
- 10.1.2.1. Electronics Scales
- 10.1.2.2. Cameras
- 10.1.2.3. Cycling Computers
- 10.1.2.4. Other Standalone Devices
- 10.1.1. Wearable Devices
- 10.1. Market Analysis, Insights and Forecast - by Product Type
- 11. North America Sport Electronics Industry Analysis, Insights and Forecast, 2019-2031
- 11.1. Market Analysis, Insights and Forecast - By Country/Sub-region
- 11.1.1 United States
- 11.1.2 Canada
- 11.1.3 Mexico
- 12. Europe Sport Electronics Industry Analysis, Insights and Forecast, 2019-2031
- 12.1. Market Analysis, Insights and Forecast - By Country/Sub-region
- 12.1.1 Germany
- 12.1.2 United Kingdom
- 12.1.3 France
- 12.1.4 Spain
- 12.1.5 Italy
- 12.1.6 Spain
- 12.1.7 Belgium
- 12.1.8 Netherland
- 12.1.9 Nordics
- 12.1.10 Rest of Europe
- 13. Asia Pacific Sport Electronics Industry Analysis, Insights and Forecast, 2019-2031
- 13.1. Market Analysis, Insights and Forecast - By Country/Sub-region
- 13.1.1 China
- 13.1.2 Japan
- 13.1.3 India
- 13.1.4 South Korea
- 13.1.5 Southeast Asia
- 13.1.6 Australia
- 13.1.7 Indonesia
- 13.1.8 Phillipes
- 13.1.9 Singapore
- 13.1.10 Thailandc
- 13.1.11 Rest of Asia Pacific
- 14. South America Sport Electronics Industry Analysis, Insights and Forecast, 2019-2031
- 14.1. Market Analysis, Insights and Forecast - By Country/Sub-region
- 14.1.1 Brazil
- 14.1.2 Argentina
- 14.1.3 Peru
- 14.1.4 Chile
- 14.1.5 Colombia
- 14.1.6 Ecuador
- 14.1.7 Venezuela
- 14.1.8 Rest of South America
- 15. North America Sport Electronics Industry Analysis, Insights and Forecast, 2019-2031
- 15.1. Market Analysis, Insights and Forecast - By Country/Sub-region
- 15.1.1 United States
- 15.1.2 Canada
- 15.1.3 Mexico
- 16. MEA Sport Electronics Industry Analysis, Insights and Forecast, 2019-2031
- 16.1. Market Analysis, Insights and Forecast - By Country/Sub-region
- 16.1.1 United Arab Emirates
- 16.1.2 Saudi Arabia
- 16.1.3 South Africa
- 16.1.4 Rest of Middle East and Africa
- 17. Competitive Analysis
- 17.1. Global Market Share Analysis 2024
- 17.2. Company Profiles
- 17.2.1 Adidas AG
- 17.2.1.1. Overview
- 17.2.1.2. Products
- 17.2.1.3. SWOT Analysis
- 17.2.1.4. Recent Developments
- 17.2.1.5. Financials (Based on Availability)
- 17.2.2 Polar Electro Oy
- 17.2.2.1. Overview
- 17.2.2.2. Products
- 17.2.2.3. SWOT Analysis
- 17.2.2.4. Recent Developments
- 17.2.2.5. Financials (Based on Availability)
- 17.2.3 Giant Manufacturing Co Ltd
- 17.2.3.1. Overview
- 17.2.3.2. Products
- 17.2.3.3. SWOT Analysis
- 17.2.3.4. Recent Developments
- 17.2.3.5. Financials (Based on Availability)
- 17.2.4 Zepp US Inc
- 17.2.4.1. Overview
- 17.2.4.2. Products
- 17.2.4.3. SWOT Analysis
- 17.2.4.4. Recent Developments
- 17.2.4.5. Financials (Based on Availability)
- 17.2.5 Garmin Ltd
- 17.2.5.1. Overview
- 17.2.5.2. Products
- 17.2.5.3. SWOT Analysis
- 17.2.5.4. Recent Developments
- 17.2.5.5. Financials (Based on Availability)
- 17.2.6 StretchSense Ltd
- 17.2.6.1. Overview
- 17.2.6.2. Products
- 17.2.6.3. SWOT Analysis
- 17.2.6.4. Recent Developments
- 17.2.6.5. Financials (Based on Availability)
- 17.2.7 SZ DJI Technology Co Ltd
- 17.2.7.1. Overview
- 17.2.7.2. Products
- 17.2.7.3. SWOT Analysis
- 17.2.7.4. Recent Developments
- 17.2.7.5. Financials (Based on Availability)
- 17.2.8 Fitbit Inc
- 17.2.8.1. Overview
- 17.2.8.2. Products
- 17.2.8.3. SWOT Analysis
- 17.2.8.4. Recent Developments
- 17.2.8.5. Financials (Based on Availability)
- 17.2.9 Catapult Sports Pty Ltd
- 17.2.9.1. Overview
- 17.2.9.2. Products
- 17.2.9.3. SWOT Analysis
- 17.2.9.4. Recent Developments
- 17.2.9.5. Financials (Based on Availability)
- 17.2.10 Apple Inc
- 17.2.10.1. Overview
- 17.2.10.2. Products
- 17.2.10.3. SWOT Analysis
- 17.2.10.4. Recent Developments
- 17.2.10.5. Financials (Based on Availability)
- 17.2.11 Nike Inc
- 17.2.11.1. Overview
- 17.2.11.2. Products
- 17.2.11.3. SWOT Analysis
- 17.2.11.4. Recent Developments
- 17.2.11.5. Financials (Based on Availability)
- 17.2.12 Under Armour
- 17.2.12.1. Overview
- 17.2.12.2. Products
- 17.2.12.3. SWOT Analysis
- 17.2.12.4. Recent Developments
- 17.2.12.5. Financials (Based on Availability)
- 17.2.1 Adidas AG
List of Figures
- Figure 1: Global Sport Electronics Industry Revenue Breakdown (Million, %) by Region 2024 & 2032
- Figure 2: North America Sport Electronics Industry Revenue (Million), by Country 2024 & 2032
- Figure 3: North America Sport Electronics Industry Revenue Share (%), by Country 2024 & 2032
- Figure 4: Europe Sport Electronics Industry Revenue (Million), by Country 2024 & 2032
- Figure 5: Europe Sport Electronics Industry Revenue Share (%), by Country 2024 & 2032
- Figure 6: Asia Pacific Sport Electronics Industry Revenue (Million), by Country 2024 & 2032
- Figure 7: Asia Pacific Sport Electronics Industry Revenue Share (%), by Country 2024 & 2032
- Figure 8: South America Sport Electronics Industry Revenue (Million), by Country 2024 & 2032
- Figure 9: South America Sport Electronics Industry Revenue Share (%), by Country 2024 & 2032
- Figure 10: North America Sport Electronics Industry Revenue (Million), by Country 2024 & 2032
- Figure 11: North America Sport Electronics Industry Revenue Share (%), by Country 2024 & 2032
- Figure 12: MEA Sport Electronics Industry Revenue (Million), by Country 2024 & 2032
- Figure 13: MEA Sport Electronics Industry Revenue Share (%), by Country 2024 & 2032
- Figure 14: North America Sport Electronics Industry Revenue (Million), by Product Type 2024 & 2032
- Figure 15: North America Sport Electronics Industry Revenue Share (%), by Product Type 2024 & 2032
- Figure 16: North America Sport Electronics Industry Revenue (Million), by Country 2024 & 2032
- Figure 17: North America Sport Electronics Industry Revenue Share (%), by Country 2024 & 2032
- Figure 18: Europe Sport Electronics Industry Revenue (Million), by Product Type 2024 & 2032
- Figure 19: Europe Sport Electronics Industry Revenue Share (%), by Product Type 2024 & 2032
- Figure 20: Europe Sport Electronics Industry Revenue (Million), by Country 2024 & 2032
- Figure 21: Europe Sport Electronics Industry Revenue Share (%), by Country 2024 & 2032
- Figure 22: Asia Pacific Sport Electronics Industry Revenue (Million), by Product Type 2024 & 2032
- Figure 23: Asia Pacific Sport Electronics Industry Revenue Share (%), by Product Type 2024 & 2032
- Figure 24: Asia Pacific Sport Electronics Industry Revenue (Million), by Country 2024 & 2032
- Figure 25: Asia Pacific Sport Electronics Industry Revenue Share (%), by Country 2024 & 2032
- Figure 26: Latin America Sport Electronics Industry Revenue (Million), by Product Type 2024 & 2032
- Figure 27: Latin America Sport Electronics Industry Revenue Share (%), by Product Type 2024 & 2032
- Figure 28: Latin America Sport Electronics Industry Revenue (Million), by Country 2024 & 2032
- Figure 29: Latin America Sport Electronics Industry Revenue Share (%), by Country 2024 & 2032
- Figure 30: Middle East Sport Electronics Industry Revenue (Million), by Product Type 2024 & 2032
- Figure 31: Middle East Sport Electronics Industry Revenue Share (%), by Product Type 2024 & 2032
- Figure 32: Middle East Sport Electronics Industry Revenue (Million), by Country 2024 & 2032
- Figure 33: Middle East Sport Electronics Industry Revenue Share (%), by Country 2024 & 2032
List of Tables
- Table 1: Global Sport Electronics Industry Revenue Million Forecast, by Region 2019 & 2032
- Table 2: Global Sport Electronics Industry Revenue Million Forecast, by Product Type 2019 & 2032
- Table 3: Global Sport Electronics Industry Revenue Million Forecast, by Region 2019 & 2032
- Table 4: Global Sport Electronics Industry Revenue Million Forecast, by Country 2019 & 2032
- Table 5: United States Sport Electronics Industry Revenue (Million) Forecast, by Application 2019 & 2032
- Table 6: Canada Sport Electronics Industry Revenue (Million) Forecast, by Application 2019 & 2032
- Table 7: Mexico Sport Electronics Industry Revenue (Million) Forecast, by Application 2019 & 2032
- Table 8: Global Sport Electronics Industry Revenue Million Forecast, by Country 2019 & 2032
- Table 9: Germany Sport Electronics Industry Revenue (Million) Forecast, by Application 2019 & 2032
- Table 10: United Kingdom Sport Electronics Industry Revenue (Million) Forecast, by Application 2019 & 2032
- Table 11: France Sport Electronics Industry Revenue (Million) Forecast, by Application 2019 & 2032
- Table 12: Spain Sport Electronics Industry Revenue (Million) Forecast, by Application 2019 & 2032
- Table 13: Italy Sport Electronics Industry Revenue (Million) Forecast, by Application 2019 & 2032
- Table 14: Spain Sport Electronics Industry Revenue (Million) Forecast, by Application 2019 & 2032
- Table 15: Belgium Sport Electronics Industry Revenue (Million) Forecast, by Application 2019 & 2032
- Table 16: Netherland Sport Electronics Industry Revenue (Million) Forecast, by Application 2019 & 2032
- Table 17: Nordics Sport Electronics Industry Revenue (Million) Forecast, by Application 2019 & 2032
- Table 18: Rest of Europe Sport Electronics Industry Revenue (Million) Forecast, by Application 2019 & 2032
- Table 19: Global Sport Electronics Industry Revenue Million Forecast, by Country 2019 & 2032
- Table 20: China Sport Electronics Industry Revenue (Million) Forecast, by Application 2019 & 2032
- Table 21: Japan Sport Electronics Industry Revenue (Million) Forecast, by Application 2019 & 2032
- Table 22: India Sport Electronics Industry Revenue (Million) Forecast, by Application 2019 & 2032
- Table 23: South Korea Sport Electronics Industry Revenue (Million) Forecast, by Application 2019 & 2032
- Table 24: Southeast Asia Sport Electronics Industry Revenue (Million) Forecast, by Application 2019 & 2032
- Table 25: Australia Sport Electronics Industry Revenue (Million) Forecast, by Application 2019 & 2032
- Table 26: Indonesia Sport Electronics Industry Revenue (Million) Forecast, by Application 2019 & 2032
- Table 27: Phillipes Sport Electronics Industry Revenue (Million) Forecast, by Application 2019 & 2032
- Table 28: Singapore Sport Electronics Industry Revenue (Million) Forecast, by Application 2019 & 2032
- Table 29: Thailandc Sport Electronics Industry Revenue (Million) Forecast, by Application 2019 & 2032
- Table 30: Rest of Asia Pacific Sport Electronics Industry Revenue (Million) Forecast, by Application 2019 & 2032
- Table 31: Global Sport Electronics Industry Revenue Million Forecast, by Country 2019 & 2032
- Table 32: Brazil Sport Electronics Industry Revenue (Million) Forecast, by Application 2019 & 2032
- Table 33: Argentina Sport Electronics Industry Revenue (Million) Forecast, by Application 2019 & 2032
- Table 34: Peru Sport Electronics Industry Revenue (Million) Forecast, by Application 2019 & 2032
- Table 35: Chile Sport Electronics Industry Revenue (Million) Forecast, by Application 2019 & 2032
- Table 36: Colombia Sport Electronics Industry Revenue (Million) Forecast, by Application 2019 & 2032
- Table 37: Ecuador Sport Electronics Industry Revenue (Million) Forecast, by Application 2019 & 2032
- Table 38: Venezuela Sport Electronics Industry Revenue (Million) Forecast, by Application 2019 & 2032
- Table 39: Rest of South America Sport Electronics Industry Revenue (Million) Forecast, by Application 2019 & 2032
- Table 40: Global Sport Electronics Industry Revenue Million Forecast, by Country 2019 & 2032
- Table 41: United States Sport Electronics Industry Revenue (Million) Forecast, by Application 2019 & 2032
- Table 42: Canada Sport Electronics Industry Revenue (Million) Forecast, by Application 2019 & 2032
- Table 43: Mexico Sport Electronics Industry Revenue (Million) Forecast, by Application 2019 & 2032
- Table 44: Global Sport Electronics Industry Revenue Million Forecast, by Country 2019 & 2032
- Table 45: United Arab Emirates Sport Electronics Industry Revenue (Million) Forecast, by Application 2019 & 2032
- Table 46: Saudi Arabia Sport Electronics Industry Revenue (Million) Forecast, by Application 2019 & 2032
- Table 47: South Africa Sport Electronics Industry Revenue (Million) Forecast, by Application 2019 & 2032
- Table 48: Rest of Middle East and Africa Sport Electronics Industry Revenue (Million) Forecast, by Application 2019 & 2032
- Table 49: Global Sport Electronics Industry Revenue Million Forecast, by Product Type 2019 & 2032
- Table 50: Global Sport Electronics Industry Revenue Million Forecast, by Country 2019 & 2032
- Table 51: Global Sport Electronics Industry Revenue Million Forecast, by Product Type 2019 & 2032
- Table 52: Global Sport Electronics Industry Revenue Million Forecast, by Country 2019 & 2032
- Table 53: Global Sport Electronics Industry Revenue Million Forecast, by Product Type 2019 & 2032
- Table 54: Global Sport Electronics Industry Revenue Million Forecast, by Country 2019 & 2032
- Table 55: Global Sport Electronics Industry Revenue Million Forecast, by Product Type 2019 & 2032
- Table 56: Global Sport Electronics Industry Revenue Million Forecast, by Country 2019 & 2032
- Table 57: Global Sport Electronics Industry Revenue Million Forecast, by Product Type 2019 & 2032
- Table 58: Global Sport Electronics Industry Revenue Million Forecast, by Country 2019 & 2032
Frequently Asked Questions
1. What is the projected Compound Annual Growth Rate (CAGR) of the Sport Electronics Industry?
The projected CAGR is approximately 20.00%.
2. Which companies are prominent players in the Sport Electronics Industry?
Key companies in the market include Adidas AG, Polar Electro Oy, Giant Manufacturing Co Ltd , Zepp US Inc, Garmin Ltd, StretchSense Ltd, SZ DJI Technology Co Ltd, Fitbit Inc, Catapult Sports Pty Ltd, Apple Inc, Nike Inc, Under Armour.
3. What are the main segments of the Sport Electronics Industry?
The market segments include Product Type.
4. Can you provide details about the market size?
The market size is estimated to be USD XX Million as of 2022.
5. What are some drivers contributing to market growth?
; Technological Advancements in Wearable Sports Devices; Rising Demand for Round-The-Clock Monitoring.
6. What are the notable trends driving market growth?
Smartwatch is Expected to Register a Significant Growth.
7. Are there any restraints impacting market growth?
; High Cost of Wearable Devices.
8. Can you provide examples of recent developments in the market?
N/A
9. What pricing options are available for accessing the report?
Pricing options include single-user, multi-user, and enterprise licenses priced at USD 4750, USD 5250, and USD 8750 respectively.
10. Is the market size provided in terms of value or volume?
The market size is provided in terms of value, measured in Million.
11. Are there any specific market keywords associated with the report?
Yes, the market keyword associated with the report is "Sport Electronics Industry," which aids in identifying and referencing the specific market segment covered.
12. How do I determine which pricing option suits my needs best?
The pricing options vary based on user requirements and access needs. Individual users may opt for single-user licenses, while businesses requiring broader access may choose multi-user or enterprise licenses for cost-effective access to the report.
13. Are there any additional resources or data provided in the Sport Electronics Industry report?
While the report offers comprehensive insights, it's advisable to review the specific contents or supplementary materials provided to ascertain if additional resources or data are available.
14. How can I stay updated on further developments or reports in the Sport Electronics Industry?
To stay informed about further developments, trends, and reports in the Sport Electronics Industry, consider subscribing to industry newsletters, following relevant companies and organizations, or regularly checking reputable industry news sources and publications.
Methodology
Step 1 - Identification of Relevant Samples Size from Population Database


Step 2 - Approaches for Defining Global Market Size (Value, Volume* & Price*)

Note*: In applicable scenarios
Step 3 - Data Sources
Primary Research
- Web Analytics
- Survey Reports
- Research Institute
- Latest Research Reports
- Opinion Leaders
Secondary Research
- Annual Reports
- White Paper
- Latest Press Release
- Industry Association
- Paid Database
- Investor Presentations

Step 4 - Data Triangulation
Involves using different sources of information in order to increase the validity of a study
These sources are likely to be stakeholders in a program - participants, other researchers, program staff, other community members, and so on.
Then we put all data in single framework & apply various statistical tools to find out the dynamic on the market.
During the analysis stage, feedback from the stakeholder groups would be compared to determine areas of agreement as well as areas of divergence


