
Key Insights
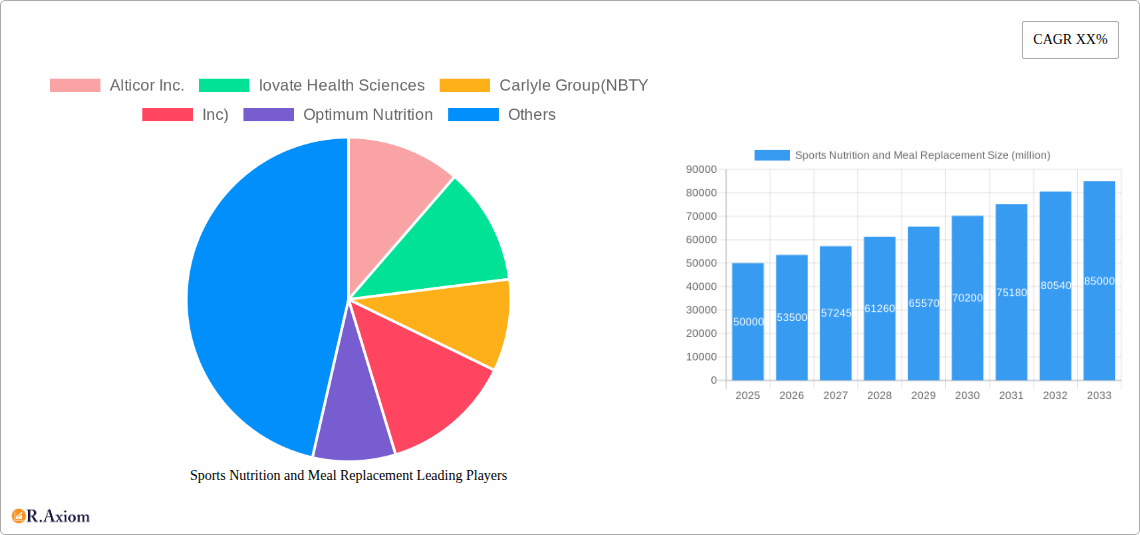
The global sports nutrition and meal replacement market is experiencing robust growth, driven by increasing health consciousness, rising disposable incomes, and a surge in fitness and athletic activities worldwide. The market, estimated at $50 billion in 2025, is projected to maintain a healthy Compound Annual Growth Rate (CAGR) of 7% from 2025 to 2033, reaching approximately $85 billion by 2033. Key drivers include the expanding popularity of functional foods and beverages, a growing preference for convenient and nutritious meal options, and the increasing awareness of the role of nutrition in athletic performance and overall well-being. The market is segmented into various product categories such as protein powders, energy bars, ready-to-drink shakes, and meal replacement products, each catering to specific consumer needs and preferences. Major players like Alticor Inc., Iovate Health Sciences, and Optimum Nutrition are leveraging innovation in product formulation and marketing strategies to gain market share. The rising trend of personalized nutrition and the increasing adoption of online channels for product sales are further shaping market dynamics.
Despite the positive outlook, the market faces certain restraints. Fluctuations in raw material prices, stringent regulatory requirements, and concerns regarding the long-term health effects of certain supplements pose challenges to market growth. However, the continuous innovation in product development, focusing on natural and organic ingredients, coupled with the growing demand for specialized products targeting specific athletic needs, is expected to mitigate these challenges. Furthermore, the increasing prevalence of chronic diseases and the rise in preventative healthcare are projected to further fuel the demand for functional foods and supplements, ultimately driving market expansion in the long run. Regional variations exist, with North America and Europe currently leading the market, but emerging economies in Asia-Pacific are showing significant growth potential.
Sports Nutrition and Meal Replacement Market Report: 2019-2033
This comprehensive report provides a detailed analysis of the global sports nutrition and meal replacement market, offering invaluable insights for industry stakeholders, investors, and market entrants. The report covers the period from 2019 to 2033, with a base year of 2025 and a forecast period of 2025-2033. The study analyzes market trends, competitive dynamics, and growth drivers, incorporating data from the historical period (2019-2024) and projecting future growth based on extensive market research. The global market size is expected to reach xx million by 2033, showcasing substantial growth potential. This report includes an in-depth analysis of leading players such as Alticor Inc., Iovate Health Sciences, Carlyle Group (NBTY, Inc.), Optimum Nutrition, Soylent, SMEAL LIMITED NZ, Abbott Laboratories, Ajinomoto, Glanbia, GlaxoSmithKline, MusclePharm, Nature's Bounty, Nestle, CSN, BellRing Brands, Cellucor, Herbalife, CytoSport, Mondelēz International, Inc., Quest Nutrition, NOW Foods, Amway (Nutrilite XS), MaxiNutrition (KRÜGER GROUP), BPI Sports, By-Health, Science in Sport, Competitor Sports, and Xiwang Foodstuffs.
Sports Nutrition and Meal Replacement Market Concentration & Innovation
The global sports nutrition and meal replacement market exhibits a moderately concentrated structure, with a handful of multinational corporations holding significant market share. However, the market also features a considerable number of smaller players, particularly in niche segments. Market share data reveals that the top 5 players collectively hold approximately xx% of the global market in 2025, while the remaining share is distributed among numerous regional and specialized companies.
Innovation Drivers: Key innovation drivers include:
- The development of novel protein sources and formulations.
- Advancements in functional ingredients and customized nutrition.
- Increased use of technology in product development and personalization.
- Growing demand for convenient and portable meal replacement options.
Regulatory Framework & Substitutes: Regulatory compliance significantly impacts the market, particularly concerning labeling, ingredient safety, and claims substantiation. Several product substitutes exist, including traditional food and dietary supplements, which present competitive challenges.
M&A Activities: The market has seen considerable M&A activity in recent years, with deals valued at over xx million dollars. These activities reflect the consolidation trends and strategic expansion strategies of large players.
- Example: The acquisition of xx company by xx company in 2024.
- Another example: xx company's expansion into new markets through xx.
Sports Nutrition and Meal Replacement Industry Trends & Insights
The sports nutrition and meal replacement market is experiencing robust growth, driven by several key trends:
- Rising health consciousness and the growing prevalence of fitness activities are boosting demand for functional foods and supplements.
- Technological advancements, including personalized nutrition and online ordering, are improving consumer experience.
- Shifting consumer preferences towards natural and organic products are driving the demand for clean-label products.
- The increasing prevalence of chronic diseases and the need for dietary management are expanding the market for therapeutic meal replacements.
The market is anticipated to register a CAGR of xx% during the forecast period (2025-2033). Market penetration is expected to increase significantly in developing economies with rising disposable income and changing lifestyles. The competitive landscape is highly dynamic, characterized by new product launches, strategic partnerships, and intense marketing efforts.
Dominant Markets & Segments in Sports Nutrition and Meal Replacement
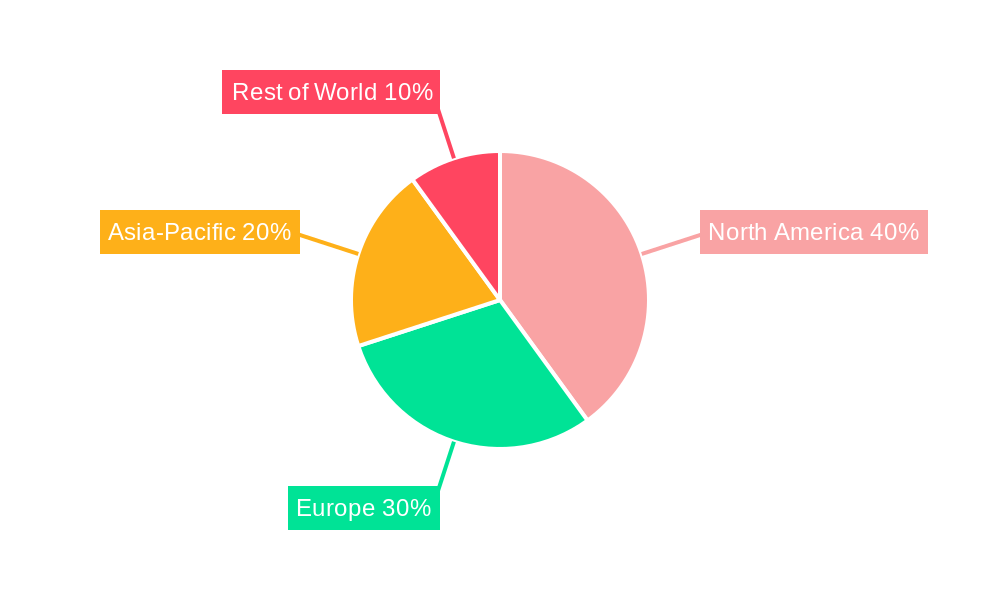
North America currently holds the largest market share in the sports nutrition and meal replacement sector. This dominance is attributed to several key factors:
- High disposable income: North America boasts a high level of disposable income, enabling consumers to invest in premium products.
- Developed fitness culture: A well-established fitness culture and increased awareness of health and wellness contribute to increased demand.
- Strong regulatory framework: The presence of strong regulatory framework ensures consumer safety and trust in the products.
- High market penetration: The market has witnessed high market penetration owing to successful marketing and awareness campaigns.
Other regions, including Europe and Asia-Pacific, are also exhibiting significant growth, driven by rising health consciousness and increasing urbanization. The ready-to-drink segment dominates the market, followed by powders and bars. Future growth will be influenced by innovation in product formats and flavors catering to diverse consumer preferences.
Sports Nutrition and Meal Replacement Product Developments
Recent product innovations focus on enhancing taste, convenience, and functionality. Technological advancements have led to the development of customized products and advanced delivery systems. Companies are increasingly incorporating natural ingredients and clean labels to cater to the rising demand for healthier alternatives. These innovations aim to provide superior performance benefits and address specific dietary needs, strengthening the competitive advantage of the brands.
Report Scope & Segmentation Analysis
This report provides a comprehensive segmentation analysis of the sports nutrition and meal replacement market, covering various aspects:
By Product Type: Powders, bars, ready-to-drink beverages, gels, and capsules. Each segment exhibits unique growth trajectories and competitive dynamics. The ready-to-drink segment is currently the largest, with projected continued strong growth.
By Distribution Channel: Online retailers, specialty stores, supermarkets, pharmacies, and direct sales. Each channel provides unique advantages and challenges for companies. Online sales are expected to show significant growth due to increased convenience and access.
By Consumer Group: Athletes, fitness enthusiasts, and general consumers. Different segments present unique product requirements and marketing approaches. The fitness enthusiast segment is expected to drive the majority of future growth.
Key Drivers of Sports Nutrition and Meal Replacement Growth
Several factors fuel the growth of the sports nutrition and meal replacement market:
- Rising health consciousness: Consumers are increasingly prioritizing health and wellness, leading to increased demand for functional foods.
- Growing fitness culture: The global fitness boom, particularly in emerging economies, creates a substantial market for performance-enhancing products.
- Technological advancements: Innovations in product formulations, personalized nutrition, and convenient formats accelerate market growth.
- Busy lifestyles: The growing preference for convenient and ready-to-consume options boosts the demand for meal replacements.
Challenges in the Sports Nutrition and Meal Replacement Sector
The sports nutrition and meal replacement sector faces several challenges:
- Stringent regulatory compliance: Meeting stringent regulations regarding labeling, ingredient safety, and health claims can be costly and time-consuming.
- Supply chain complexities: Sourcing high-quality ingredients and managing a robust supply chain can be challenging, especially for niche products.
- Intense competition: The market is highly competitive, with established players and numerous emerging brands vying for market share. This intensifies pricing pressures and necessitates continuous innovation.
Emerging Opportunities in Sports Nutrition and Meal Replacement
Several emerging trends offer significant opportunities:
- Personalized nutrition: Tailor-made products based on individual needs and genetic predispositions offer significant growth potential.
- Plant-based alternatives: The demand for plant-based protein sources and sustainable options presents an opportunity for innovation.
- Expansion into emerging markets: Untapped markets in developing countries present immense growth potential.
Leading Players in the Sports Nutrition and Meal Replacement Market
- Alticor Inc.
- Iovate Health Sciences
- Carlyle Group (NBTY, Inc.)
- Optimum Nutrition
- Soylent
- SMEAL LIMITED NZ
- Abbott Laboratories
- Ajinomoto
- Glanbia
- GlaxoSmithKline
- MusclePharm
- Nature's Bounty
- Nestle
- CSN
- BellRing Brands
- Cellucor
- Herbalife
- CytoSport
- Mondelēz International, Inc.
- Quest Nutrition
- NOW Foods
- Amway (Nutrilite XS)
- MaxiNutrition (KRÜGER GROUP)
- BPI Sports
- By-Health
- Science in Sport
- Competitor Sports
- Xiwang Foodstuffs
Key Developments in Sports Nutrition and Meal Replacement Industry
- January 2024: Company X launches a new line of plant-based protein bars.
- March 2024: Company Y acquires Company Z, expanding its product portfolio.
- June 2024: A new regulatory guideline is implemented, impacting product labeling requirements.
- September 2024: Company A announces a strategic partnership to expand its distribution network.
Strategic Outlook for Sports Nutrition and Meal Replacement Market
The sports nutrition and meal replacement market is poised for continued strong growth, fueled by favorable demographic trends, evolving consumer preferences, and ongoing technological advancements. The market will continue to consolidate, with larger players acquiring smaller companies to expand their market share and product portfolios. Strategic investments in research and development, innovative product development, and effective marketing strategies will be crucial for companies to thrive in this dynamic and competitive market. The focus on personalized nutrition, plant-based alternatives, and sustainable practices will play a key role in shaping the future of the industry.
Sports Nutrition and Meal Replacement Segmentation
-
1. Application
- 1.1. Self-Operated
- 1.2. Distribution
- 1.3. Direct Selling
-
2. Types
- 2.1. Replenish Energy
- 2.2. Control Energy
- 2.3. Protein Supplement
Sports Nutrition and Meal Replacement Segmentation By Geography
-
1. North America
- 1.1. United States
- 1.2. Canada
- 1.3. Mexico
-
2. South America
- 2.1. Brazil
- 2.2. Argentina
- 2.3. Rest of South America
-
3. Europe
- 3.1. United Kingdom
- 3.2. Germany
- 3.3. France
- 3.4. Italy
- 3.5. Spain
- 3.6. Russia
- 3.7. Benelux
- 3.8. Nordics
- 3.9. Rest of Europe
-
4. Middle East & Africa
- 4.1. Turkey
- 4.2. Israel
- 4.3. GCC
- 4.4. North Africa
- 4.5. South Africa
- 4.6. Rest of Middle East & Africa
-
5. Asia Pacific
- 5.1. China
- 5.2. India
- 5.3. Japan
- 5.4. South Korea
- 5.5. ASEAN
- 5.6. Oceania
- 5.7. Rest of Asia Pacific
Sports Nutrition and Meal Replacement REPORT HIGHLIGHTS
| Aspects | Details |
|---|---|
| Study Period | 2019-2033 |
| Base Year | 2024 |
| Estimated Year | 2025 |
| Forecast Period | 2025-2033 |
| Historical Period | 2019-2024 |
| Growth Rate | CAGR of XX% from 2019-2033 |
| Segmentation |
|
Table of Contents
- 1. Introduction
- 1.1. Research Scope
- 1.2. Market Segmentation
- 1.3. Research Methodology
- 1.4. Definitions and Assumptions
- 2. Executive Summary
- 2.1. Introduction
- 3. Market Dynamics
- 3.1. Introduction
- 3.2. Market Drivers
- 3.3. Market Restrains
- 3.4. Market Trends
- 4. Market Factor Analysis
- 4.1. Porters Five Forces
- 4.2. Supply/Value Chain
- 4.3. PESTEL analysis
- 4.4. Market Entropy
- 4.5. Patent/Trademark Analysis
- 5. Global Sports Nutrition and Meal Replacement Analysis, Insights and Forecast, 2019-2031
- 5.1. Market Analysis, Insights and Forecast - by Application
- 5.1.1. Self-Operated
- 5.1.2. Distribution
- 5.1.3. Direct Selling
- 5.2. Market Analysis, Insights and Forecast - by Types
- 5.2.1. Replenish Energy
- 5.2.2. Control Energy
- 5.2.3. Protein Supplement
- 5.3. Market Analysis, Insights and Forecast - by Region
- 5.3.1. North America
- 5.3.2. South America
- 5.3.3. Europe
- 5.3.4. Middle East & Africa
- 5.3.5. Asia Pacific
- 5.1. Market Analysis, Insights and Forecast - by Application
- 6. North America Sports Nutrition and Meal Replacement Analysis, Insights and Forecast, 2019-2031
- 6.1. Market Analysis, Insights and Forecast - by Application
- 6.1.1. Self-Operated
- 6.1.2. Distribution
- 6.1.3. Direct Selling
- 6.2. Market Analysis, Insights and Forecast - by Types
- 6.2.1. Replenish Energy
- 6.2.2. Control Energy
- 6.2.3. Protein Supplement
- 6.1. Market Analysis, Insights and Forecast - by Application
- 7. South America Sports Nutrition and Meal Replacement Analysis, Insights and Forecast, 2019-2031
- 7.1. Market Analysis, Insights and Forecast - by Application
- 7.1.1. Self-Operated
- 7.1.2. Distribution
- 7.1.3. Direct Selling
- 7.2. Market Analysis, Insights and Forecast - by Types
- 7.2.1. Replenish Energy
- 7.2.2. Control Energy
- 7.2.3. Protein Supplement
- 7.1. Market Analysis, Insights and Forecast - by Application
- 8. Europe Sports Nutrition and Meal Replacement Analysis, Insights and Forecast, 2019-2031
- 8.1. Market Analysis, Insights and Forecast - by Application
- 8.1.1. Self-Operated
- 8.1.2. Distribution
- 8.1.3. Direct Selling
- 8.2. Market Analysis, Insights and Forecast - by Types
- 8.2.1. Replenish Energy
- 8.2.2. Control Energy
- 8.2.3. Protein Supplement
- 8.1. Market Analysis, Insights and Forecast - by Application
- 9. Middle East & Africa Sports Nutrition and Meal Replacement Analysis, Insights and Forecast, 2019-2031
- 9.1. Market Analysis, Insights and Forecast - by Application
- 9.1.1. Self-Operated
- 9.1.2. Distribution
- 9.1.3. Direct Selling
- 9.2. Market Analysis, Insights and Forecast - by Types
- 9.2.1. Replenish Energy
- 9.2.2. Control Energy
- 9.2.3. Protein Supplement
- 9.1. Market Analysis, Insights and Forecast - by Application
- 10. Asia Pacific Sports Nutrition and Meal Replacement Analysis, Insights and Forecast, 2019-2031
- 10.1. Market Analysis, Insights and Forecast - by Application
- 10.1.1. Self-Operated
- 10.1.2. Distribution
- 10.1.3. Direct Selling
- 10.2. Market Analysis, Insights and Forecast - by Types
- 10.2.1. Replenish Energy
- 10.2.2. Control Energy
- 10.2.3. Protein Supplement
- 10.1. Market Analysis, Insights and Forecast - by Application
- 11. Competitive Analysis
- 11.1. Global Market Share Analysis 2024
- 11.2. Company Profiles
- 11.2.1 Alticor Inc.
- 11.2.1.1. Overview
- 11.2.1.2. Products
- 11.2.1.3. SWOT Analysis
- 11.2.1.4. Recent Developments
- 11.2.1.5. Financials (Based on Availability)
- 11.2.2 Iovate Health Sciences
- 11.2.2.1. Overview
- 11.2.2.2. Products
- 11.2.2.3. SWOT Analysis
- 11.2.2.4. Recent Developments
- 11.2.2.5. Financials (Based on Availability)
- 11.2.3 Carlyle Group(NBTY
- 11.2.3.1. Overview
- 11.2.3.2. Products
- 11.2.3.3. SWOT Analysis
- 11.2.3.4. Recent Developments
- 11.2.3.5. Financials (Based on Availability)
- 11.2.4 Inc)
- 11.2.4.1. Overview
- 11.2.4.2. Products
- 11.2.4.3. SWOT Analysis
- 11.2.4.4. Recent Developments
- 11.2.4.5. Financials (Based on Availability)
- 11.2.5 Optimum Nutrition
- 11.2.5.1. Overview
- 11.2.5.2. Products
- 11.2.5.3. SWOT Analysis
- 11.2.5.4. Recent Developments
- 11.2.5.5. Financials (Based on Availability)
- 11.2.6 Soylent
- 11.2.6.1. Overview
- 11.2.6.2. Products
- 11.2.6.3. SWOT Analysis
- 11.2.6.4. Recent Developments
- 11.2.6.5. Financials (Based on Availability)
- 11.2.7 SMEAL LIMITED NZ
- 11.2.7.1. Overview
- 11.2.7.2. Products
- 11.2.7.3. SWOT Analysis
- 11.2.7.4. Recent Developments
- 11.2.7.5. Financials (Based on Availability)
- 11.2.8 Abbott Laboratories
- 11.2.8.1. Overview
- 11.2.8.2. Products
- 11.2.8.3. SWOT Analysis
- 11.2.8.4. Recent Developments
- 11.2.8.5. Financials (Based on Availability)
- 11.2.9 Ajinomoto
- 11.2.9.1. Overview
- 11.2.9.2. Products
- 11.2.9.3. SWOT Analysis
- 11.2.9.4. Recent Developments
- 11.2.9.5. Financials (Based on Availability)
- 11.2.10 Glanbia
- 11.2.10.1. Overview
- 11.2.10.2. Products
- 11.2.10.3. SWOT Analysis
- 11.2.10.4. Recent Developments
- 11.2.10.5. Financials (Based on Availability)
- 11.2.11 GlaxoSmithKline
- 11.2.11.1. Overview
- 11.2.11.2. Products
- 11.2.11.3. SWOT Analysis
- 11.2.11.4. Recent Developments
- 11.2.11.5. Financials (Based on Availability)
- 11.2.12 MusclePharm
- 11.2.12.1. Overview
- 11.2.12.2. Products
- 11.2.12.3. SWOT Analysis
- 11.2.12.4. Recent Developments
- 11.2.12.5. Financials (Based on Availability)
- 11.2.13 Nature's Bounty
- 11.2.13.1. Overview
- 11.2.13.2. Products
- 11.2.13.3. SWOT Analysis
- 11.2.13.4. Recent Developments
- 11.2.13.5. Financials (Based on Availability)
- 11.2.14 Nestle
- 11.2.14.1. Overview
- 11.2.14.2. Products
- 11.2.14.3. SWOT Analysis
- 11.2.14.4. Recent Developments
- 11.2.14.5. Financials (Based on Availability)
- 11.2.15 CSN
- 11.2.15.1. Overview
- 11.2.15.2. Products
- 11.2.15.3. SWOT Analysis
- 11.2.15.4. Recent Developments
- 11.2.15.5. Financials (Based on Availability)
- 11.2.16 BellRing Brands
- 11.2.16.1. Overview
- 11.2.16.2. Products
- 11.2.16.3. SWOT Analysis
- 11.2.16.4. Recent Developments
- 11.2.16.5. Financials (Based on Availability)
- 11.2.17 Cellucor
- 11.2.17.1. Overview
- 11.2.17.2. Products
- 11.2.17.3. SWOT Analysis
- 11.2.17.4. Recent Developments
- 11.2.17.5. Financials (Based on Availability)
- 11.2.18 Herbalife
- 11.2.18.1. Overview
- 11.2.18.2. Products
- 11.2.18.3. SWOT Analysis
- 11.2.18.4. Recent Developments
- 11.2.18.5. Financials (Based on Availability)
- 11.2.19 CytoSport
- 11.2.19.1. Overview
- 11.2.19.2. Products
- 11.2.19.3. SWOT Analysis
- 11.2.19.4. Recent Developments
- 11.2.19.5. Financials (Based on Availability)
- 11.2.20 Mondelēz International
- 11.2.20.1. Overview
- 11.2.20.2. Products
- 11.2.20.3. SWOT Analysis
- 11.2.20.4. Recent Developments
- 11.2.20.5. Financials (Based on Availability)
- 11.2.21 Inc.
- 11.2.21.1. Overview
- 11.2.21.2. Products
- 11.2.21.3. SWOT Analysis
- 11.2.21.4. Recent Developments
- 11.2.21.5. Financials (Based on Availability)
- 11.2.22 Quest Nutrition
- 11.2.22.1. Overview
- 11.2.22.2. Products
- 11.2.22.3. SWOT Analysis
- 11.2.22.4. Recent Developments
- 11.2.22.5. Financials (Based on Availability)
- 11.2.23 NOW Foods
- 11.2.23.1. Overview
- 11.2.23.2. Products
- 11.2.23.3. SWOT Analysis
- 11.2.23.4. Recent Developments
- 11.2.23.5. Financials (Based on Availability)
- 11.2.24 Amway(Nutrilite XS )
- 11.2.24.1. Overview
- 11.2.24.2. Products
- 11.2.24.3. SWOT Analysis
- 11.2.24.4. Recent Developments
- 11.2.24.5. Financials (Based on Availability)
- 11.2.25 MaxiNutrition(KRÜGER GROUP)
- 11.2.25.1. Overview
- 11.2.25.2. Products
- 11.2.25.3. SWOT Analysis
- 11.2.25.4. Recent Developments
- 11.2.25.5. Financials (Based on Availability)
- 11.2.26 BPI Sports
- 11.2.26.1. Overview
- 11.2.26.2. Products
- 11.2.26.3. SWOT Analysis
- 11.2.26.4. Recent Developments
- 11.2.26.5. Financials (Based on Availability)
- 11.2.27 By-Health
- 11.2.27.1. Overview
- 11.2.27.2. Products
- 11.2.27.3. SWOT Analysis
- 11.2.27.4. Recent Developments
- 11.2.27.5. Financials (Based on Availability)
- 11.2.28 Science in Sports
- 11.2.28.1. Overview
- 11.2.28.2. Products
- 11.2.28.3. SWOT Analysis
- 11.2.28.4. Recent Developments
- 11.2.28.5. Financials (Based on Availability)
- 11.2.29 Competitor Sports
- 11.2.29.1. Overview
- 11.2.29.2. Products
- 11.2.29.3. SWOT Analysis
- 11.2.29.4. Recent Developments
- 11.2.29.5. Financials (Based on Availability)
- 11.2.30 Xiwang Foodstuffs
- 11.2.30.1. Overview
- 11.2.30.2. Products
- 11.2.30.3. SWOT Analysis
- 11.2.30.4. Recent Developments
- 11.2.30.5. Financials (Based on Availability)
- 11.2.1 Alticor Inc.
List of Figures
- Figure 1: Global Sports Nutrition and Meal Replacement Revenue Breakdown (million, %) by Region 2024 & 2032
- Figure 2: North America Sports Nutrition and Meal Replacement Revenue (million), by Application 2024 & 2032
- Figure 3: North America Sports Nutrition and Meal Replacement Revenue Share (%), by Application 2024 & 2032
- Figure 4: North America Sports Nutrition and Meal Replacement Revenue (million), by Types 2024 & 2032
- Figure 5: North America Sports Nutrition and Meal Replacement Revenue Share (%), by Types 2024 & 2032
- Figure 6: North America Sports Nutrition and Meal Replacement Revenue (million), by Country 2024 & 2032
- Figure 7: North America Sports Nutrition and Meal Replacement Revenue Share (%), by Country 2024 & 2032
- Figure 8: South America Sports Nutrition and Meal Replacement Revenue (million), by Application 2024 & 2032
- Figure 9: South America Sports Nutrition and Meal Replacement Revenue Share (%), by Application 2024 & 2032
- Figure 10: South America Sports Nutrition and Meal Replacement Revenue (million), by Types 2024 & 2032
- Figure 11: South America Sports Nutrition and Meal Replacement Revenue Share (%), by Types 2024 & 2032
- Figure 12: South America Sports Nutrition and Meal Replacement Revenue (million), by Country 2024 & 2032
- Figure 13: South America Sports Nutrition and Meal Replacement Revenue Share (%), by Country 2024 & 2032
- Figure 14: Europe Sports Nutrition and Meal Replacement Revenue (million), by Application 2024 & 2032
- Figure 15: Europe Sports Nutrition and Meal Replacement Revenue Share (%), by Application 2024 & 2032
- Figure 16: Europe Sports Nutrition and Meal Replacement Revenue (million), by Types 2024 & 2032
- Figure 17: Europe Sports Nutrition and Meal Replacement Revenue Share (%), by Types 2024 & 2032
- Figure 18: Europe Sports Nutrition and Meal Replacement Revenue (million), by Country 2024 & 2032
- Figure 19: Europe Sports Nutrition and Meal Replacement Revenue Share (%), by Country 2024 & 2032
- Figure 20: Middle East & Africa Sports Nutrition and Meal Replacement Revenue (million), by Application 2024 & 2032
- Figure 21: Middle East & Africa Sports Nutrition and Meal Replacement Revenue Share (%), by Application 2024 & 2032
- Figure 22: Middle East & Africa Sports Nutrition and Meal Replacement Revenue (million), by Types 2024 & 2032
- Figure 23: Middle East & Africa Sports Nutrition and Meal Replacement Revenue Share (%), by Types 2024 & 2032
- Figure 24: Middle East & Africa Sports Nutrition and Meal Replacement Revenue (million), by Country 2024 & 2032
- Figure 25: Middle East & Africa Sports Nutrition and Meal Replacement Revenue Share (%), by Country 2024 & 2032
- Figure 26: Asia Pacific Sports Nutrition and Meal Replacement Revenue (million), by Application 2024 & 2032
- Figure 27: Asia Pacific Sports Nutrition and Meal Replacement Revenue Share (%), by Application 2024 & 2032
- Figure 28: Asia Pacific Sports Nutrition and Meal Replacement Revenue (million), by Types 2024 & 2032
- Figure 29: Asia Pacific Sports Nutrition and Meal Replacement Revenue Share (%), by Types 2024 & 2032
- Figure 30: Asia Pacific Sports Nutrition and Meal Replacement Revenue (million), by Country 2024 & 2032
- Figure 31: Asia Pacific Sports Nutrition and Meal Replacement Revenue Share (%), by Country 2024 & 2032
List of Tables
- Table 1: Global Sports Nutrition and Meal Replacement Revenue million Forecast, by Region 2019 & 2032
- Table 2: Global Sports Nutrition and Meal Replacement Revenue million Forecast, by Application 2019 & 2032
- Table 3: Global Sports Nutrition and Meal Replacement Revenue million Forecast, by Types 2019 & 2032
- Table 4: Global Sports Nutrition and Meal Replacement Revenue million Forecast, by Region 2019 & 2032
- Table 5: Global Sports Nutrition and Meal Replacement Revenue million Forecast, by Application 2019 & 2032
- Table 6: Global Sports Nutrition and Meal Replacement Revenue million Forecast, by Types 2019 & 2032
- Table 7: Global Sports Nutrition and Meal Replacement Revenue million Forecast, by Country 2019 & 2032
- Table 8: United States Sports Nutrition and Meal Replacement Revenue (million) Forecast, by Application 2019 & 2032
- Table 9: Canada Sports Nutrition and Meal Replacement Revenue (million) Forecast, by Application 2019 & 2032
- Table 10: Mexico Sports Nutrition and Meal Replacement Revenue (million) Forecast, by Application 2019 & 2032
- Table 11: Global Sports Nutrition and Meal Replacement Revenue million Forecast, by Application 2019 & 2032
- Table 12: Global Sports Nutrition and Meal Replacement Revenue million Forecast, by Types 2019 & 2032
- Table 13: Global Sports Nutrition and Meal Replacement Revenue million Forecast, by Country 2019 & 2032
- Table 14: Brazil Sports Nutrition and Meal Replacement Revenue (million) Forecast, by Application 2019 & 2032
- Table 15: Argentina Sports Nutrition and Meal Replacement Revenue (million) Forecast, by Application 2019 & 2032
- Table 16: Rest of South America Sports Nutrition and Meal Replacement Revenue (million) Forecast, by Application 2019 & 2032
- Table 17: Global Sports Nutrition and Meal Replacement Revenue million Forecast, by Application 2019 & 2032
- Table 18: Global Sports Nutrition and Meal Replacement Revenue million Forecast, by Types 2019 & 2032
- Table 19: Global Sports Nutrition and Meal Replacement Revenue million Forecast, by Country 2019 & 2032
- Table 20: United Kingdom Sports Nutrition and Meal Replacement Revenue (million) Forecast, by Application 2019 & 2032
- Table 21: Germany Sports Nutrition and Meal Replacement Revenue (million) Forecast, by Application 2019 & 2032
- Table 22: France Sports Nutrition and Meal Replacement Revenue (million) Forecast, by Application 2019 & 2032
- Table 23: Italy Sports Nutrition and Meal Replacement Revenue (million) Forecast, by Application 2019 & 2032
- Table 24: Spain Sports Nutrition and Meal Replacement Revenue (million) Forecast, by Application 2019 & 2032
- Table 25: Russia Sports Nutrition and Meal Replacement Revenue (million) Forecast, by Application 2019 & 2032
- Table 26: Benelux Sports Nutrition and Meal Replacement Revenue (million) Forecast, by Application 2019 & 2032
- Table 27: Nordics Sports Nutrition and Meal Replacement Revenue (million) Forecast, by Application 2019 & 2032
- Table 28: Rest of Europe Sports Nutrition and Meal Replacement Revenue (million) Forecast, by Application 2019 & 2032
- Table 29: Global Sports Nutrition and Meal Replacement Revenue million Forecast, by Application 2019 & 2032
- Table 30: Global Sports Nutrition and Meal Replacement Revenue million Forecast, by Types 2019 & 2032
- Table 31: Global Sports Nutrition and Meal Replacement Revenue million Forecast, by Country 2019 & 2032
- Table 32: Turkey Sports Nutrition and Meal Replacement Revenue (million) Forecast, by Application 2019 & 2032
- Table 33: Israel Sports Nutrition and Meal Replacement Revenue (million) Forecast, by Application 2019 & 2032
- Table 34: GCC Sports Nutrition and Meal Replacement Revenue (million) Forecast, by Application 2019 & 2032
- Table 35: North Africa Sports Nutrition and Meal Replacement Revenue (million) Forecast, by Application 2019 & 2032
- Table 36: South Africa Sports Nutrition and Meal Replacement Revenue (million) Forecast, by Application 2019 & 2032
- Table 37: Rest of Middle East & Africa Sports Nutrition and Meal Replacement Revenue (million) Forecast, by Application 2019 & 2032
- Table 38: Global Sports Nutrition and Meal Replacement Revenue million Forecast, by Application 2019 & 2032
- Table 39: Global Sports Nutrition and Meal Replacement Revenue million Forecast, by Types 2019 & 2032
- Table 40: Global Sports Nutrition and Meal Replacement Revenue million Forecast, by Country 2019 & 2032
- Table 41: China Sports Nutrition and Meal Replacement Revenue (million) Forecast, by Application 2019 & 2032
- Table 42: India Sports Nutrition and Meal Replacement Revenue (million) Forecast, by Application 2019 & 2032
- Table 43: Japan Sports Nutrition and Meal Replacement Revenue (million) Forecast, by Application 2019 & 2032
- Table 44: South Korea Sports Nutrition and Meal Replacement Revenue (million) Forecast, by Application 2019 & 2032
- Table 45: ASEAN Sports Nutrition and Meal Replacement Revenue (million) Forecast, by Application 2019 & 2032
- Table 46: Oceania Sports Nutrition and Meal Replacement Revenue (million) Forecast, by Application 2019 & 2032
- Table 47: Rest of Asia Pacific Sports Nutrition and Meal Replacement Revenue (million) Forecast, by Application 2019 & 2032
Frequently Asked Questions
1. What is the projected Compound Annual Growth Rate (CAGR) of the Sports Nutrition and Meal Replacement?
The projected CAGR is approximately XX%.
2. Which companies are prominent players in the Sports Nutrition and Meal Replacement?
Key companies in the market include Alticor Inc., Iovate Health Sciences, Carlyle Group(NBTY, Inc), Optimum Nutrition, Soylent, SMEAL LIMITED NZ, Abbott Laboratories, Ajinomoto, Glanbia, GlaxoSmithKline, MusclePharm, Nature's Bounty, Nestle, CSN, BellRing Brands, Cellucor, Herbalife, CytoSport, Mondelēz International, Inc., Quest Nutrition, NOW Foods, Amway(Nutrilite XS ), MaxiNutrition(KRÜGER GROUP), BPI Sports, By-Health, Science in Sports, Competitor Sports, Xiwang Foodstuffs.
3. What are the main segments of the Sports Nutrition and Meal Replacement?
The market segments include Application, Types.
4. Can you provide details about the market size?
The market size is estimated to be USD XXX million as of 2022.
5. What are some drivers contributing to market growth?
N/A
6. What are the notable trends driving market growth?
N/A
7. Are there any restraints impacting market growth?
N/A
8. Can you provide examples of recent developments in the market?
N/A
9. What pricing options are available for accessing the report?
Pricing options include single-user, multi-user, and enterprise licenses priced at USD 4900.00, USD 7350.00, and USD 9800.00 respectively.
10. Is the market size provided in terms of value or volume?
The market size is provided in terms of value, measured in million.
11. Are there any specific market keywords associated with the report?
Yes, the market keyword associated with the report is "Sports Nutrition and Meal Replacement," which aids in identifying and referencing the specific market segment covered.
12. How do I determine which pricing option suits my needs best?
The pricing options vary based on user requirements and access needs. Individual users may opt for single-user licenses, while businesses requiring broader access may choose multi-user or enterprise licenses for cost-effective access to the report.
13. Are there any additional resources or data provided in the Sports Nutrition and Meal Replacement report?
While the report offers comprehensive insights, it's advisable to review the specific contents or supplementary materials provided to ascertain if additional resources or data are available.
14. How can I stay updated on further developments or reports in the Sports Nutrition and Meal Replacement?
To stay informed about further developments, trends, and reports in the Sports Nutrition and Meal Replacement, consider subscribing to industry newsletters, following relevant companies and organizations, or regularly checking reputable industry news sources and publications.
Methodology
Step 1 - Identification of Relevant Samples Size from Population Database


Step 2 - Approaches for Defining Global Market Size (Value, Volume* & Price*)

Note*: In applicable scenarios
Step 3 - Data Sources
Primary Research
- Web Analytics
- Survey Reports
- Research Institute
- Latest Research Reports
- Opinion Leaders
Secondary Research
- Annual Reports
- White Paper
- Latest Press Release
- Industry Association
- Paid Database
- Investor Presentations

Step 4 - Data Triangulation
Involves using different sources of information in order to increase the validity of a study
These sources are likely to be stakeholders in a program - participants, other researchers, program staff, other community members, and so on.
Then we put all data in single framework & apply various statistical tools to find out the dynamic on the market.
During the analysis stage, feedback from the stakeholder groups would be compared to determine areas of agreement as well as areas of divergence


