
Key Insights
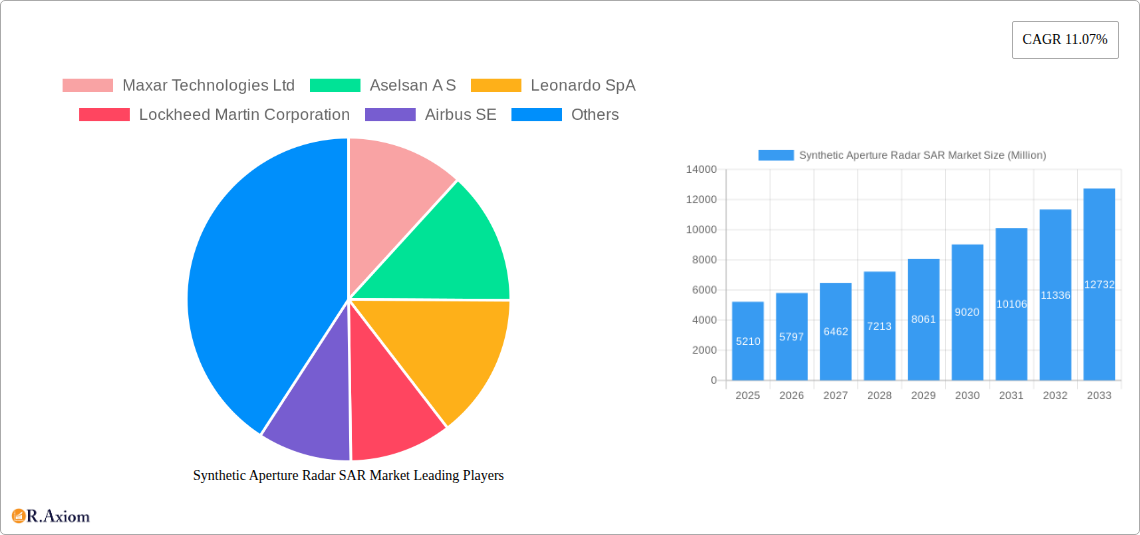
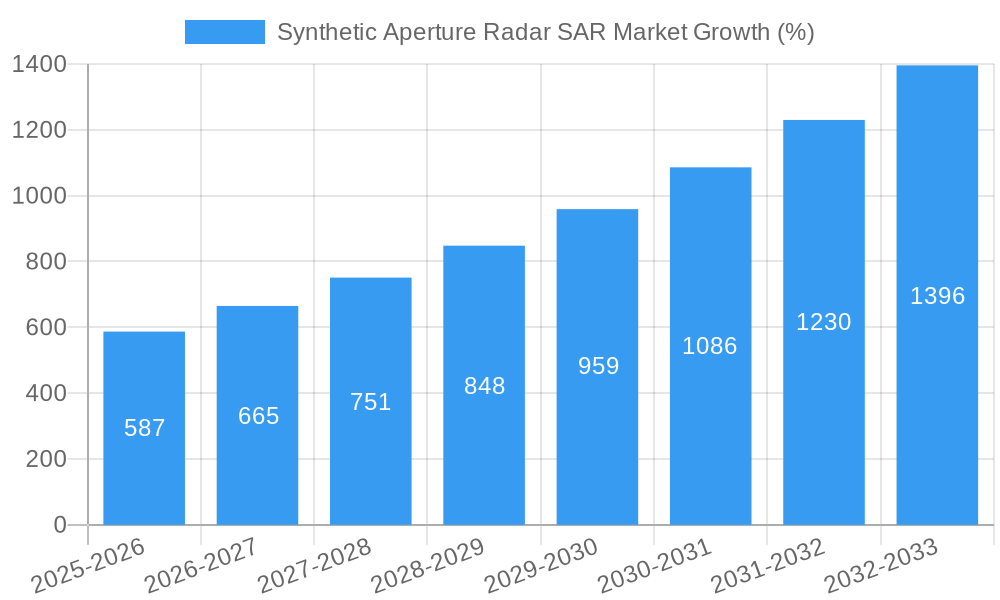
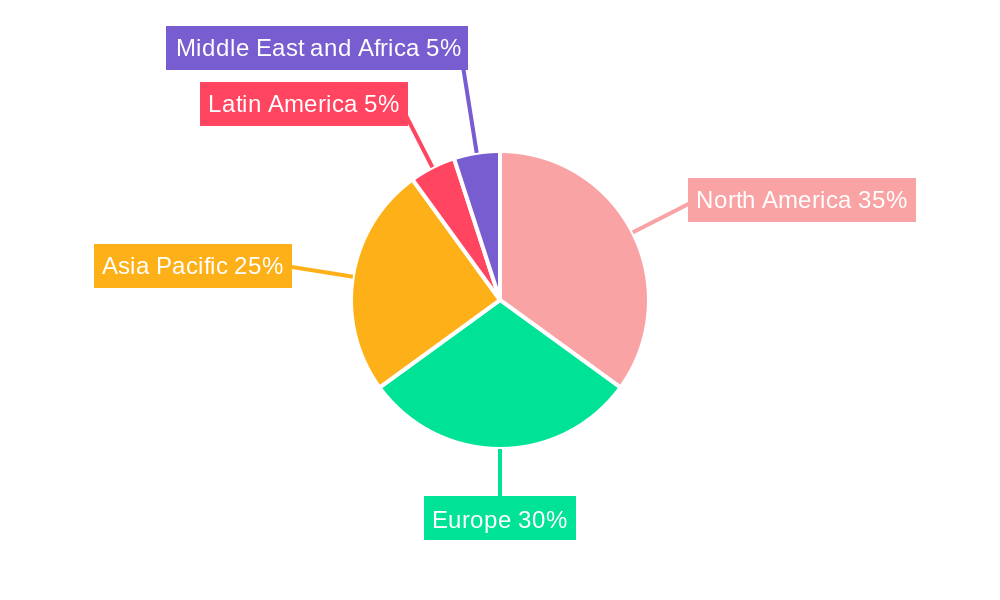
The Synthetic Aperture Radar (SAR) market is experiencing robust growth, projected to reach a value of $5.21 billion in 2025 and maintain a Compound Annual Growth Rate (CAGR) of 11.07% from 2025 to 2033. This expansion is driven by increasing demand across diverse sectors, particularly military and defense applications, where SAR's ability to provide high-resolution imagery regardless of weather conditions is crucial for surveillance, reconnaissance, and target acquisition. The rising adoption of SAR technology for monitoring and exploration, including environmental monitoring, natural resource management, and infrastructure inspection, further fuels market growth. Technological advancements leading to improved image quality, enhanced processing capabilities, and miniaturization of SAR systems are contributing factors. While data limitations prevent precise regional breakdowns, North America and Europe are likely to hold significant market shares due to the presence of major SAR technology developers and substantial defense budgets. The Asia-Pacific region, however, is poised for substantial growth due to increasing infrastructure development and investment in advanced technologies. The market faces some restraints, such as high initial investment costs associated with SAR systems and the need for specialized expertise in data processing and interpretation. However, the overall market outlook remains positive, driven by the continuous demand for high-resolution imagery and the expanding applications of SAR technology across various industries.
The competitive landscape is highly concentrated, with major players like Maxar Technologies, Lockheed Martin, Airbus, and Thales dominating the market. These companies are actively involved in research and development, striving to enhance SAR technology and expand their product portfolios. The presence of several smaller, specialized companies like IMSAR and SAR Aero indicates a growing ecosystem of innovation within the market. These smaller firms often focus on niche applications or specific technological advancements, creating a dynamic and competitive landscape. The future growth of the SAR market is heavily reliant on continued innovation in areas such as improved resolution, reduced costs, and wider accessibility of SAR data and analytics. Strategic partnerships, mergers, and acquisitions are likely to shape the competitive dynamics in the coming years, further driving market consolidation and technological advancements.
Synthetic Aperture Radar (SAR) Market: A Comprehensive Report (2019-2033)
This detailed report provides a comprehensive analysis of the Synthetic Aperture Radar (SAR) market, offering valuable insights for industry stakeholders, investors, and researchers. The study period spans from 2019 to 2033, with 2025 as the base and estimated year. The forecast period covers 2025-2033, while the historical period encompasses 2019-2024.
Synthetic Aperture Radar (SAR) Market Concentration & Innovation
This section analyzes the market concentration, innovation drivers, regulatory landscape, product substitutes, end-user trends, and merger & acquisition (M&A) activities within the SAR market. The market exhibits a moderately concentrated structure, with a handful of major players holding significant market share. For example, Maxar Technologies Ltd, Lockheed Martin Corporation, and Airbus SE collectively account for an estimated xx% of the global market in 2025. However, the emergence of smaller, innovative companies specializing in areas like microsatellite technology is increasing competition.
Innovation is driven by advancements in sensor technology, data processing capabilities, and the development of AI-powered analytics for SAR data. Stringent regulatory frameworks, particularly concerning data privacy and national security, significantly impact market dynamics. The availability of alternative technologies, such as LiDAR, creates competitive pressure. End-user trends, such as increasing demand for high-resolution imagery across various applications, are shaping market growth. M&A activity within the SAR market has been moderate, with deal values averaging approximately xx Million in recent years. Notable transactions include partnerships and collaborations to enhance product offerings and expand market reach. For instance, the partnership between ICEYE and the European Space Agency exemplifies the growing trend of collaborative initiatives within the sector.
Synthetic Aperture Radar (SAR) Market Industry Trends & Insights
The global Synthetic Aperture Radar (SAR) market is witnessing robust growth, with a projected Compound Annual Growth Rate (CAGR) of xx% during the forecast period (2025-2033). This growth is primarily fueled by escalating demand across diverse sectors, including defense and security, environmental monitoring, infrastructure management, and agriculture. The increasing availability of high-resolution SAR data, facilitated by advancements in satellite technology and data processing, significantly contributes to market expansion. Technological disruptions, such as the adoption of AI and machine learning for improved image analysis and automated data interpretation, are transforming the market landscape. Consumer preferences are increasingly shifting towards cost-effective and readily accessible SAR data solutions. Competitive dynamics are characterized by both intense rivalry among established players and the emergence of innovative startups, leading to a dynamic and rapidly evolving market environment. Market penetration rates are rising across key regions, driven by increasing awareness of SAR's capabilities and applications. The market size is expected to reach xx Million by 2033.
Dominant Markets & Segments in Synthetic Aperture Radar (SAR) Market
The Military and Defense segment currently dominates the Synthetic Aperture Radar (SAR) market, accounting for approximately xx% of the total market revenue in 2025. This dominance is driven by the crucial role SAR plays in various military applications, including reconnaissance, surveillance, target acquisition, and battlefield assessment.
- Key Drivers for Military and Defense:
- High government spending on defense modernization and technological advancements.
- Increasing demand for real-time intelligence gathering capabilities.
- Development of advanced SAR systems with improved resolution and capabilities.
The Monitoring and Exploration segment is also witnessing significant growth, driven by increasing demand for environmental monitoring, natural resource exploration, and disaster management applications.
- Key Drivers for Monitoring and Exploration:
- Growing concerns about climate change and its impacts.
- Need for effective disaster response and risk assessment tools.
- Expansion of infrastructure development projects.
Other Applications, including agriculture, urban planning, and transportation, are also contributing to the overall market growth, although at a slower pace than the two dominant segments.
Synthetic Aperture Radar (SAR) Market Product Developments
Significant advancements in SAR technology are driving product innovation. Miniaturization of SAR sensors, improved data processing algorithms, and the integration of AI are leading to more compact, efficient, and affordable systems. These advancements are expanding the application of SAR technology to new markets and improving the accuracy and resolution of acquired data. The development of high-frequency SAR systems is enhancing capabilities for smaller-scale applications like precision agriculture and urban infrastructure monitoring. The integration of SAR data with other sensor modalities, like optical imagery, is increasing the utility and value of the information.
Report Scope & Segmentation Analysis
The report segments the SAR market based on application:
Military and Defense: This segment is projected to experience significant growth, driven by increasing defense budgets and the need for advanced surveillance technologies. Market size is estimated at xx Million in 2025.
Monitoring and Exploration: This segment is experiencing rapid expansion due to the growing demand for environmental monitoring, disaster management, and resource exploration. The market size in 2025 is estimated at xx Million.
Other Applications: This segment includes applications in agriculture, urban planning, and transportation. Growth in this segment is expected to be moderate, driven by increasing adoption in specific niche areas. The market size in 2025 is estimated at xx Million. Competitive dynamics vary across these segments, reflecting different technological requirements and market needs.
Key Drivers of Synthetic Aperture Radar (SAR) Market Growth
Several key factors drive the growth of the SAR market. Technological advancements, including higher-resolution sensors and improved data processing algorithms, are crucial. Increased government funding for defense and environmental monitoring initiatives significantly boosts market demand. The rising adoption of SAR technology across diverse applications, from disaster response to infrastructure management, further fuels market expansion. The growing availability of cloud-based data storage and processing solutions enhances accessibility and affordability, driving wider adoption.
Challenges in the Synthetic Aperture Radar (SAR) Market Sector
The SAR market faces certain challenges. High initial investment costs for SAR systems can limit adoption, particularly among smaller organizations. The complexity of data processing and interpretation necessitates specialized expertise, potentially hindering wider adoption. Furthermore, data security and privacy concerns can create regulatory hurdles. Competition from alternative technologies, like LiDAR, also presents a challenge. These factors can collectively impact market growth and penetration rates.
Emerging Opportunities in Synthetic Aperture Radar (SAR) Market
Emerging opportunities in the SAR market include the integration of SAR data with other data sources (e.g., optical imagery, LiDAR) to create more comprehensive solutions. The development of miniaturized, low-cost SAR sensors is opening up new application areas. Increased demand for real-time SAR data for disaster response and emergency management presents significant growth opportunities. The increasing use of AI and machine learning for SAR data analysis and interpretation enhances efficiency and unlocks new applications.
Leading Players in the Synthetic Aperture Radar (SAR) Market Market
- Maxar Technologies Ltd
- Aselsan A S
- Leonardo SpA
- Lockheed Martin Corporation
- Airbus SE
- IMSAR LLC
- Raytheon Company
- SRC Inc
- MetaSensing Group
- Israel Aerospace Industries Ltd
- General Atomics Aeronautical Systems Inc
- SAR AERO
- BAE Systems Plc
- Cobham Plc (Advent)
- Northrop Grumman Corporation
- Saab AB
- Thales Group
- L3Harris Technologies
Key Developments in Synthetic Aperture Radar (SAR) Market Industry
May 2022: ICEYE partners with the European Space Agency to provide flood information to Copernicus Emergency Services. This collaboration highlights the increasing use of SAR for disaster response and the growing importance of public-private partnerships.
November 2022: Synspective and Geo Climate Risk Solutions Pvt. Ltd. partner to offer SAR-based analysis solutions for critical infrastructure and mining industries in India and South Asia. This partnership demonstrates the expanding applications of SAR technology in emerging markets.
Strategic Outlook for Synthetic Aperture Radar (SAR) Market Market
The future of the SAR market is promising, driven by continuous technological advancements, increasing demand across diverse sectors, and the emergence of new applications. The integration of AI and machine learning will further enhance data processing and analysis capabilities, making SAR technology more accessible and valuable. Government investments in space-based infrastructure and the growing focus on environmental monitoring and disaster management will continue to fuel market expansion. The development of miniaturized, low-cost SAR sensors will enable broader adoption across various industries and applications. The market presents significant growth potential for innovative companies and established players alike.
Synthetic Aperture Radar SAR Market Segmentation
-
1. Application
- 1.1. Military and Defense
- 1.2. Monitoring and Exploration
- 1.3. Other Applications
Synthetic Aperture Radar SAR Market Segmentation By Geography
- 1. North America
- 2. Europe
- 3. Asia Pacific
- 4. Latin America
- 5. Middle East and Africa
Synthetic Aperture Radar SAR Market REPORT HIGHLIGHTS
| Aspects | Details |
|---|---|
| Study Period | 2019-2033 |
| Base Year | 2024 |
| Estimated Year | 2025 |
| Forecast Period | 2025-2033 |
| Historical Period | 2019-2024 |
| Growth Rate | CAGR of 11.07% from 2019-2033 |
| Segmentation |
|
Table of Contents
- 1. Introduction
- 1.1. Research Scope
- 1.2. Market Segmentation
- 1.3. Research Methodology
- 1.4. Definitions and Assumptions
- 2. Executive Summary
- 2.1. Introduction
- 3. Market Dynamics
- 3.1. Introduction
- 3.2. Market Drivers
- 3.2.1 Increasing Demand for Enhanced Imaging Technology for Remote Sensing; Increasing Geopolitical Instabilities in the Middle East and Asia-Pacific Regions
- 3.2.2 Leading to Surveillance Demand; Growing Demand of Synthetic Aperture Radar in Military and Defense Sector
- 3.3. Market Restrains
- 3.3.1. Performance Limitations of Synthetic Aperture Radar Systems
- 3.4. Market Trends
- 3.4.1. Growing Demand of Synthetic Aperture Radar in Military and Defense Sector is Driving the Market
- 4. Market Factor Analysis
- 4.1. Porters Five Forces
- 4.2. Supply/Value Chain
- 4.3. PESTEL analysis
- 4.4. Market Entropy
- 4.5. Patent/Trademark Analysis
- 5. Global Synthetic Aperture Radar SAR Market Analysis, Insights and Forecast, 2019-2031
- 5.1. Market Analysis, Insights and Forecast - by Application
- 5.1.1. Military and Defense
- 5.1.2. Monitoring and Exploration
- 5.1.3. Other Applications
- 5.2. Market Analysis, Insights and Forecast - by Region
- 5.2.1. North America
- 5.2.2. Europe
- 5.2.3. Asia Pacific
- 5.2.4. Latin America
- 5.2.5. Middle East and Africa
- 5.1. Market Analysis, Insights and Forecast - by Application
- 6. North America Synthetic Aperture Radar SAR Market Analysis, Insights and Forecast, 2019-2031
- 6.1. Market Analysis, Insights and Forecast - by Application
- 6.1.1. Military and Defense
- 6.1.2. Monitoring and Exploration
- 6.1.3. Other Applications
- 6.1. Market Analysis, Insights and Forecast - by Application
- 7. Europe Synthetic Aperture Radar SAR Market Analysis, Insights and Forecast, 2019-2031
- 7.1. Market Analysis, Insights and Forecast - by Application
- 7.1.1. Military and Defense
- 7.1.2. Monitoring and Exploration
- 7.1.3. Other Applications
- 7.1. Market Analysis, Insights and Forecast - by Application
- 8. Asia Pacific Synthetic Aperture Radar SAR Market Analysis, Insights and Forecast, 2019-2031
- 8.1. Market Analysis, Insights and Forecast - by Application
- 8.1.1. Military and Defense
- 8.1.2. Monitoring and Exploration
- 8.1.3. Other Applications
- 8.1. Market Analysis, Insights and Forecast - by Application
- 9. Latin America Synthetic Aperture Radar SAR Market Analysis, Insights and Forecast, 2019-2031
- 9.1. Market Analysis, Insights and Forecast - by Application
- 9.1.1. Military and Defense
- 9.1.2. Monitoring and Exploration
- 9.1.3. Other Applications
- 9.1. Market Analysis, Insights and Forecast - by Application
- 10. Middle East and Africa Synthetic Aperture Radar SAR Market Analysis, Insights and Forecast, 2019-2031
- 10.1. Market Analysis, Insights and Forecast - by Application
- 10.1.1. Military and Defense
- 10.1.2. Monitoring and Exploration
- 10.1.3. Other Applications
- 10.1. Market Analysis, Insights and Forecast - by Application
- 11. North America Synthetic Aperture Radar SAR Market Analysis, Insights and Forecast, 2019-2031
- 11.1. Market Analysis, Insights and Forecast - By Country/Sub-region
- 11.1.1.
- 12. Europe Synthetic Aperture Radar SAR Market Analysis, Insights and Forecast, 2019-2031
- 12.1. Market Analysis, Insights and Forecast - By Country/Sub-region
- 12.1.1.
- 13. Asia Pacific Synthetic Aperture Radar SAR Market Analysis, Insights and Forecast, 2019-2031
- 13.1. Market Analysis, Insights and Forecast - By Country/Sub-region
- 13.1.1.
- 14. Latin America Synthetic Aperture Radar SAR Market Analysis, Insights and Forecast, 2019-2031
- 14.1. Market Analysis, Insights and Forecast - By Country/Sub-region
- 14.1.1.
- 15. Middle East and Africa Synthetic Aperture Radar SAR Market Analysis, Insights and Forecast, 2019-2031
- 15.1. Market Analysis, Insights and Forecast - By Country/Sub-region
- 15.1.1.
- 16. Competitive Analysis
- 16.1. Global Market Share Analysis 2024
- 16.2. Company Profiles
- 16.2.1 Maxar Technologies Ltd
- 16.2.1.1. Overview
- 16.2.1.2. Products
- 16.2.1.3. SWOT Analysis
- 16.2.1.4. Recent Developments
- 16.2.1.5. Financials (Based on Availability)
- 16.2.2 Aselsan A S
- 16.2.2.1. Overview
- 16.2.2.2. Products
- 16.2.2.3. SWOT Analysis
- 16.2.2.4. Recent Developments
- 16.2.2.5. Financials (Based on Availability)
- 16.2.3 Leonardo SpA
- 16.2.3.1. Overview
- 16.2.3.2. Products
- 16.2.3.3. SWOT Analysis
- 16.2.3.4. Recent Developments
- 16.2.3.5. Financials (Based on Availability)
- 16.2.4 Lockheed Martin Corporation
- 16.2.4.1. Overview
- 16.2.4.2. Products
- 16.2.4.3. SWOT Analysis
- 16.2.4.4. Recent Developments
- 16.2.4.5. Financials (Based on Availability)
- 16.2.5 Airbus SE
- 16.2.5.1. Overview
- 16.2.5.2. Products
- 16.2.5.3. SWOT Analysis
- 16.2.5.4. Recent Developments
- 16.2.5.5. Financials (Based on Availability)
- 16.2.6 IMSAR LLC
- 16.2.6.1. Overview
- 16.2.6.2. Products
- 16.2.6.3. SWOT Analysis
- 16.2.6.4. Recent Developments
- 16.2.6.5. Financials (Based on Availability)
- 16.2.7 Raytheon Company
- 16.2.7.1. Overview
- 16.2.7.2. Products
- 16.2.7.3. SWOT Analysis
- 16.2.7.4. Recent Developments
- 16.2.7.5. Financials (Based on Availability)
- 16.2.8 SRC Inc
- 16.2.8.1. Overview
- 16.2.8.2. Products
- 16.2.8.3. SWOT Analysis
- 16.2.8.4. Recent Developments
- 16.2.8.5. Financials (Based on Availability)
- 16.2.9 MetaSensing Group
- 16.2.9.1. Overview
- 16.2.9.2. Products
- 16.2.9.3. SWOT Analysis
- 16.2.9.4. Recent Developments
- 16.2.9.5. Financials (Based on Availability)
- 16.2.10 Israel Aerospace Industries Ltd
- 16.2.10.1. Overview
- 16.2.10.2. Products
- 16.2.10.3. SWOT Analysis
- 16.2.10.4. Recent Developments
- 16.2.10.5. Financials (Based on Availability)
- 16.2.11 General Atomics Aeronautical Systems Inc
- 16.2.11.1. Overview
- 16.2.11.2. Products
- 16.2.11.3. SWOT Analysis
- 16.2.11.4. Recent Developments
- 16.2.11.5. Financials (Based on Availability)
- 16.2.12 SAR AERO
- 16.2.12.1. Overview
- 16.2.12.2. Products
- 16.2.12.3. SWOT Analysis
- 16.2.12.4. Recent Developments
- 16.2.12.5. Financials (Based on Availability)
- 16.2.13 BAE Systems Plc
- 16.2.13.1. Overview
- 16.2.13.2. Products
- 16.2.13.3. SWOT Analysis
- 16.2.13.4. Recent Developments
- 16.2.13.5. Financials (Based on Availability)
- 16.2.14 Cobham Plc (Advent)
- 16.2.14.1. Overview
- 16.2.14.2. Products
- 16.2.14.3. SWOT Analysis
- 16.2.14.4. Recent Developments
- 16.2.14.5. Financials (Based on Availability)
- 16.2.15 Northrop Grumman Corporation
- 16.2.15.1. Overview
- 16.2.15.2. Products
- 16.2.15.3. SWOT Analysis
- 16.2.15.4. Recent Developments
- 16.2.15.5. Financials (Based on Availability)
- 16.2.16 Saab AB
- 16.2.16.1. Overview
- 16.2.16.2. Products
- 16.2.16.3. SWOT Analysis
- 16.2.16.4. Recent Developments
- 16.2.16.5. Financials (Based on Availability)
- 16.2.17 Thales Group*List Not Exhaustive
- 16.2.17.1. Overview
- 16.2.17.2. Products
- 16.2.17.3. SWOT Analysis
- 16.2.17.4. Recent Developments
- 16.2.17.5. Financials (Based on Availability)
- 16.2.18 L3Harris Technologies
- 16.2.18.1. Overview
- 16.2.18.2. Products
- 16.2.18.3. SWOT Analysis
- 16.2.18.4. Recent Developments
- 16.2.18.5. Financials (Based on Availability)
- 16.2.1 Maxar Technologies Ltd
List of Figures
- Figure 1: Global Synthetic Aperture Radar SAR Market Revenue Breakdown (Million, %) by Region 2024 & 2032
- Figure 2: North America Synthetic Aperture Radar SAR Market Revenue (Million), by Country 2024 & 2032
- Figure 3: North America Synthetic Aperture Radar SAR Market Revenue Share (%), by Country 2024 & 2032
- Figure 4: Europe Synthetic Aperture Radar SAR Market Revenue (Million), by Country 2024 & 2032
- Figure 5: Europe Synthetic Aperture Radar SAR Market Revenue Share (%), by Country 2024 & 2032
- Figure 6: Asia Pacific Synthetic Aperture Radar SAR Market Revenue (Million), by Country 2024 & 2032
- Figure 7: Asia Pacific Synthetic Aperture Radar SAR Market Revenue Share (%), by Country 2024 & 2032
- Figure 8: Latin America Synthetic Aperture Radar SAR Market Revenue (Million), by Country 2024 & 2032
- Figure 9: Latin America Synthetic Aperture Radar SAR Market Revenue Share (%), by Country 2024 & 2032
- Figure 10: Middle East and Africa Synthetic Aperture Radar SAR Market Revenue (Million), by Country 2024 & 2032
- Figure 11: Middle East and Africa Synthetic Aperture Radar SAR Market Revenue Share (%), by Country 2024 & 2032
- Figure 12: North America Synthetic Aperture Radar SAR Market Revenue (Million), by Application 2024 & 2032
- Figure 13: North America Synthetic Aperture Radar SAR Market Revenue Share (%), by Application 2024 & 2032
- Figure 14: North America Synthetic Aperture Radar SAR Market Revenue (Million), by Country 2024 & 2032
- Figure 15: North America Synthetic Aperture Radar SAR Market Revenue Share (%), by Country 2024 & 2032
- Figure 16: Europe Synthetic Aperture Radar SAR Market Revenue (Million), by Application 2024 & 2032
- Figure 17: Europe Synthetic Aperture Radar SAR Market Revenue Share (%), by Application 2024 & 2032
- Figure 18: Europe Synthetic Aperture Radar SAR Market Revenue (Million), by Country 2024 & 2032
- Figure 19: Europe Synthetic Aperture Radar SAR Market Revenue Share (%), by Country 2024 & 2032
- Figure 20: Asia Pacific Synthetic Aperture Radar SAR Market Revenue (Million), by Application 2024 & 2032
- Figure 21: Asia Pacific Synthetic Aperture Radar SAR Market Revenue Share (%), by Application 2024 & 2032
- Figure 22: Asia Pacific Synthetic Aperture Radar SAR Market Revenue (Million), by Country 2024 & 2032
- Figure 23: Asia Pacific Synthetic Aperture Radar SAR Market Revenue Share (%), by Country 2024 & 2032
- Figure 24: Latin America Synthetic Aperture Radar SAR Market Revenue (Million), by Application 2024 & 2032
- Figure 25: Latin America Synthetic Aperture Radar SAR Market Revenue Share (%), by Application 2024 & 2032
- Figure 26: Latin America Synthetic Aperture Radar SAR Market Revenue (Million), by Country 2024 & 2032
- Figure 27: Latin America Synthetic Aperture Radar SAR Market Revenue Share (%), by Country 2024 & 2032
- Figure 28: Middle East and Africa Synthetic Aperture Radar SAR Market Revenue (Million), by Application 2024 & 2032
- Figure 29: Middle East and Africa Synthetic Aperture Radar SAR Market Revenue Share (%), by Application 2024 & 2032
- Figure 30: Middle East and Africa Synthetic Aperture Radar SAR Market Revenue (Million), by Country 2024 & 2032
- Figure 31: Middle East and Africa Synthetic Aperture Radar SAR Market Revenue Share (%), by Country 2024 & 2032
List of Tables
- Table 1: Global Synthetic Aperture Radar SAR Market Revenue Million Forecast, by Region 2019 & 2032
- Table 2: Global Synthetic Aperture Radar SAR Market Revenue Million Forecast, by Application 2019 & 2032
- Table 3: Global Synthetic Aperture Radar SAR Market Revenue Million Forecast, by Region 2019 & 2032
- Table 4: Global Synthetic Aperture Radar SAR Market Revenue Million Forecast, by Country 2019 & 2032
- Table 5: Synthetic Aperture Radar SAR Market Revenue (Million) Forecast, by Application 2019 & 2032
- Table 6: Global Synthetic Aperture Radar SAR Market Revenue Million Forecast, by Country 2019 & 2032
- Table 7: Synthetic Aperture Radar SAR Market Revenue (Million) Forecast, by Application 2019 & 2032
- Table 8: Global Synthetic Aperture Radar SAR Market Revenue Million Forecast, by Country 2019 & 2032
- Table 9: Synthetic Aperture Radar SAR Market Revenue (Million) Forecast, by Application 2019 & 2032
- Table 10: Global Synthetic Aperture Radar SAR Market Revenue Million Forecast, by Country 2019 & 2032
- Table 11: Synthetic Aperture Radar SAR Market Revenue (Million) Forecast, by Application 2019 & 2032
- Table 12: Global Synthetic Aperture Radar SAR Market Revenue Million Forecast, by Country 2019 & 2032
- Table 13: Synthetic Aperture Radar SAR Market Revenue (Million) Forecast, by Application 2019 & 2032
- Table 14: Global Synthetic Aperture Radar SAR Market Revenue Million Forecast, by Application 2019 & 2032
- Table 15: Global Synthetic Aperture Radar SAR Market Revenue Million Forecast, by Country 2019 & 2032
- Table 16: Global Synthetic Aperture Radar SAR Market Revenue Million Forecast, by Application 2019 & 2032
- Table 17: Global Synthetic Aperture Radar SAR Market Revenue Million Forecast, by Country 2019 & 2032
- Table 18: Global Synthetic Aperture Radar SAR Market Revenue Million Forecast, by Application 2019 & 2032
- Table 19: Global Synthetic Aperture Radar SAR Market Revenue Million Forecast, by Country 2019 & 2032
- Table 20: Global Synthetic Aperture Radar SAR Market Revenue Million Forecast, by Application 2019 & 2032
- Table 21: Global Synthetic Aperture Radar SAR Market Revenue Million Forecast, by Country 2019 & 2032
- Table 22: Global Synthetic Aperture Radar SAR Market Revenue Million Forecast, by Application 2019 & 2032
- Table 23: Global Synthetic Aperture Radar SAR Market Revenue Million Forecast, by Country 2019 & 2032
Frequently Asked Questions
1. What is the projected Compound Annual Growth Rate (CAGR) of the Synthetic Aperture Radar SAR Market?
The projected CAGR is approximately 11.07%.
2. Which companies are prominent players in the Synthetic Aperture Radar SAR Market?
Key companies in the market include Maxar Technologies Ltd, Aselsan A S, Leonardo SpA, Lockheed Martin Corporation, Airbus SE, IMSAR LLC, Raytheon Company, SRC Inc, MetaSensing Group, Israel Aerospace Industries Ltd, General Atomics Aeronautical Systems Inc, SAR AERO, BAE Systems Plc, Cobham Plc (Advent), Northrop Grumman Corporation, Saab AB, Thales Group*List Not Exhaustive, L3Harris Technologies.
3. What are the main segments of the Synthetic Aperture Radar SAR Market?
The market segments include Application.
4. Can you provide details about the market size?
The market size is estimated to be USD 5.21 Million as of 2022.
5. What are some drivers contributing to market growth?
Increasing Demand for Enhanced Imaging Technology for Remote Sensing; Increasing Geopolitical Instabilities in the Middle East and Asia-Pacific Regions. Leading to Surveillance Demand; Growing Demand of Synthetic Aperture Radar in Military and Defense Sector.
6. What are the notable trends driving market growth?
Growing Demand of Synthetic Aperture Radar in Military and Defense Sector is Driving the Market.
7. Are there any restraints impacting market growth?
Performance Limitations of Synthetic Aperture Radar Systems.
8. Can you provide examples of recent developments in the market?
In May 2022- ICEYE, a microsatellite manufacturer, recently announced a partnership with the European Space Agency to provide flood information to Copernicus Emergency Services. Important flood impact data from ICEYE that demonstrates the depth and scope of the flood will be provided.
9. What pricing options are available for accessing the report?
Pricing options include single-user, multi-user, and enterprise licenses priced at USD 4750, USD 5250, and USD 8750 respectively.
10. Is the market size provided in terms of value or volume?
The market size is provided in terms of value, measured in Million.
11. Are there any specific market keywords associated with the report?
Yes, the market keyword associated with the report is "Synthetic Aperture Radar SAR Market," which aids in identifying and referencing the specific market segment covered.
12. How do I determine which pricing option suits my needs best?
The pricing options vary based on user requirements and access needs. Individual users may opt for single-user licenses, while businesses requiring broader access may choose multi-user or enterprise licenses for cost-effective access to the report.
13. Are there any additional resources or data provided in the Synthetic Aperture Radar SAR Market report?
While the report offers comprehensive insights, it's advisable to review the specific contents or supplementary materials provided to ascertain if additional resources or data are available.
14. How can I stay updated on further developments or reports in the Synthetic Aperture Radar SAR Market?
To stay informed about further developments, trends, and reports in the Synthetic Aperture Radar SAR Market, consider subscribing to industry newsletters, following relevant companies and organizations, or regularly checking reputable industry news sources and publications.
Methodology
Step 1 - Identification of Relevant Samples Size from Population Database


Step 2 - Approaches for Defining Global Market Size (Value, Volume* & Price*)

Note*: In applicable scenarios
Step 3 - Data Sources
Primary Research
- Web Analytics
- Survey Reports
- Research Institute
- Latest Research Reports
- Opinion Leaders
Secondary Research
- Annual Reports
- White Paper
- Latest Press Release
- Industry Association
- Paid Database
- Investor Presentations

Step 4 - Data Triangulation
Involves using different sources of information in order to increase the validity of a study
These sources are likely to be stakeholders in a program - participants, other researchers, program staff, other community members, and so on.
Then we put all data in single framework & apply various statistical tools to find out the dynamic on the market.
During the analysis stage, feedback from the stakeholder groups would be compared to determine areas of agreement as well as areas of divergence


