
Key Insights
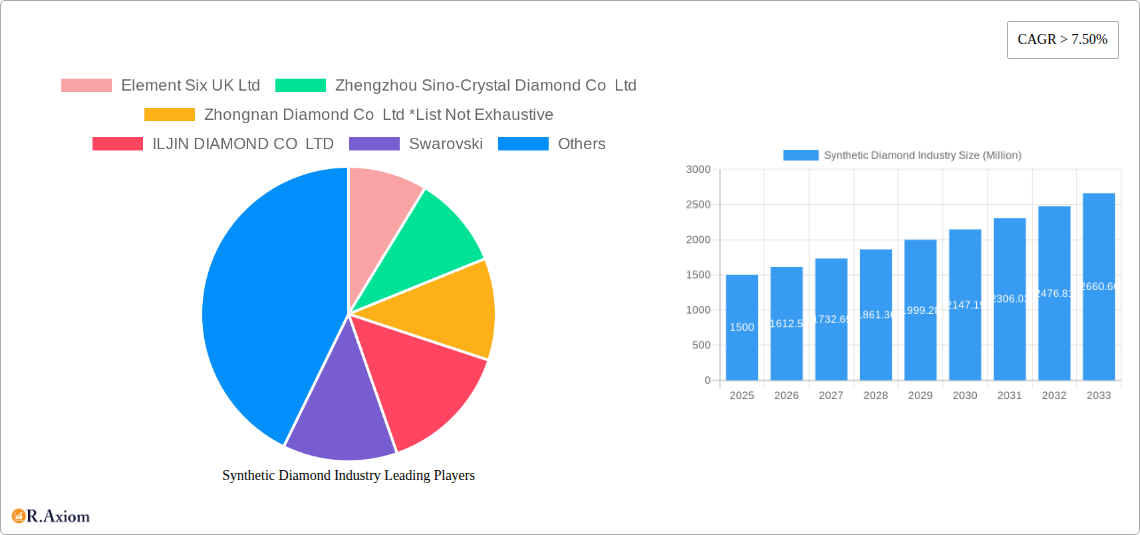
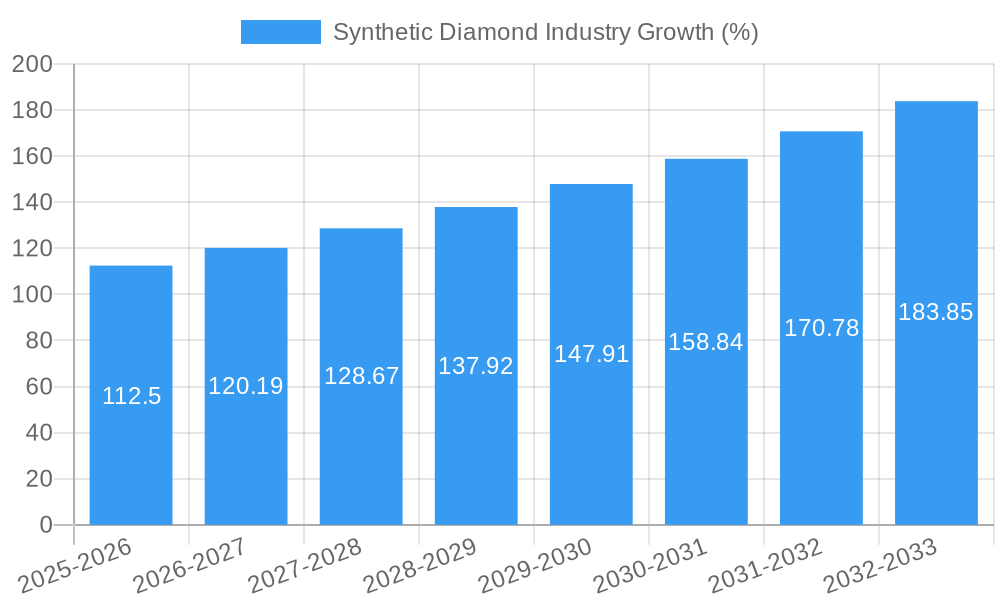
The synthetic diamond market is experiencing robust growth, projected to maintain a Compound Annual Growth Rate (CAGR) exceeding 7.5% from 2025 to 2033. This expansion is fueled by several key drivers. Increasing demand from the jewelry sector, driven by consumer preference for ethically sourced and sustainable alternatives to mined diamonds, is a significant factor. Furthermore, the industrial applications of synthetic diamonds are rapidly expanding. Their exceptional hardness, thermal conductivity, and optical properties make them crucial in diverse industries, including electronics (for heat sinks and polishing tools), manufacturing (for cutting and grinding tools), and oil and gas (for drilling bits). Technological advancements in High Pressure High Temperature (HPHT) and Chemical Vapor Deposition (CVD) manufacturing processes are leading to higher quality and larger-sized synthetic diamonds, further driving market growth. The market is segmented by type (polished and rough) and manufacturing process, with HPHT and CVD currently dominating the production landscape. While pricing pressures and competition among manufacturers may pose some challenges, the overall market outlook remains positive, driven by ongoing technological innovation and broadening application areas.
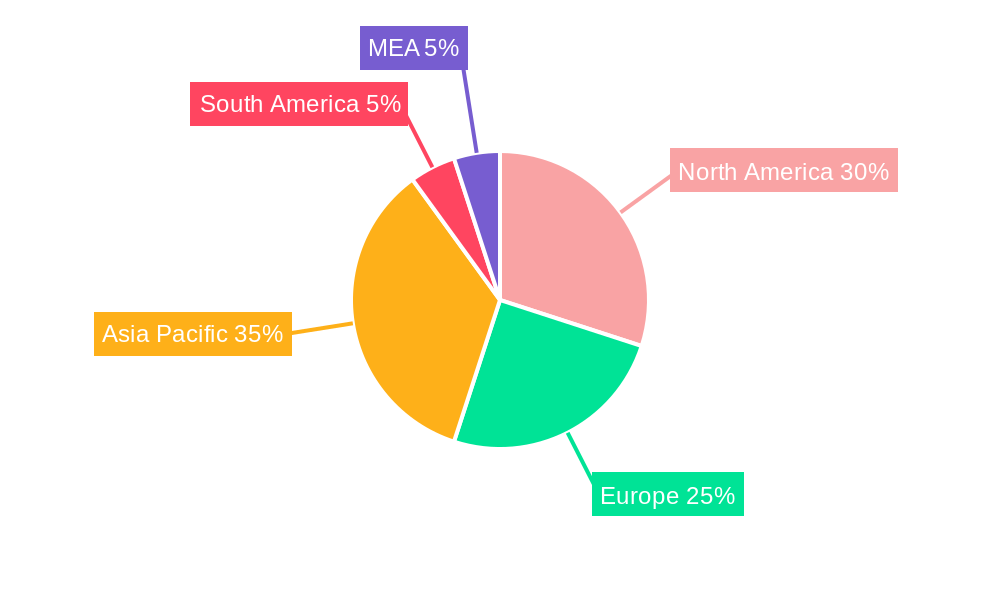
The geographical distribution of the synthetic diamond market is diverse, with North America, Europe, and Asia-Pacific representing the major regional markets. China, in particular, is a significant player due to its established manufacturing base and substantial domestic demand. However, other regions, including South America and the Middle East and Africa, are expected to witness substantial growth as awareness and adoption of synthetic diamonds increase. Key players in the market include established firms like Element Six, Swarovski, and Sumitomo Electric Industries, alongside emerging companies focusing on innovative manufacturing techniques and niche applications. The competitive landscape is dynamic, with ongoing innovation and consolidation expected to shape the market in the coming years. The market’s continued growth trajectory is supported by the increasing demand for environmentally friendly alternatives to mined diamonds, coupled with technological advancements leading to superior product quality and cost efficiency.
This in-depth report provides a comprehensive analysis of the synthetic diamond industry, encompassing market size, growth drivers, competitive landscape, and future outlook. Covering the period from 2019 to 2033, with a base year of 2025 and a forecast period of 2025-2033, this report is an invaluable resource for industry stakeholders, investors, and researchers seeking to understand this dynamic market. The report utilizes rigorous data analysis and industry expertise to provide actionable insights and strategic recommendations. Key players analyzed include Element Six UK Ltd, Zhengzhou Sino-Crystal Diamond Co Ltd, Zhongnan Diamond Co Ltd, ILJIN DIAMOND CO LTD, Swarovski, New Diamond Technology, Pure Grown Diamonds (PGD), Applied Diamond Inc, Henan Huanghe Whirlwind Co Ltd, Sumitomo Electric Industries Ltd, and Adamas One Corp. This list is not exhaustive. The total market value is predicted to reach xx Million by 2033.
Synthetic Diamond Industry Market Concentration & Innovation
This section analyzes the competitive landscape of the synthetic diamond industry, examining market concentration, innovation drivers, regulatory frameworks, product substitutes, end-user trends, and mergers and acquisitions (M&A) activities.
The synthetic diamond market exhibits a moderately concentrated structure, with a handful of major players holding significant market share. However, the presence of numerous smaller players indicates a dynamic and competitive environment. Precise market share figures for individual companies are confidential and proprietary to the full report but it is observed that Element Six UK Ltd and several Chinese companies hold significant positions. The estimated combined market share of the top 5 players is approximately 60% in 2025, with ongoing consolidation predicted to increase this figure to xx% by 2033.
- Innovation Drivers: Continuous advancements in HPHT and CVD manufacturing processes are driving innovation, leading to improved diamond quality, increased production efficiency, and reduced costs. Significant R&D investments are fostering innovation in new applications, especially within the electronics and industrial sectors.
- Regulatory Frameworks: Government regulations concerning environmental impact and labor practices are increasingly influencing the industry. Compliance with these regulations poses both challenges and opportunities for companies to adopt sustainable practices and gain a competitive edge.
- Product Substitutes: While natural diamonds remain a significant competitor, synthetic diamonds offer superior consistency, cost-effectiveness, and ethical sourcing, making them a strong substitute across numerous applications.
- End-User Trends: Growing demand for synthetic diamonds in electronics, industrial applications, and the jewelry sector is fueling market expansion. The increasing adoption of advanced technologies in these sectors further accelerates market growth.
- M&A Activities: The industry has witnessed several significant M&A deals in recent years, driven by companies' strategies to expand their market reach, enhance their technological capabilities, and secure access to raw materials and key intellectual properties. The total value of M&A deals during the historical period (2019-2024) is estimated at xx Million. Forecast values depend on ongoing market conditions.
Synthetic Diamond Industry Industry Trends & Insights
The synthetic diamond industry is experiencing robust growth, driven by several key factors. Technological advancements in both HPHT and CVD synthesis techniques have significantly reduced production costs and improved the quality and consistency of synthetic diamonds, leading to wider adoption across various applications. The market is characterized by a high CAGR (Compound Annual Growth Rate) of xx% during the forecast period (2025-2033).
Consumer preferences are shifting towards ethically sourced and sustainably produced goods, and synthetic diamonds align perfectly with these values. This shift in preference is particularly noticeable in the jewelry segment, where consumers are increasingly embracing lab-grown alternatives to mined diamonds. The market penetration of synthetic diamonds in jewelry is estimated at approximately xx% in 2025, projected to grow significantly to xx% by 2033. The growth is further fueled by strategic marketing and increased consumer awareness of the benefits of synthetic diamonds.
Competitive dynamics are intense, with established players and new entrants vying for market share. Companies are investing heavily in R&D to develop innovative products and expand their market reach. Strategic partnerships, acquisitions, and technological breakthroughs are shaping the competitive landscape, driving innovation and fostering market growth.
Dominant Markets & Segments in Synthetic Diamond Industry
The synthetic diamond market is witnessing substantial growth across various regions and segments. While specific regional data is confidential and is detailed in the full report, Asia holds a significant share of the global market, driven by strong demand from China and other rapidly developing economies. The specific percentage is confidential, but it accounts for the largest market share globally in 2025.
Key Drivers for Dominance in Asia:
- Robust economic growth and increasing disposable incomes
- Expanding jewelry and industrial sectors
- Government support for technological advancements
Segment Analysis:
- Polished Diamonds: The polished diamond segment holds the largest market share, driven by high demand from the jewelry and electronics industries. The manufacturing processes are improving, leading to higher quality and efficiency.
- Rough Diamonds: The rough diamond segment serves as the primary raw material for the polished diamond segment. Growth in this segment is directly linked to the demand for polished diamonds.
- HPHT: HPHT remains a prevalent manufacturing process, offering advantages in terms of scalability and cost-effectiveness for certain diamond applications.
- CVD: CVD offers superior control over diamond properties, making it ideal for high-value applications requiring specific characteristics like high purity or specific doping.
China's strong manufacturing base and rapidly expanding consumer market significantly contributes to its regional dominance. The strategic investments by the Chinese government in advanced material technologies is a key contributing factor.
Synthetic Diamond Industry Product Developments
Significant product innovations are transforming the synthetic diamond industry. Advances in HPHT and CVD technologies are enabling the production of larger, higher-quality diamonds with enhanced properties, opening up new applications in various sectors. Improvements in color control and clarity are enhancing the appeal of synthetic diamonds in the jewelry sector. Developments in doping techniques are tailoring diamond properties for specialized applications in electronics, optics, and industrial tools, creating a competitive advantage for manufacturers. Market fit is excellent across multiple sectors; especially in the high-growth electronics market.
Report Scope & Segmentation Analysis
This report segments the synthetic diamond market based on type (polished, rough), manufacturing process (HPHT, CVD), and region. Each segment is analyzed in detail, including growth projections, market size, and competitive dynamics. Detailed information is included in the full report.
Type: The polished segment is expected to maintain its dominance, with significant growth driven by increasing demand. The rough diamond segment is essential and closely linked to the polished segment's growth.
Manufacturing Process: Both HPHT and CVD processes are crucial, each catering to different market needs. Growth projections for each process are presented in the full report based on detailed analysis.
Regional Segmentation: The report segments the market by major regions, providing a detailed analysis of market size, growth drivers, and competitive dynamics in each region. Further detailed segmentation is included in the full report.
Key Drivers of Synthetic Diamond Industry Growth
The growth of the synthetic diamond industry is propelled by technological advancements, economic factors, and favorable regulatory environments. Advancements in HPHT and CVD processes have made synthetic diamonds more cost-effective and higher quality. Economic factors such as increasing disposable incomes in developing economies, especially in Asia, boost demand for synthetic diamonds, especially in the jewelry sector. Supportive government policies and initiatives promoting technological advancement further accelerate growth.
Challenges in the Synthetic Diamond Industry Sector
Despite the significant growth opportunities, challenges remain. These include: fluctuating raw material prices, stringent environmental regulations, intensifying competition amongst manufacturers, and ensuring supply chain stability. These factors could impact market growth by approximately xx% if not properly addressed.
Emerging Opportunities in Synthetic Diamond Industry
The synthetic diamond industry presents several emerging opportunities. New applications in electronics, quantum computing, and medical devices are opening up new market avenues. Technological advancements are continuously pushing the boundaries of material properties, unlocking even wider applications. Consumer preference for ethically sourced products remains a driving force, leading to increasing demand for synthetic diamonds.
Leading Players in the Synthetic Diamond Industry Market
- Element Six UK Ltd
- Zhengzhou Sino-Crystal Diamond Co Ltd
- Zhongnan Diamond Co Ltd
- ILJIN DIAMOND CO LTD
- Swarovski
- New Diamond Technology
- Pure Grown Diamonds (PGD)
- Applied Diamond Inc
- Henan Huanghe Whirlwind Co Ltd
- Sumitomo Electric Industries Ltd
- Adamas One Corp
Key Developments in Synthetic Diamond Industry Industry
- February 2022: Element Six UK Ltd collaborated with II-VI Inc. to produce high-quality single-crystal diamonds, expanding II-VI's diamond technology capabilities.
- July 2021: Element Six UK Ltd partnered with the University of Warwick to develop next-generation synthetic diamond technologies.
These collaborations highlight the strategic investments and partnerships driving innovation and market expansion within the synthetic diamond industry.
Strategic Outlook for Synthetic Diamond Industry Market
The future of the synthetic diamond industry is bright, fueled by ongoing technological advancements and expanding applications. The market is poised for sustained growth, driven by increasing demand across various sectors, including electronics, industrial tools, and jewelry. The strategic focus on sustainability and ethical sourcing will further enhance the market appeal. Continuous innovation in manufacturing processes will lead to even higher-quality and more cost-effective diamonds, expanding market reach and penetration.
Synthetic Diamond Industry Segmentation
-
1. Type
-
1.1. Polished
- 1.1.1. Jewelry
- 1.1.2. Electronics
- 1.1.3. Healthcare
- 1.1.4. Other Polished Types
-
1.2. Rough
- 1.2.1. Construction
- 1.2.2. Mining
- 1.2.3. Oil and Gas
- 1.2.4. Other Rough Types
-
1.1. Polished
-
2. Manufacturing Process
- 2.1. High Pressure, High Temperature (HPHT)
- 2.2. Chemical Vapor Deposition (CVD)
Synthetic Diamond Industry Segmentation By Geography
-
1. Asia Pacific
- 1.1. China
- 1.2. India
- 1.3. Japan
- 1.4. ASEAN Countries
- 1.5. Rest of Asia Pacific
-
2. North America
- 2.1. United States
- 2.2. Rest of North America
-
3. Europe
- 3.1. Germany
- 3.2. France
- 3.3. United Kingdom
- 3.4. Italy
- 3.5. Spain
- 3.6. Rest of Europe
-
4. South America
- 4.1. Brazil
- 4.2. Rest of South America
-
5. Middle East and Africa
- 5.1. GCC Countries
- 5.2. South Africa
- 5.3. Rest of Middle East and Africa
Synthetic Diamond Industry REPORT HIGHLIGHTS
| Aspects | Details |
|---|---|
| Study Period | 2019-2033 |
| Base Year | 2024 |
| Estimated Year | 2025 |
| Forecast Period | 2025-2033 |
| Historical Period | 2019-2024 |
| Growth Rate | CAGR of > 7.50% from 2019-2033 |
| Segmentation |
|
Table of Contents
- 1. Introduction
- 1.1. Research Scope
- 1.2. Market Segmentation
- 1.3. Research Methodology
- 1.4. Definitions and Assumptions
- 2. Executive Summary
- 2.1. Introduction
- 3. Market Dynamics
- 3.1. Introduction
- 3.2. Market Drivers
- 3.2.1. Increasing Demand from Electronics and Semiconductors Applications; Growing Demand for Super Abrasives
- 3.3. Market Restrains
- 3.3.1. Complex Manufacturing Process
- 3.4. Market Trends
- 3.4.1. Construction Segment to Dominate the Rough Type
- 4. Market Factor Analysis
- 4.1. Porters Five Forces
- 4.2. Supply/Value Chain
- 4.3. PESTEL analysis
- 4.4. Market Entropy
- 4.5. Patent/Trademark Analysis
- 5. Global Synthetic Diamond Industry Analysis, Insights and Forecast, 2019-2031
- 5.1. Market Analysis, Insights and Forecast - by Type
- 5.1.1. Polished
- 5.1.1.1. Jewelry
- 5.1.1.2. Electronics
- 5.1.1.3. Healthcare
- 5.1.1.4. Other Polished Types
- 5.1.2. Rough
- 5.1.2.1. Construction
- 5.1.2.2. Mining
- 5.1.2.3. Oil and Gas
- 5.1.2.4. Other Rough Types
- 5.1.1. Polished
- 5.2. Market Analysis, Insights and Forecast - by Manufacturing Process
- 5.2.1. High Pressure, High Temperature (HPHT)
- 5.2.2. Chemical Vapor Deposition (CVD)
- 5.3. Market Analysis, Insights and Forecast - by Region
- 5.3.1. Asia Pacific
- 5.3.2. North America
- 5.3.3. Europe
- 5.3.4. South America
- 5.3.5. Middle East and Africa
- 5.1. Market Analysis, Insights and Forecast - by Type
- 6. Asia Pacific Synthetic Diamond Industry Analysis, Insights and Forecast, 2019-2031
- 6.1. Market Analysis, Insights and Forecast - by Type
- 6.1.1. Polished
- 6.1.1.1. Jewelry
- 6.1.1.2. Electronics
- 6.1.1.3. Healthcare
- 6.1.1.4. Other Polished Types
- 6.1.2. Rough
- 6.1.2.1. Construction
- 6.1.2.2. Mining
- 6.1.2.3. Oil and Gas
- 6.1.2.4. Other Rough Types
- 6.1.1. Polished
- 6.2. Market Analysis, Insights and Forecast - by Manufacturing Process
- 6.2.1. High Pressure, High Temperature (HPHT)
- 6.2.2. Chemical Vapor Deposition (CVD)
- 6.1. Market Analysis, Insights and Forecast - by Type
- 7. North America Synthetic Diamond Industry Analysis, Insights and Forecast, 2019-2031
- 7.1. Market Analysis, Insights and Forecast - by Type
- 7.1.1. Polished
- 7.1.1.1. Jewelry
- 7.1.1.2. Electronics
- 7.1.1.3. Healthcare
- 7.1.1.4. Other Polished Types
- 7.1.2. Rough
- 7.1.2.1. Construction
- 7.1.2.2. Mining
- 7.1.2.3. Oil and Gas
- 7.1.2.4. Other Rough Types
- 7.1.1. Polished
- 7.2. Market Analysis, Insights and Forecast - by Manufacturing Process
- 7.2.1. High Pressure, High Temperature (HPHT)
- 7.2.2. Chemical Vapor Deposition (CVD)
- 7.1. Market Analysis, Insights and Forecast - by Type
- 8. Europe Synthetic Diamond Industry Analysis, Insights and Forecast, 2019-2031
- 8.1. Market Analysis, Insights and Forecast - by Type
- 8.1.1. Polished
- 8.1.1.1. Jewelry
- 8.1.1.2. Electronics
- 8.1.1.3. Healthcare
- 8.1.1.4. Other Polished Types
- 8.1.2. Rough
- 8.1.2.1. Construction
- 8.1.2.2. Mining
- 8.1.2.3. Oil and Gas
- 8.1.2.4. Other Rough Types
- 8.1.1. Polished
- 8.2. Market Analysis, Insights and Forecast - by Manufacturing Process
- 8.2.1. High Pressure, High Temperature (HPHT)
- 8.2.2. Chemical Vapor Deposition (CVD)
- 8.1. Market Analysis, Insights and Forecast - by Type
- 9. South America Synthetic Diamond Industry Analysis, Insights and Forecast, 2019-2031
- 9.1. Market Analysis, Insights and Forecast - by Type
- 9.1.1. Polished
- 9.1.1.1. Jewelry
- 9.1.1.2. Electronics
- 9.1.1.3. Healthcare
- 9.1.1.4. Other Polished Types
- 9.1.2. Rough
- 9.1.2.1. Construction
- 9.1.2.2. Mining
- 9.1.2.3. Oil and Gas
- 9.1.2.4. Other Rough Types
- 9.1.1. Polished
- 9.2. Market Analysis, Insights and Forecast - by Manufacturing Process
- 9.2.1. High Pressure, High Temperature (HPHT)
- 9.2.2. Chemical Vapor Deposition (CVD)
- 9.1. Market Analysis, Insights and Forecast - by Type
- 10. Middle East and Africa Synthetic Diamond Industry Analysis, Insights and Forecast, 2019-2031
- 10.1. Market Analysis, Insights and Forecast - by Type
- 10.1.1. Polished
- 10.1.1.1. Jewelry
- 10.1.1.2. Electronics
- 10.1.1.3. Healthcare
- 10.1.1.4. Other Polished Types
- 10.1.2. Rough
- 10.1.2.1. Construction
- 10.1.2.2. Mining
- 10.1.2.3. Oil and Gas
- 10.1.2.4. Other Rough Types
- 10.1.1. Polished
- 10.2. Market Analysis, Insights and Forecast - by Manufacturing Process
- 10.2.1. High Pressure, High Temperature (HPHT)
- 10.2.2. Chemical Vapor Deposition (CVD)
- 10.1. Market Analysis, Insights and Forecast - by Type
- 11. North America Synthetic Diamond Industry Analysis, Insights and Forecast, 2019-2031
- 11.1. Market Analysis, Insights and Forecast - By Country/Sub-region
- 11.1.1 United States
- 11.1.2 Canada
- 11.1.3 Mexico
- 12. Europe Synthetic Diamond Industry Analysis, Insights and Forecast, 2019-2031
- 12.1. Market Analysis, Insights and Forecast - By Country/Sub-region
- 12.1.1 Germany
- 12.1.2 United Kingdom
- 12.1.3 France
- 12.1.4 Spain
- 12.1.5 Italy
- 12.1.6 Spain
- 12.1.7 Belgium
- 12.1.8 Netherland
- 12.1.9 Nordics
- 12.1.10 Rest of Europe
- 13. Asia Pacific Synthetic Diamond Industry Analysis, Insights and Forecast, 2019-2031
- 13.1. Market Analysis, Insights and Forecast - By Country/Sub-region
- 13.1.1 China
- 13.1.2 Japan
- 13.1.3 India
- 13.1.4 South Korea
- 13.1.5 Southeast Asia
- 13.1.6 Australia
- 13.1.7 Indonesia
- 13.1.8 Phillipes
- 13.1.9 Singapore
- 13.1.10 Thailandc
- 13.1.11 Rest of Asia Pacific
- 14. South America Synthetic Diamond Industry Analysis, Insights and Forecast, 2019-2031
- 14.1. Market Analysis, Insights and Forecast - By Country/Sub-region
- 14.1.1 Brazil
- 14.1.2 Argentina
- 14.1.3 Peru
- 14.1.4 Chile
- 14.1.5 Colombia
- 14.1.6 Ecuador
- 14.1.7 Venezuela
- 14.1.8 Rest of South America
- 15. North America Synthetic Diamond Industry Analysis, Insights and Forecast, 2019-2031
- 15.1. Market Analysis, Insights and Forecast - By Country/Sub-region
- 15.1.1 United States
- 15.1.2 Canada
- 15.1.3 Mexico
- 16. MEA Synthetic Diamond Industry Analysis, Insights and Forecast, 2019-2031
- 16.1. Market Analysis, Insights and Forecast - By Country/Sub-region
- 16.1.1 United Arab Emirates
- 16.1.2 Saudi Arabia
- 16.1.3 South Africa
- 16.1.4 Rest of Middle East and Africa
- 17. Competitive Analysis
- 17.1. Global Market Share Analysis 2024
- 17.2. Company Profiles
- 17.2.1 Element Six UK Ltd
- 17.2.1.1. Overview
- 17.2.1.2. Products
- 17.2.1.3. SWOT Analysis
- 17.2.1.4. Recent Developments
- 17.2.1.5. Financials (Based on Availability)
- 17.2.2 Zhengzhou Sino-Crystal Diamond Co Ltd
- 17.2.2.1. Overview
- 17.2.2.2. Products
- 17.2.2.3. SWOT Analysis
- 17.2.2.4. Recent Developments
- 17.2.2.5. Financials (Based on Availability)
- 17.2.3 Zhongnan Diamond Co Ltd *List Not Exhaustive
- 17.2.3.1. Overview
- 17.2.3.2. Products
- 17.2.3.3. SWOT Analysis
- 17.2.3.4. Recent Developments
- 17.2.3.5. Financials (Based on Availability)
- 17.2.4 ILJIN DIAMOND CO LTD
- 17.2.4.1. Overview
- 17.2.4.2. Products
- 17.2.4.3. SWOT Analysis
- 17.2.4.4. Recent Developments
- 17.2.4.5. Financials (Based on Availability)
- 17.2.5 Swarovski
- 17.2.5.1. Overview
- 17.2.5.2. Products
- 17.2.5.3. SWOT Analysis
- 17.2.5.4. Recent Developments
- 17.2.5.5. Financials (Based on Availability)
- 17.2.6 New Diamond Technology
- 17.2.6.1. Overview
- 17.2.6.2. Products
- 17.2.6.3. SWOT Analysis
- 17.2.6.4. Recent Developments
- 17.2.6.5. Financials (Based on Availability)
- 17.2.7 Pure Grown Diamonds (PGD)
- 17.2.7.1. Overview
- 17.2.7.2. Products
- 17.2.7.3. SWOT Analysis
- 17.2.7.4. Recent Developments
- 17.2.7.5. Financials (Based on Availability)
- 17.2.8 Applied Diamond Inc
- 17.2.8.1. Overview
- 17.2.8.2. Products
- 17.2.8.3. SWOT Analysis
- 17.2.8.4. Recent Developments
- 17.2.8.5. Financials (Based on Availability)
- 17.2.9 Henan Huanghe Whirlwind Co Ltd
- 17.2.9.1. Overview
- 17.2.9.2. Products
- 17.2.9.3. SWOT Analysis
- 17.2.9.4. Recent Developments
- 17.2.9.5. Financials (Based on Availability)
- 17.2.10 Sumitomo Electric Industries Ltd
- 17.2.10.1. Overview
- 17.2.10.2. Products
- 17.2.10.3. SWOT Analysis
- 17.2.10.4. Recent Developments
- 17.2.10.5. Financials (Based on Availability)
- 17.2.11 Adamas One Corp
- 17.2.11.1. Overview
- 17.2.11.2. Products
- 17.2.11.3. SWOT Analysis
- 17.2.11.4. Recent Developments
- 17.2.11.5. Financials (Based on Availability)
- 17.2.1 Element Six UK Ltd
List of Figures
- Figure 1: Global Synthetic Diamond Industry Revenue Breakdown (Million, %) by Region 2024 & 2032
- Figure 2: North America Synthetic Diamond Industry Revenue (Million), by Country 2024 & 2032
- Figure 3: North America Synthetic Diamond Industry Revenue Share (%), by Country 2024 & 2032
- Figure 4: Europe Synthetic Diamond Industry Revenue (Million), by Country 2024 & 2032
- Figure 5: Europe Synthetic Diamond Industry Revenue Share (%), by Country 2024 & 2032
- Figure 6: Asia Pacific Synthetic Diamond Industry Revenue (Million), by Country 2024 & 2032
- Figure 7: Asia Pacific Synthetic Diamond Industry Revenue Share (%), by Country 2024 & 2032
- Figure 8: South America Synthetic Diamond Industry Revenue (Million), by Country 2024 & 2032
- Figure 9: South America Synthetic Diamond Industry Revenue Share (%), by Country 2024 & 2032
- Figure 10: North America Synthetic Diamond Industry Revenue (Million), by Country 2024 & 2032
- Figure 11: North America Synthetic Diamond Industry Revenue Share (%), by Country 2024 & 2032
- Figure 12: MEA Synthetic Diamond Industry Revenue (Million), by Country 2024 & 2032
- Figure 13: MEA Synthetic Diamond Industry Revenue Share (%), by Country 2024 & 2032
- Figure 14: Asia Pacific Synthetic Diamond Industry Revenue (Million), by Type 2024 & 2032
- Figure 15: Asia Pacific Synthetic Diamond Industry Revenue Share (%), by Type 2024 & 2032
- Figure 16: Asia Pacific Synthetic Diamond Industry Revenue (Million), by Manufacturing Process 2024 & 2032
- Figure 17: Asia Pacific Synthetic Diamond Industry Revenue Share (%), by Manufacturing Process 2024 & 2032
- Figure 18: Asia Pacific Synthetic Diamond Industry Revenue (Million), by Country 2024 & 2032
- Figure 19: Asia Pacific Synthetic Diamond Industry Revenue Share (%), by Country 2024 & 2032
- Figure 20: North America Synthetic Diamond Industry Revenue (Million), by Type 2024 & 2032
- Figure 21: North America Synthetic Diamond Industry Revenue Share (%), by Type 2024 & 2032
- Figure 22: North America Synthetic Diamond Industry Revenue (Million), by Manufacturing Process 2024 & 2032
- Figure 23: North America Synthetic Diamond Industry Revenue Share (%), by Manufacturing Process 2024 & 2032
- Figure 24: North America Synthetic Diamond Industry Revenue (Million), by Country 2024 & 2032
- Figure 25: North America Synthetic Diamond Industry Revenue Share (%), by Country 2024 & 2032
- Figure 26: Europe Synthetic Diamond Industry Revenue (Million), by Type 2024 & 2032
- Figure 27: Europe Synthetic Diamond Industry Revenue Share (%), by Type 2024 & 2032
- Figure 28: Europe Synthetic Diamond Industry Revenue (Million), by Manufacturing Process 2024 & 2032
- Figure 29: Europe Synthetic Diamond Industry Revenue Share (%), by Manufacturing Process 2024 & 2032
- Figure 30: Europe Synthetic Diamond Industry Revenue (Million), by Country 2024 & 2032
- Figure 31: Europe Synthetic Diamond Industry Revenue Share (%), by Country 2024 & 2032
- Figure 32: South America Synthetic Diamond Industry Revenue (Million), by Type 2024 & 2032
- Figure 33: South America Synthetic Diamond Industry Revenue Share (%), by Type 2024 & 2032
- Figure 34: South America Synthetic Diamond Industry Revenue (Million), by Manufacturing Process 2024 & 2032
- Figure 35: South America Synthetic Diamond Industry Revenue Share (%), by Manufacturing Process 2024 & 2032
- Figure 36: South America Synthetic Diamond Industry Revenue (Million), by Country 2024 & 2032
- Figure 37: South America Synthetic Diamond Industry Revenue Share (%), by Country 2024 & 2032
- Figure 38: Middle East and Africa Synthetic Diamond Industry Revenue (Million), by Type 2024 & 2032
- Figure 39: Middle East and Africa Synthetic Diamond Industry Revenue Share (%), by Type 2024 & 2032
- Figure 40: Middle East and Africa Synthetic Diamond Industry Revenue (Million), by Manufacturing Process 2024 & 2032
- Figure 41: Middle East and Africa Synthetic Diamond Industry Revenue Share (%), by Manufacturing Process 2024 & 2032
- Figure 42: Middle East and Africa Synthetic Diamond Industry Revenue (Million), by Country 2024 & 2032
- Figure 43: Middle East and Africa Synthetic Diamond Industry Revenue Share (%), by Country 2024 & 2032
List of Tables
- Table 1: Global Synthetic Diamond Industry Revenue Million Forecast, by Region 2019 & 2032
- Table 2: Global Synthetic Diamond Industry Revenue Million Forecast, by Type 2019 & 2032
- Table 3: Global Synthetic Diamond Industry Revenue Million Forecast, by Manufacturing Process 2019 & 2032
- Table 4: Global Synthetic Diamond Industry Revenue Million Forecast, by Region 2019 & 2032
- Table 5: Global Synthetic Diamond Industry Revenue Million Forecast, by Country 2019 & 2032
- Table 6: United States Synthetic Diamond Industry Revenue (Million) Forecast, by Application 2019 & 2032
- Table 7: Canada Synthetic Diamond Industry Revenue (Million) Forecast, by Application 2019 & 2032
- Table 8: Mexico Synthetic Diamond Industry Revenue (Million) Forecast, by Application 2019 & 2032
- Table 9: Global Synthetic Diamond Industry Revenue Million Forecast, by Country 2019 & 2032
- Table 10: Germany Synthetic Diamond Industry Revenue (Million) Forecast, by Application 2019 & 2032
- Table 11: United Kingdom Synthetic Diamond Industry Revenue (Million) Forecast, by Application 2019 & 2032
- Table 12: France Synthetic Diamond Industry Revenue (Million) Forecast, by Application 2019 & 2032
- Table 13: Spain Synthetic Diamond Industry Revenue (Million) Forecast, by Application 2019 & 2032
- Table 14: Italy Synthetic Diamond Industry Revenue (Million) Forecast, by Application 2019 & 2032
- Table 15: Spain Synthetic Diamond Industry Revenue (Million) Forecast, by Application 2019 & 2032
- Table 16: Belgium Synthetic Diamond Industry Revenue (Million) Forecast, by Application 2019 & 2032
- Table 17: Netherland Synthetic Diamond Industry Revenue (Million) Forecast, by Application 2019 & 2032
- Table 18: Nordics Synthetic Diamond Industry Revenue (Million) Forecast, by Application 2019 & 2032
- Table 19: Rest of Europe Synthetic Diamond Industry Revenue (Million) Forecast, by Application 2019 & 2032
- Table 20: Global Synthetic Diamond Industry Revenue Million Forecast, by Country 2019 & 2032
- Table 21: China Synthetic Diamond Industry Revenue (Million) Forecast, by Application 2019 & 2032
- Table 22: Japan Synthetic Diamond Industry Revenue (Million) Forecast, by Application 2019 & 2032
- Table 23: India Synthetic Diamond Industry Revenue (Million) Forecast, by Application 2019 & 2032
- Table 24: South Korea Synthetic Diamond Industry Revenue (Million) Forecast, by Application 2019 & 2032
- Table 25: Southeast Asia Synthetic Diamond Industry Revenue (Million) Forecast, by Application 2019 & 2032
- Table 26: Australia Synthetic Diamond Industry Revenue (Million) Forecast, by Application 2019 & 2032
- Table 27: Indonesia Synthetic Diamond Industry Revenue (Million) Forecast, by Application 2019 & 2032
- Table 28: Phillipes Synthetic Diamond Industry Revenue (Million) Forecast, by Application 2019 & 2032
- Table 29: Singapore Synthetic Diamond Industry Revenue (Million) Forecast, by Application 2019 & 2032
- Table 30: Thailandc Synthetic Diamond Industry Revenue (Million) Forecast, by Application 2019 & 2032
- Table 31: Rest of Asia Pacific Synthetic Diamond Industry Revenue (Million) Forecast, by Application 2019 & 2032
- Table 32: Global Synthetic Diamond Industry Revenue Million Forecast, by Country 2019 & 2032
- Table 33: Brazil Synthetic Diamond Industry Revenue (Million) Forecast, by Application 2019 & 2032
- Table 34: Argentina Synthetic Diamond Industry Revenue (Million) Forecast, by Application 2019 & 2032
- Table 35: Peru Synthetic Diamond Industry Revenue (Million) Forecast, by Application 2019 & 2032
- Table 36: Chile Synthetic Diamond Industry Revenue (Million) Forecast, by Application 2019 & 2032
- Table 37: Colombia Synthetic Diamond Industry Revenue (Million) Forecast, by Application 2019 & 2032
- Table 38: Ecuador Synthetic Diamond Industry Revenue (Million) Forecast, by Application 2019 & 2032
- Table 39: Venezuela Synthetic Diamond Industry Revenue (Million) Forecast, by Application 2019 & 2032
- Table 40: Rest of South America Synthetic Diamond Industry Revenue (Million) Forecast, by Application 2019 & 2032
- Table 41: Global Synthetic Diamond Industry Revenue Million Forecast, by Country 2019 & 2032
- Table 42: United States Synthetic Diamond Industry Revenue (Million) Forecast, by Application 2019 & 2032
- Table 43: Canada Synthetic Diamond Industry Revenue (Million) Forecast, by Application 2019 & 2032
- Table 44: Mexico Synthetic Diamond Industry Revenue (Million) Forecast, by Application 2019 & 2032
- Table 45: Global Synthetic Diamond Industry Revenue Million Forecast, by Country 2019 & 2032
- Table 46: United Arab Emirates Synthetic Diamond Industry Revenue (Million) Forecast, by Application 2019 & 2032
- Table 47: Saudi Arabia Synthetic Diamond Industry Revenue (Million) Forecast, by Application 2019 & 2032
- Table 48: South Africa Synthetic Diamond Industry Revenue (Million) Forecast, by Application 2019 & 2032
- Table 49: Rest of Middle East and Africa Synthetic Diamond Industry Revenue (Million) Forecast, by Application 2019 & 2032
- Table 50: Global Synthetic Diamond Industry Revenue Million Forecast, by Type 2019 & 2032
- Table 51: Global Synthetic Diamond Industry Revenue Million Forecast, by Manufacturing Process 2019 & 2032
- Table 52: Global Synthetic Diamond Industry Revenue Million Forecast, by Country 2019 & 2032
- Table 53: China Synthetic Diamond Industry Revenue (Million) Forecast, by Application 2019 & 2032
- Table 54: India Synthetic Diamond Industry Revenue (Million) Forecast, by Application 2019 & 2032
- Table 55: Japan Synthetic Diamond Industry Revenue (Million) Forecast, by Application 2019 & 2032
- Table 56: ASEAN Countries Synthetic Diamond Industry Revenue (Million) Forecast, by Application 2019 & 2032
- Table 57: Rest of Asia Pacific Synthetic Diamond Industry Revenue (Million) Forecast, by Application 2019 & 2032
- Table 58: Global Synthetic Diamond Industry Revenue Million Forecast, by Type 2019 & 2032
- Table 59: Global Synthetic Diamond Industry Revenue Million Forecast, by Manufacturing Process 2019 & 2032
- Table 60: Global Synthetic Diamond Industry Revenue Million Forecast, by Country 2019 & 2032
- Table 61: United States Synthetic Diamond Industry Revenue (Million) Forecast, by Application 2019 & 2032
- Table 62: Rest of North America Synthetic Diamond Industry Revenue (Million) Forecast, by Application 2019 & 2032
- Table 63: Global Synthetic Diamond Industry Revenue Million Forecast, by Type 2019 & 2032
- Table 64: Global Synthetic Diamond Industry Revenue Million Forecast, by Manufacturing Process 2019 & 2032
- Table 65: Global Synthetic Diamond Industry Revenue Million Forecast, by Country 2019 & 2032
- Table 66: Germany Synthetic Diamond Industry Revenue (Million) Forecast, by Application 2019 & 2032
- Table 67: France Synthetic Diamond Industry Revenue (Million) Forecast, by Application 2019 & 2032
- Table 68: United Kingdom Synthetic Diamond Industry Revenue (Million) Forecast, by Application 2019 & 2032
- Table 69: Italy Synthetic Diamond Industry Revenue (Million) Forecast, by Application 2019 & 2032
- Table 70: Spain Synthetic Diamond Industry Revenue (Million) Forecast, by Application 2019 & 2032
- Table 71: Rest of Europe Synthetic Diamond Industry Revenue (Million) Forecast, by Application 2019 & 2032
- Table 72: Global Synthetic Diamond Industry Revenue Million Forecast, by Type 2019 & 2032
- Table 73: Global Synthetic Diamond Industry Revenue Million Forecast, by Manufacturing Process 2019 & 2032
- Table 74: Global Synthetic Diamond Industry Revenue Million Forecast, by Country 2019 & 2032
- Table 75: Brazil Synthetic Diamond Industry Revenue (Million) Forecast, by Application 2019 & 2032
- Table 76: Rest of South America Synthetic Diamond Industry Revenue (Million) Forecast, by Application 2019 & 2032
- Table 77: Global Synthetic Diamond Industry Revenue Million Forecast, by Type 2019 & 2032
- Table 78: Global Synthetic Diamond Industry Revenue Million Forecast, by Manufacturing Process 2019 & 2032
- Table 79: Global Synthetic Diamond Industry Revenue Million Forecast, by Country 2019 & 2032
- Table 80: GCC Countries Synthetic Diamond Industry Revenue (Million) Forecast, by Application 2019 & 2032
- Table 81: South Africa Synthetic Diamond Industry Revenue (Million) Forecast, by Application 2019 & 2032
- Table 82: Rest of Middle East and Africa Synthetic Diamond Industry Revenue (Million) Forecast, by Application 2019 & 2032
Frequently Asked Questions
1. What is the projected Compound Annual Growth Rate (CAGR) of the Synthetic Diamond Industry?
The projected CAGR is approximately > 7.50%.
2. Which companies are prominent players in the Synthetic Diamond Industry?
Key companies in the market include Element Six UK Ltd, Zhengzhou Sino-Crystal Diamond Co Ltd, Zhongnan Diamond Co Ltd *List Not Exhaustive, ILJIN DIAMOND CO LTD, Swarovski, New Diamond Technology, Pure Grown Diamonds (PGD), Applied Diamond Inc, Henan Huanghe Whirlwind Co Ltd, Sumitomo Electric Industries Ltd, Adamas One Corp.
3. What are the main segments of the Synthetic Diamond Industry?
The market segments include Type, Manufacturing Process.
4. Can you provide details about the market size?
The market size is estimated to be USD XX Million as of 2022.
5. What are some drivers contributing to market growth?
Increasing Demand from Electronics and Semiconductors Applications; Growing Demand for Super Abrasives.
6. What are the notable trends driving market growth?
Construction Segment to Dominate the Rough Type.
7. Are there any restraints impacting market growth?
Complex Manufacturing Process.
8. Can you provide examples of recent developments in the market?
In February 2022, Element Six UK Ltd collaborated with II-VI Inc. Through this collaboration, II-VI licenses Element Six's intellectual property and necessary equipment would produce high-quality single-crystal diamonds to expand its core competency in diamond technology.
9. What pricing options are available for accessing the report?
Pricing options include single-user, multi-user, and enterprise licenses priced at USD 4750, USD 5250, and USD 8750 respectively.
10. Is the market size provided in terms of value or volume?
The market size is provided in terms of value, measured in Million.
11. Are there any specific market keywords associated with the report?
Yes, the market keyword associated with the report is "Synthetic Diamond Industry," which aids in identifying and referencing the specific market segment covered.
12. How do I determine which pricing option suits my needs best?
The pricing options vary based on user requirements and access needs. Individual users may opt for single-user licenses, while businesses requiring broader access may choose multi-user or enterprise licenses for cost-effective access to the report.
13. Are there any additional resources or data provided in the Synthetic Diamond Industry report?
While the report offers comprehensive insights, it's advisable to review the specific contents or supplementary materials provided to ascertain if additional resources or data are available.
14. How can I stay updated on further developments or reports in the Synthetic Diamond Industry?
To stay informed about further developments, trends, and reports in the Synthetic Diamond Industry, consider subscribing to industry newsletters, following relevant companies and organizations, or regularly checking reputable industry news sources and publications.
Methodology
Step 1 - Identification of Relevant Samples Size from Population Database


Step 2 - Approaches for Defining Global Market Size (Value, Volume* & Price*)

Note*: In applicable scenarios
Step 3 - Data Sources
Primary Research
- Web Analytics
- Survey Reports
- Research Institute
- Latest Research Reports
- Opinion Leaders
Secondary Research
- Annual Reports
- White Paper
- Latest Press Release
- Industry Association
- Paid Database
- Investor Presentations

Step 4 - Data Triangulation
Involves using different sources of information in order to increase the validity of a study
These sources are likely to be stakeholders in a program - participants, other researchers, program staff, other community members, and so on.
Then we put all data in single framework & apply various statistical tools to find out the dynamic on the market.
During the analysis stage, feedback from the stakeholder groups would be compared to determine areas of agreement as well as areas of divergence


