
Key Insights
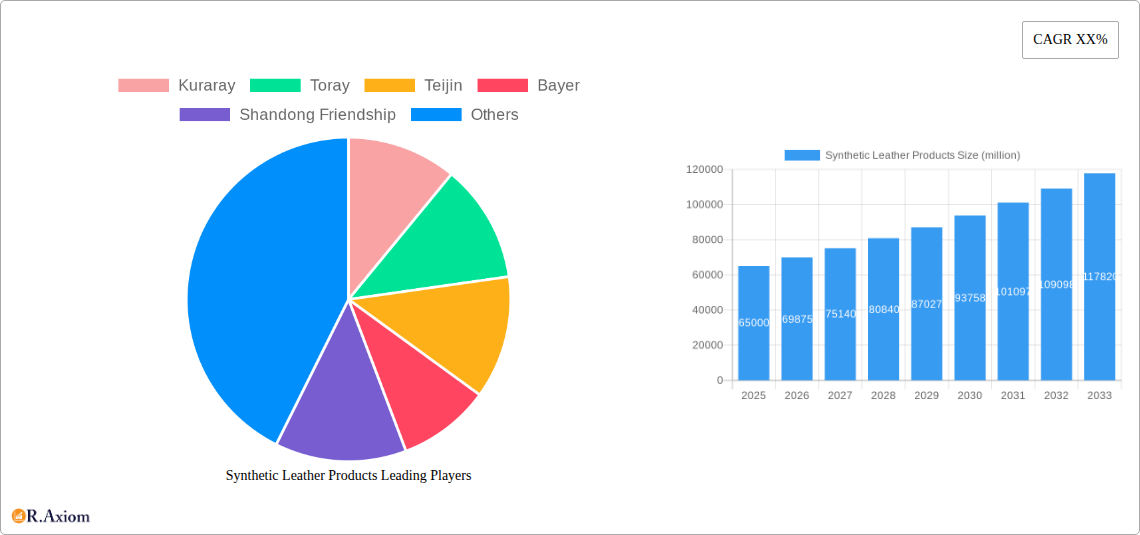
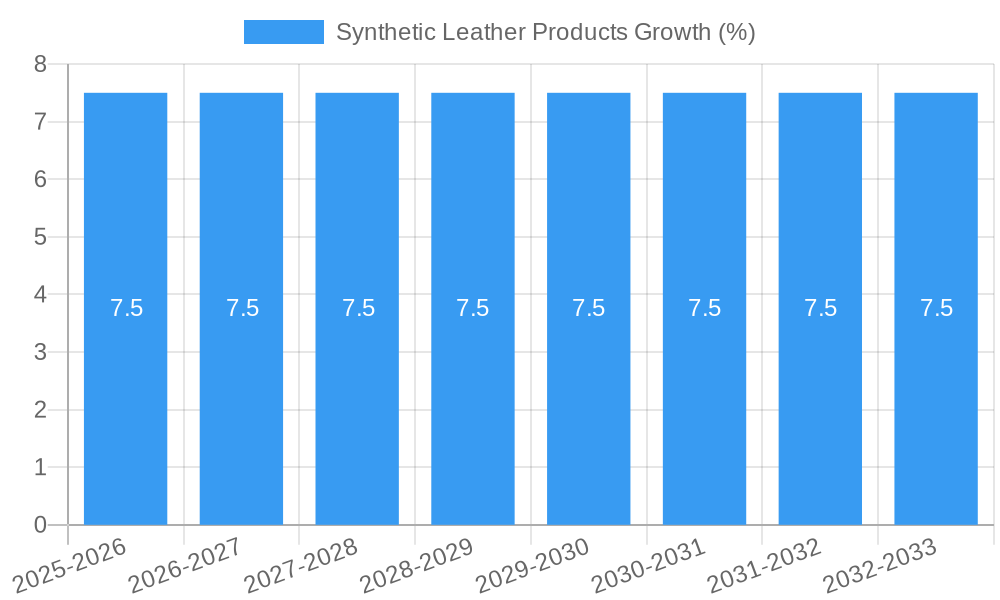
The global synthetic leather products market is poised for substantial growth, projected to reach an estimated market size of approximately $65 billion in 2025. This expansion is driven by a confluence of factors including increasing demand from the automotive sector for lightweight and durable interiors, a burgeoning fashion industry seeking sustainable and cost-effective alternatives to genuine leather, and the growing popularity of athleisure wear, which relies heavily on synthetic materials for sport shoes and apparel. The market is expected to witness a Compound Annual Growth Rate (CAGR) of around 7.5% from 2025 to 2033. Key growth drivers include the rising disposable incomes in emerging economies, a greater consumer awareness of animal welfare, and continuous technological advancements in synthetic leather production that enhance its aesthetic appeal, performance, and environmental sustainability.
The synthetic leather market is segmented into various applications, with sport shoes and bags representing significant segments due to their widespread consumer appeal. Furniture and car interiors also contribute substantially to market demand, driven by design trends and the need for durable, easy-to-maintain materials. In terms of types, Polyvinyl Chloride (PVC), Normal Polyurethane (PU), Microfiber PU, and Ecological Function PU are prominent. The increasing focus on sustainability is fueling the demand for Ecological Function PU, which offers eco-friendly properties and reduces environmental impact. Restraints include potential fluctuations in raw material prices and intense competition among manufacturers. However, the overall outlook remains robust, with companies like Kuraray, Toray, and Bayer leading the innovation and market penetration efforts across key regions such as Asia Pacific, North America, and Europe.
Synthetic Leather Products Market Concentration & Innovation
The global synthetic leather market exhibits a moderate to high concentration, with a significant presence of both established global players and rapidly expanding regional manufacturers, particularly in Asia. Key companies like Kuraray, Toray, Teijin, and Bayer hold substantial market shares due to their advanced technological capabilities and extensive product portfolios. In parallel, Chinese conglomerates such as Shandong Friendship, Wangkang Group, and Huafeng Group are aggressively increasing their market penetration through cost-effective production and a focus on emerging applications. Innovation is a critical differentiator, driven by the demand for sustainable and high-performance alternatives to genuine leather. Investments in R&D are primarily focused on developing eco-friendly materials with enhanced durability, breathability, and aesthetic appeal. Regulatory frameworks, particularly concerning environmental impact and chemical usage, are becoming more stringent, pushing manufacturers towards greener production methods and bio-based synthetic leathers. The threat of product substitutes, including traditional leather and other alternative materials, remains a constant challenge, necessitating continuous product improvement and differentiation. End-user trends are shifting towards stylish, durable, and ethically sourced materials, impacting product development across all applications. Mergers and acquisitions (M&A) activities, estimated to be in the range of several hundred million to over a billion dollars annually, are shaping the market landscape as larger entities seek to acquire innovative technologies or expand their geographical reach. For instance, strategic acquisitions of smaller, specialized synthetic leather producers are common.
Synthetic Leather Products Industry Trends & Insights
The synthetic leather products market is experiencing robust growth, projected to reach an estimated market size of over $XX million by 2033, with a Compound Annual Growth Rate (CAGR) of approximately XX% from the base year of 2025. This expansion is fueled by a confluence of factors, including the escalating demand for sustainable alternatives to genuine leather, driven by increasing environmental awareness and ethical consumerism. The price competitiveness of synthetic leather compared to real leather also plays a pivotal role in its widespread adoption across various industries. Technological advancements are continuously improving the quality, aesthetics, and performance characteristics of synthetic leathers, making them increasingly indistinguishable from their natural counterparts. Innovations in material science have led to the development of enhanced breathability, improved texture, and greater durability, catering to discerning consumers and demanding applications. The automotive sector, in particular, is a significant growth driver, with manufacturers increasingly opting for synthetic leather for car interiors due to its cost-effectiveness, ease of maintenance, and ability to meet stringent safety and aesthetic standards. The footwear and accessories segments also continue to be major demand centers, spurred by fashion trends and the accessibility of synthetic leather products. Furthermore, the rise of e-commerce platforms has facilitated wider market penetration and consumer reach for synthetic leather goods. Competitive dynamics are intensifying, with a focus on product differentiation, sustainable manufacturing practices, and strategic collaborations. Companies are investing heavily in research and development to create next-generation synthetic leathers that offer superior performance and a reduced environmental footprint. The market penetration of various types of synthetic leather, such as Normal PU and Microfiber PU, is expected to see continued growth, while Ecological Function PU is poised for significant expansion as sustainability concerns become paramount. The overall market penetration is estimated to reach over XX% by the end of the forecast period.
Dominant Markets & Segments in Synthetic Leather Products
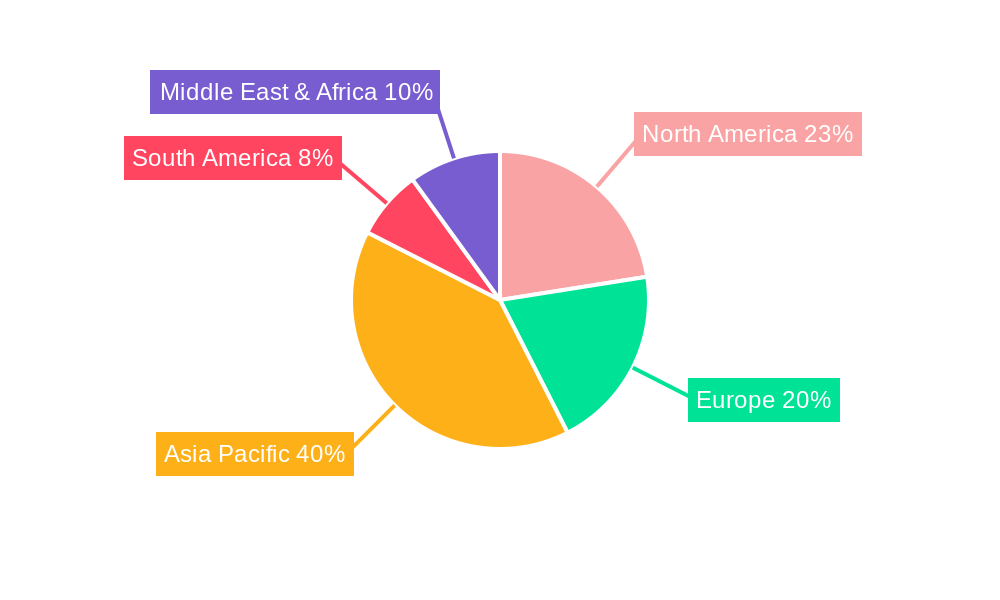
The global synthetic leather market is characterized by the dominance of the Asia-Pacific region, with countries like China and India leading in both production and consumption. This dominance is underpinned by several key drivers, including robust manufacturing infrastructure, a large and growing consumer base, and supportive government policies aimed at fostering industrial growth. China, in particular, accounts for a significant portion of global synthetic leather production, benefiting from economies of scale and a well-established supply chain for raw materials. Economic policies in the region often favor manufacturing exports, further boosting synthetic leather production. Infrastructure development, including efficient logistics and transportation networks, ensures timely delivery of raw materials and finished goods.
Within the application segments, Sport Shoes represent a dominant market, driven by the global surge in sports and fitness activities and the athleisure trend. The demand for lightweight, durable, and aesthetically pleasing footwear materials makes synthetic leather an ideal choice. The market size for synthetic leather in sport shoes is estimated to be over $XX million. Key drivers include:
- Growing Global Participation in Sports: Increased focus on health and wellness drives demand for athletic footwear.
- Fashion and Athleisure Trends: Synthetic leather offers versatility in design and color, aligning with fashion demands.
- Performance Enhancements: Manufacturers are utilizing advanced synthetic leathers for improved grip, flexibility, and shock absorption.
- Cost-Effectiveness: Synthetic leather provides a more affordable alternative for high-volume production.
The Bags segment also holds substantial market share, with a projected market size exceeding $XX million. Consumers' demand for stylish, durable, and affordable accessories fuels this segment.
- Fashion and Lifestyle: Handbags, backpacks, and luggage increasingly utilize synthetic leather for its aesthetic appeal and varied textures.
- Durability and Maintenance: Synthetic leather offers resistance to wear and tear and is easier to clean than natural leather.
- Vegan and Cruelty-Free Alternatives: Growing consumer preference for ethical products drives demand for synthetic leather bags.
- Versatility in Design: Wide range of colors, finishes, and textures available for creative product design.
The Car Interiors segment is witnessing significant growth, with an estimated market size of over $XX million. This is driven by the automotive industry's pursuit of cost-effective, durable, and easy-to-maintain materials.
- Automotive OEM Demand: Car manufacturers are increasingly adopting synthetic leather for seating, dashboards, and door panels.
- Enhanced Durability and Stain Resistance: Synthetic leather offers superior resistance to spills and wear compared to traditional upholstery.
- Cost Efficiency: Reduces manufacturing costs for automotive interiors without compromising aesthetics.
- Sustainability Initiatives: Growing trend towards lighter materials for fuel efficiency and eco-friendly interiors.
The Furniture segment, with an estimated market size of over $XX million, benefits from the demand for affordable and resilient upholstery options for residential and commercial spaces.
- Residential Furniture: Sofas, chairs, and ottomans are widely upholstered with synthetic leather for its durability and style.
- Commercial Upholstery: Offices, restaurants, and hospitality venues opt for synthetic leather for its ease of maintenance and longevity.
- Design Flexibility: Available in a wide array of colors, textures, and patterns to suit diverse interior design schemes.
Sports Goods, encompassing items like gloves, padding, and equipment, represent another significant application, with an estimated market size of over $XX million, driven by the need for durable and protective materials.
In terms of synthetic leather types, Normal PU continues to hold a significant market share due to its balanced cost-performance ratio and widespread availability, estimated at over $XX million. Microfiber PU is gaining traction for its premium feel and enhanced durability, with a projected market size of over $XX million. The Ecological Function PU segment is the fastest-growing, driven by increasing consumer and regulatory pressure for sustainable materials, with an estimated market size of over $XX million. The PVC segment, while facing competition from PU-based alternatives, still holds a considerable market share, especially in price-sensitive applications.
Synthetic Leather Products Product Developments
Recent product developments in the synthetic leather market are centered around sustainability and enhanced performance. Innovations include bio-based synthetic leathers derived from plant-based materials like corn and pineapple leaves, offering a reduced carbon footprint. Companies are also focusing on developing recycled synthetic leather materials, diverting waste from landfills. Advanced manufacturing techniques are creating synthetic leathers with superior breathability, water resistance, and tactile properties, closely mimicking the feel of genuine leather. These developments are expanding applications into high-end fashion, luxury automotive interiors, and premium footwear, providing competitive advantages through superior aesthetics and eco-credentials.
Report Scope & Segmentation Analysis
This report provides a comprehensive analysis of the synthetic leather products market, segmented across key applications and types. The Application segments include Sport Shoes, Bags, Furniture, Car Interiors, and Sports Goods. Each segment is analyzed for its market size, growth projections, and competitive dynamics. For instance, the Sport Shoes segment is projected to grow at a CAGR of XX% with a market size of over $XX million. The Bags segment is expected to reach over $XX million. The Furniture segment is estimated to be over $XX million. Car Interiors are projected to exceed $XX million, and Sports Goods are estimated at over $XX million.
The Type segmentation covers PVC, Normal PU, Microfiber PU, and Ecological Function PU. The Normal PU segment is expected to reach over $XX million, while Microfiber PU is projected to exceed $XX million. The rapidly evolving Ecological Function PU segment is anticipated to witness substantial growth, reaching over $XX million. The PVC segment, though facing increased competition, is still a significant contributor.
Key Drivers of Synthetic Leather Products Growth
Several key drivers are propelling the growth of the synthetic leather products market. Firstly, the increasing global demand for sustainable and ethically sourced materials is a significant factor, pushing consumers and manufacturers towards alternatives to genuine leather. Secondly, technological advancements in material science have led to the development of high-quality synthetic leathers that rival natural leather in terms of aesthetics, durability, and feel. Thirdly, the cost-effectiveness of synthetic leather, especially for large-scale production, makes it an attractive option across various industries. Furthermore, the expanding automotive sector's adoption of synthetic leather for interiors and the growing popularity of athleisure and fashion trends in footwear and accessories are substantial growth catalysts.
Challenges in the Synthetic Leather Products Sector
Despite its growth, the synthetic leather products sector faces several challenges. Regulatory hurdles related to chemical usage and waste disposal can impact production processes and costs. Supply chain disruptions, particularly for raw materials, can lead to price volatility and production delays, estimated to cause potential revenue losses of over $XX million annually. Intense competition from both established players and emerging manufacturers, especially in price-sensitive markets, can put pressure on profit margins. Furthermore, the perception of synthetic leather as a lower-quality alternative by some consumer segments continues to be a challenge, requiring ongoing efforts to educate consumers and improve product perception.
Emerging Opportunities in Synthetic Leather Products
Emerging opportunities in the synthetic leather products market are abundant, driven by innovation and changing consumer preferences. The growing demand for bio-based and recycled synthetic leathers presents a significant opportunity for manufacturers focusing on sustainable solutions. advancements in material science are opening doors for new applications in industries such as medical devices and protective apparel. The expansion of e-commerce platforms offers greater market reach for synthetic leather products globally. Moreover, the increasing adoption of smart textiles and functional synthetic leathers with integrated technologies presents a frontier for future product development and market differentiation.
Leading Players in the Synthetic Leather Products Market
Kuraray Toray Teijin Bayer Shandong Friendship Wangkang Group Asahi Kasei Duksung Daewon Chemical Filwel Kolon San Fang Chemical Nanya Wenzhou Imitation Leather Anhui Anli Fujian Tianshou Shandong Jinfeng Yantai Wanhua Shandong Tongda Jiaxing Hexin Xiefu new materials Huafeng Group Wenzhou Huanghe Meisheng Industrial Xiamen Hongxin Fujian Huayang Sanling Hongdeli
Key Developments in Synthetic Leather Products Industry
- 2023: Launch of a new range of plant-based synthetic leather by Kuraray, offering enhanced biodegradability.
- 2023: Shandong Friendship announces expansion of production capacity for microfiber PU to meet growing demand.
- 2023: Teijin introduces advanced ecological function PU with improved performance and reduced environmental impact.
- 2023: Bayer invests in R&D for novel synthetic leather coatings to enhance durability and aesthetics.
- 2023: Huafeng Group acquires a specialized chemical company to strengthen its raw material supply chain.
- 2024: Wangkang Group partners with a major automotive OEM to supply synthetic leather for new vehicle models.
- 2024: Asahi Kasei develops a new generation of PVC-free synthetic leather with superior tactile properties.
- 2024: Duksung launches a sustainable synthetic leather collection for fashion accessories, targeting eco-conscious consumers.
- 2024: Kolon expands its production of high-performance synthetic leather for sports footwear.
- 2024: San Fang Chemical introduces innovative fire-retardant synthetic leather for furniture applications.
Strategic Outlook for Synthetic Leather Products Market
The strategic outlook for the synthetic leather products market is exceptionally positive, driven by persistent demand for sustainable and cost-effective alternatives. Continued investment in research and development will be crucial for companies to stay ahead of the curve, focusing on bio-based materials, enhanced performance characteristics, and circular economy principles. Strategic partnerships and collaborations, along with targeted M&A activities, will enable players to consolidate market share, acquire innovative technologies, and expand their global footprint. The increasing consumer awareness regarding environmental impact and ethical sourcing will further propel the growth of ecological and functional synthetic leathers. The market is poised for sustained expansion, offering significant opportunities for both established leaders and agile new entrants.
Synthetic Leather Products Segmentation
-
1. Application
- 1.1. Sport Shoes
- 1.2. Bags
- 1.3. Furniture
- 1.4. Car Interiors
- 1.5. Sports Goods
-
2. Types
- 2.1. PVC
- 2.2. Normal PU
- 2.3. Microfiber PU
- 2.4. Ecological Function PU
Synthetic Leather Products Segmentation By Geography
-
1. North America
- 1.1. United States
- 1.2. Canada
- 1.3. Mexico
-
2. South America
- 2.1. Brazil
- 2.2. Argentina
- 2.3. Rest of South America
-
3. Europe
- 3.1. United Kingdom
- 3.2. Germany
- 3.3. France
- 3.4. Italy
- 3.5. Spain
- 3.6. Russia
- 3.7. Benelux
- 3.8. Nordics
- 3.9. Rest of Europe
-
4. Middle East & Africa
- 4.1. Turkey
- 4.2. Israel
- 4.3. GCC
- 4.4. North Africa
- 4.5. South Africa
- 4.6. Rest of Middle East & Africa
-
5. Asia Pacific
- 5.1. China
- 5.2. India
- 5.3. Japan
- 5.4. South Korea
- 5.5. ASEAN
- 5.6. Oceania
- 5.7. Rest of Asia Pacific
Synthetic Leather Products REPORT HIGHLIGHTS
| Aspects | Details |
|---|---|
| Study Period | 2019-2033 |
| Base Year | 2024 |
| Estimated Year | 2025 |
| Forecast Period | 2025-2033 |
| Historical Period | 2019-2024 |
| Growth Rate | CAGR of XX% from 2019-2033 |
| Segmentation |
|
Table of Contents
- 1. Introduction
- 1.1. Research Scope
- 1.2. Market Segmentation
- 1.3. Research Methodology
- 1.4. Definitions and Assumptions
- 2. Executive Summary
- 2.1. Introduction
- 3. Market Dynamics
- 3.1. Introduction
- 3.2. Market Drivers
- 3.3. Market Restrains
- 3.4. Market Trends
- 4. Market Factor Analysis
- 4.1. Porters Five Forces
- 4.2. Supply/Value Chain
- 4.3. PESTEL analysis
- 4.4. Market Entropy
- 4.5. Patent/Trademark Analysis
- 5. Global Synthetic Leather Products Analysis, Insights and Forecast, 2019-2031
- 5.1. Market Analysis, Insights and Forecast - by Application
- 5.1.1. Sport Shoes
- 5.1.2. Bags
- 5.1.3. Furniture
- 5.1.4. Car Interiors
- 5.1.5. Sports Goods
- 5.2. Market Analysis, Insights and Forecast - by Types
- 5.2.1. PVC
- 5.2.2. Normal PU
- 5.2.3. Microfiber PU
- 5.2.4. Ecological Function PU
- 5.3. Market Analysis, Insights and Forecast - by Region
- 5.3.1. North America
- 5.3.2. South America
- 5.3.3. Europe
- 5.3.4. Middle East & Africa
- 5.3.5. Asia Pacific
- 5.1. Market Analysis, Insights and Forecast - by Application
- 6. North America Synthetic Leather Products Analysis, Insights and Forecast, 2019-2031
- 6.1. Market Analysis, Insights and Forecast - by Application
- 6.1.1. Sport Shoes
- 6.1.2. Bags
- 6.1.3. Furniture
- 6.1.4. Car Interiors
- 6.1.5. Sports Goods
- 6.2. Market Analysis, Insights and Forecast - by Types
- 6.2.1. PVC
- 6.2.2. Normal PU
- 6.2.3. Microfiber PU
- 6.2.4. Ecological Function PU
- 6.1. Market Analysis, Insights and Forecast - by Application
- 7. South America Synthetic Leather Products Analysis, Insights and Forecast, 2019-2031
- 7.1. Market Analysis, Insights and Forecast - by Application
- 7.1.1. Sport Shoes
- 7.1.2. Bags
- 7.1.3. Furniture
- 7.1.4. Car Interiors
- 7.1.5. Sports Goods
- 7.2. Market Analysis, Insights and Forecast - by Types
- 7.2.1. PVC
- 7.2.2. Normal PU
- 7.2.3. Microfiber PU
- 7.2.4. Ecological Function PU
- 7.1. Market Analysis, Insights and Forecast - by Application
- 8. Europe Synthetic Leather Products Analysis, Insights and Forecast, 2019-2031
- 8.1. Market Analysis, Insights and Forecast - by Application
- 8.1.1. Sport Shoes
- 8.1.2. Bags
- 8.1.3. Furniture
- 8.1.4. Car Interiors
- 8.1.5. Sports Goods
- 8.2. Market Analysis, Insights and Forecast - by Types
- 8.2.1. PVC
- 8.2.2. Normal PU
- 8.2.3. Microfiber PU
- 8.2.4. Ecological Function PU
- 8.1. Market Analysis, Insights and Forecast - by Application
- 9. Middle East & Africa Synthetic Leather Products Analysis, Insights and Forecast, 2019-2031
- 9.1. Market Analysis, Insights and Forecast - by Application
- 9.1.1. Sport Shoes
- 9.1.2. Bags
- 9.1.3. Furniture
- 9.1.4. Car Interiors
- 9.1.5. Sports Goods
- 9.2. Market Analysis, Insights and Forecast - by Types
- 9.2.1. PVC
- 9.2.2. Normal PU
- 9.2.3. Microfiber PU
- 9.2.4. Ecological Function PU
- 9.1. Market Analysis, Insights and Forecast - by Application
- 10. Asia Pacific Synthetic Leather Products Analysis, Insights and Forecast, 2019-2031
- 10.1. Market Analysis, Insights and Forecast - by Application
- 10.1.1. Sport Shoes
- 10.1.2. Bags
- 10.1.3. Furniture
- 10.1.4. Car Interiors
- 10.1.5. Sports Goods
- 10.2. Market Analysis, Insights and Forecast - by Types
- 10.2.1. PVC
- 10.2.2. Normal PU
- 10.2.3. Microfiber PU
- 10.2.4. Ecological Function PU
- 10.1. Market Analysis, Insights and Forecast - by Application
- 11. Competitive Analysis
- 11.1. Global Market Share Analysis 2024
- 11.2. Company Profiles
- 11.2.1 Kuraray
- 11.2.1.1. Overview
- 11.2.1.2. Products
- 11.2.1.3. SWOT Analysis
- 11.2.1.4. Recent Developments
- 11.2.1.5. Financials (Based on Availability)
- 11.2.2 Toray
- 11.2.2.1. Overview
- 11.2.2.2. Products
- 11.2.2.3. SWOT Analysis
- 11.2.2.4. Recent Developments
- 11.2.2.5. Financials (Based on Availability)
- 11.2.3 Teijin
- 11.2.3.1. Overview
- 11.2.3.2. Products
- 11.2.3.3. SWOT Analysis
- 11.2.3.4. Recent Developments
- 11.2.3.5. Financials (Based on Availability)
- 11.2.4 Bayer
- 11.2.4.1. Overview
- 11.2.4.2. Products
- 11.2.4.3. SWOT Analysis
- 11.2.4.4. Recent Developments
- 11.2.4.5. Financials (Based on Availability)
- 11.2.5 Shandong Friendship
- 11.2.5.1. Overview
- 11.2.5.2. Products
- 11.2.5.3. SWOT Analysis
- 11.2.5.4. Recent Developments
- 11.2.5.5. Financials (Based on Availability)
- 11.2.6 Wangkang Group
- 11.2.6.1. Overview
- 11.2.6.2. Products
- 11.2.6.3. SWOT Analysis
- 11.2.6.4. Recent Developments
- 11.2.6.5. Financials (Based on Availability)
- 11.2.7 Asahi Kasei
- 11.2.7.1. Overview
- 11.2.7.2. Products
- 11.2.7.3. SWOT Analysis
- 11.2.7.4. Recent Developments
- 11.2.7.5. Financials (Based on Availability)
- 11.2.8 Duksung
- 11.2.8.1. Overview
- 11.2.8.2. Products
- 11.2.8.3. SWOT Analysis
- 11.2.8.4. Recent Developments
- 11.2.8.5. Financials (Based on Availability)
- 11.2.9 Daewon Chemical
- 11.2.9.1. Overview
- 11.2.9.2. Products
- 11.2.9.3. SWOT Analysis
- 11.2.9.4. Recent Developments
- 11.2.9.5. Financials (Based on Availability)
- 11.2.10 Filwel
- 11.2.10.1. Overview
- 11.2.10.2. Products
- 11.2.10.3. SWOT Analysis
- 11.2.10.4. Recent Developments
- 11.2.10.5. Financials (Based on Availability)
- 11.2.11 Kolon
- 11.2.11.1. Overview
- 11.2.11.2. Products
- 11.2.11.3. SWOT Analysis
- 11.2.11.4. Recent Developments
- 11.2.11.5. Financials (Based on Availability)
- 11.2.12 San Fang Chemical
- 11.2.12.1. Overview
- 11.2.12.2. Products
- 11.2.12.3. SWOT Analysis
- 11.2.12.4. Recent Developments
- 11.2.12.5. Financials (Based on Availability)
- 11.2.13 Nanya
- 11.2.13.1. Overview
- 11.2.13.2. Products
- 11.2.13.3. SWOT Analysis
- 11.2.13.4. Recent Developments
- 11.2.13.5. Financials (Based on Availability)
- 11.2.14 Wenzhou Imitation Leather
- 11.2.14.1. Overview
- 11.2.14.2. Products
- 11.2.14.3. SWOT Analysis
- 11.2.14.4. Recent Developments
- 11.2.14.5. Financials (Based on Availability)
- 11.2.15 Anhui Anli
- 11.2.15.1. Overview
- 11.2.15.2. Products
- 11.2.15.3. SWOT Analysis
- 11.2.15.4. Recent Developments
- 11.2.15.5. Financials (Based on Availability)
- 11.2.16 Fujian Tianshou
- 11.2.16.1. Overview
- 11.2.16.2. Products
- 11.2.16.3. SWOT Analysis
- 11.2.16.4. Recent Developments
- 11.2.16.5. Financials (Based on Availability)
- 11.2.17 Shandong Jinfeng
- 11.2.17.1. Overview
- 11.2.17.2. Products
- 11.2.17.3. SWOT Analysis
- 11.2.17.4. Recent Developments
- 11.2.17.5. Financials (Based on Availability)
- 11.2.18 Yantai Wanhua
- 11.2.18.1. Overview
- 11.2.18.2. Products
- 11.2.18.3. SWOT Analysis
- 11.2.18.4. Recent Developments
- 11.2.18.5. Financials (Based on Availability)
- 11.2.19 Shandong Tongda
- 11.2.19.1. Overview
- 11.2.19.2. Products
- 11.2.19.3. SWOT Analysis
- 11.2.19.4. Recent Developments
- 11.2.19.5. Financials (Based on Availability)
- 11.2.20 Jiaxing Hexin
- 11.2.20.1. Overview
- 11.2.20.2. Products
- 11.2.20.3. SWOT Analysis
- 11.2.20.4. Recent Developments
- 11.2.20.5. Financials (Based on Availability)
- 11.2.21 Xiefu new materials
- 11.2.21.1. Overview
- 11.2.21.2. Products
- 11.2.21.3. SWOT Analysis
- 11.2.21.4. Recent Developments
- 11.2.21.5. Financials (Based on Availability)
- 11.2.22 Huafeng Group
- 11.2.22.1. Overview
- 11.2.22.2. Products
- 11.2.22.3. SWOT Analysis
- 11.2.22.4. Recent Developments
- 11.2.22.5. Financials (Based on Availability)
- 11.2.23 Wenzhou Huanghe
- 11.2.23.1. Overview
- 11.2.23.2. Products
- 11.2.23.3. SWOT Analysis
- 11.2.23.4. Recent Developments
- 11.2.23.5. Financials (Based on Availability)
- 11.2.24 Meisheng Industrial
- 11.2.24.1. Overview
- 11.2.24.2. Products
- 11.2.24.3. SWOT Analysis
- 11.2.24.4. Recent Developments
- 11.2.24.5. Financials (Based on Availability)
- 11.2.25 Xiamen Hongxin
- 11.2.25.1. Overview
- 11.2.25.2. Products
- 11.2.25.3. SWOT Analysis
- 11.2.25.4. Recent Developments
- 11.2.25.5. Financials (Based on Availability)
- 11.2.26 Fujian Huayang
- 11.2.26.1. Overview
- 11.2.26.2. Products
- 11.2.26.3. SWOT Analysis
- 11.2.26.4. Recent Developments
- 11.2.26.5. Financials (Based on Availability)
- 11.2.27 Sanling
- 11.2.27.1. Overview
- 11.2.27.2. Products
- 11.2.27.3. SWOT Analysis
- 11.2.27.4. Recent Developments
- 11.2.27.5. Financials (Based on Availability)
- 11.2.28 Hongdeli
- 11.2.28.1. Overview
- 11.2.28.2. Products
- 11.2.28.3. SWOT Analysis
- 11.2.28.4. Recent Developments
- 11.2.28.5. Financials (Based on Availability)
- 11.2.1 Kuraray
List of Figures
- Figure 1: Global Synthetic Leather Products Revenue Breakdown (million, %) by Region 2024 & 2032
- Figure 2: North America Synthetic Leather Products Revenue (million), by Application 2024 & 2032
- Figure 3: North America Synthetic Leather Products Revenue Share (%), by Application 2024 & 2032
- Figure 4: North America Synthetic Leather Products Revenue (million), by Types 2024 & 2032
- Figure 5: North America Synthetic Leather Products Revenue Share (%), by Types 2024 & 2032
- Figure 6: North America Synthetic Leather Products Revenue (million), by Country 2024 & 2032
- Figure 7: North America Synthetic Leather Products Revenue Share (%), by Country 2024 & 2032
- Figure 8: South America Synthetic Leather Products Revenue (million), by Application 2024 & 2032
- Figure 9: South America Synthetic Leather Products Revenue Share (%), by Application 2024 & 2032
- Figure 10: South America Synthetic Leather Products Revenue (million), by Types 2024 & 2032
- Figure 11: South America Synthetic Leather Products Revenue Share (%), by Types 2024 & 2032
- Figure 12: South America Synthetic Leather Products Revenue (million), by Country 2024 & 2032
- Figure 13: South America Synthetic Leather Products Revenue Share (%), by Country 2024 & 2032
- Figure 14: Europe Synthetic Leather Products Revenue (million), by Application 2024 & 2032
- Figure 15: Europe Synthetic Leather Products Revenue Share (%), by Application 2024 & 2032
- Figure 16: Europe Synthetic Leather Products Revenue (million), by Types 2024 & 2032
- Figure 17: Europe Synthetic Leather Products Revenue Share (%), by Types 2024 & 2032
- Figure 18: Europe Synthetic Leather Products Revenue (million), by Country 2024 & 2032
- Figure 19: Europe Synthetic Leather Products Revenue Share (%), by Country 2024 & 2032
- Figure 20: Middle East & Africa Synthetic Leather Products Revenue (million), by Application 2024 & 2032
- Figure 21: Middle East & Africa Synthetic Leather Products Revenue Share (%), by Application 2024 & 2032
- Figure 22: Middle East & Africa Synthetic Leather Products Revenue (million), by Types 2024 & 2032
- Figure 23: Middle East & Africa Synthetic Leather Products Revenue Share (%), by Types 2024 & 2032
- Figure 24: Middle East & Africa Synthetic Leather Products Revenue (million), by Country 2024 & 2032
- Figure 25: Middle East & Africa Synthetic Leather Products Revenue Share (%), by Country 2024 & 2032
- Figure 26: Asia Pacific Synthetic Leather Products Revenue (million), by Application 2024 & 2032
- Figure 27: Asia Pacific Synthetic Leather Products Revenue Share (%), by Application 2024 & 2032
- Figure 28: Asia Pacific Synthetic Leather Products Revenue (million), by Types 2024 & 2032
- Figure 29: Asia Pacific Synthetic Leather Products Revenue Share (%), by Types 2024 & 2032
- Figure 30: Asia Pacific Synthetic Leather Products Revenue (million), by Country 2024 & 2032
- Figure 31: Asia Pacific Synthetic Leather Products Revenue Share (%), by Country 2024 & 2032
List of Tables
- Table 1: Global Synthetic Leather Products Revenue million Forecast, by Region 2019 & 2032
- Table 2: Global Synthetic Leather Products Revenue million Forecast, by Application 2019 & 2032
- Table 3: Global Synthetic Leather Products Revenue million Forecast, by Types 2019 & 2032
- Table 4: Global Synthetic Leather Products Revenue million Forecast, by Region 2019 & 2032
- Table 5: Global Synthetic Leather Products Revenue million Forecast, by Application 2019 & 2032
- Table 6: Global Synthetic Leather Products Revenue million Forecast, by Types 2019 & 2032
- Table 7: Global Synthetic Leather Products Revenue million Forecast, by Country 2019 & 2032
- Table 8: United States Synthetic Leather Products Revenue (million) Forecast, by Application 2019 & 2032
- Table 9: Canada Synthetic Leather Products Revenue (million) Forecast, by Application 2019 & 2032
- Table 10: Mexico Synthetic Leather Products Revenue (million) Forecast, by Application 2019 & 2032
- Table 11: Global Synthetic Leather Products Revenue million Forecast, by Application 2019 & 2032
- Table 12: Global Synthetic Leather Products Revenue million Forecast, by Types 2019 & 2032
- Table 13: Global Synthetic Leather Products Revenue million Forecast, by Country 2019 & 2032
- Table 14: Brazil Synthetic Leather Products Revenue (million) Forecast, by Application 2019 & 2032
- Table 15: Argentina Synthetic Leather Products Revenue (million) Forecast, by Application 2019 & 2032
- Table 16: Rest of South America Synthetic Leather Products Revenue (million) Forecast, by Application 2019 & 2032
- Table 17: Global Synthetic Leather Products Revenue million Forecast, by Application 2019 & 2032
- Table 18: Global Synthetic Leather Products Revenue million Forecast, by Types 2019 & 2032
- Table 19: Global Synthetic Leather Products Revenue million Forecast, by Country 2019 & 2032
- Table 20: United Kingdom Synthetic Leather Products Revenue (million) Forecast, by Application 2019 & 2032
- Table 21: Germany Synthetic Leather Products Revenue (million) Forecast, by Application 2019 & 2032
- Table 22: France Synthetic Leather Products Revenue (million) Forecast, by Application 2019 & 2032
- Table 23: Italy Synthetic Leather Products Revenue (million) Forecast, by Application 2019 & 2032
- Table 24: Spain Synthetic Leather Products Revenue (million) Forecast, by Application 2019 & 2032
- Table 25: Russia Synthetic Leather Products Revenue (million) Forecast, by Application 2019 & 2032
- Table 26: Benelux Synthetic Leather Products Revenue (million) Forecast, by Application 2019 & 2032
- Table 27: Nordics Synthetic Leather Products Revenue (million) Forecast, by Application 2019 & 2032
- Table 28: Rest of Europe Synthetic Leather Products Revenue (million) Forecast, by Application 2019 & 2032
- Table 29: Global Synthetic Leather Products Revenue million Forecast, by Application 2019 & 2032
- Table 30: Global Synthetic Leather Products Revenue million Forecast, by Types 2019 & 2032
- Table 31: Global Synthetic Leather Products Revenue million Forecast, by Country 2019 & 2032
- Table 32: Turkey Synthetic Leather Products Revenue (million) Forecast, by Application 2019 & 2032
- Table 33: Israel Synthetic Leather Products Revenue (million) Forecast, by Application 2019 & 2032
- Table 34: GCC Synthetic Leather Products Revenue (million) Forecast, by Application 2019 & 2032
- Table 35: North Africa Synthetic Leather Products Revenue (million) Forecast, by Application 2019 & 2032
- Table 36: South Africa Synthetic Leather Products Revenue (million) Forecast, by Application 2019 & 2032
- Table 37: Rest of Middle East & Africa Synthetic Leather Products Revenue (million) Forecast, by Application 2019 & 2032
- Table 38: Global Synthetic Leather Products Revenue million Forecast, by Application 2019 & 2032
- Table 39: Global Synthetic Leather Products Revenue million Forecast, by Types 2019 & 2032
- Table 40: Global Synthetic Leather Products Revenue million Forecast, by Country 2019 & 2032
- Table 41: China Synthetic Leather Products Revenue (million) Forecast, by Application 2019 & 2032
- Table 42: India Synthetic Leather Products Revenue (million) Forecast, by Application 2019 & 2032
- Table 43: Japan Synthetic Leather Products Revenue (million) Forecast, by Application 2019 & 2032
- Table 44: South Korea Synthetic Leather Products Revenue (million) Forecast, by Application 2019 & 2032
- Table 45: ASEAN Synthetic Leather Products Revenue (million) Forecast, by Application 2019 & 2032
- Table 46: Oceania Synthetic Leather Products Revenue (million) Forecast, by Application 2019 & 2032
- Table 47: Rest of Asia Pacific Synthetic Leather Products Revenue (million) Forecast, by Application 2019 & 2032
Frequently Asked Questions
1. What is the projected Compound Annual Growth Rate (CAGR) of the Synthetic Leather Products?
The projected CAGR is approximately XX%.
2. Which companies are prominent players in the Synthetic Leather Products?
Key companies in the market include Kuraray, Toray, Teijin, Bayer, Shandong Friendship, Wangkang Group, Asahi Kasei, Duksung, Daewon Chemical, Filwel, Kolon, San Fang Chemical, Nanya, Wenzhou Imitation Leather, Anhui Anli, Fujian Tianshou, Shandong Jinfeng, Yantai Wanhua, Shandong Tongda, Jiaxing Hexin, Xiefu new materials, Huafeng Group, Wenzhou Huanghe, Meisheng Industrial, Xiamen Hongxin, Fujian Huayang, Sanling, Hongdeli.
3. What are the main segments of the Synthetic Leather Products?
The market segments include Application, Types.
4. Can you provide details about the market size?
The market size is estimated to be USD XXX million as of 2022.
5. What are some drivers contributing to market growth?
N/A
6. What are the notable trends driving market growth?
N/A
7. Are there any restraints impacting market growth?
N/A
8. Can you provide examples of recent developments in the market?
N/A
9. What pricing options are available for accessing the report?
Pricing options include single-user, multi-user, and enterprise licenses priced at USD 4900.00, USD 7350.00, and USD 9800.00 respectively.
10. Is the market size provided in terms of value or volume?
The market size is provided in terms of value, measured in million.
11. Are there any specific market keywords associated with the report?
Yes, the market keyword associated with the report is "Synthetic Leather Products," which aids in identifying and referencing the specific market segment covered.
12. How do I determine which pricing option suits my needs best?
The pricing options vary based on user requirements and access needs. Individual users may opt for single-user licenses, while businesses requiring broader access may choose multi-user or enterprise licenses for cost-effective access to the report.
13. Are there any additional resources or data provided in the Synthetic Leather Products report?
While the report offers comprehensive insights, it's advisable to review the specific contents or supplementary materials provided to ascertain if additional resources or data are available.
14. How can I stay updated on further developments or reports in the Synthetic Leather Products?
To stay informed about further developments, trends, and reports in the Synthetic Leather Products, consider subscribing to industry newsletters, following relevant companies and organizations, or regularly checking reputable industry news sources and publications.
Methodology
Step 1 - Identification of Relevant Samples Size from Population Database


Step 2 - Approaches for Defining Global Market Size (Value, Volume* & Price*)

Note*: In applicable scenarios
Step 3 - Data Sources
Primary Research
- Web Analytics
- Survey Reports
- Research Institute
- Latest Research Reports
- Opinion Leaders
Secondary Research
- Annual Reports
- White Paper
- Latest Press Release
- Industry Association
- Paid Database
- Investor Presentations

Step 4 - Data Triangulation
Involves using different sources of information in order to increase the validity of a study
These sources are likely to be stakeholders in a program - participants, other researchers, program staff, other community members, and so on.
Then we put all data in single framework & apply various statistical tools to find out the dynamic on the market.
During the analysis stage, feedback from the stakeholder groups would be compared to determine areas of agreement as well as areas of divergence


