
Key Insights
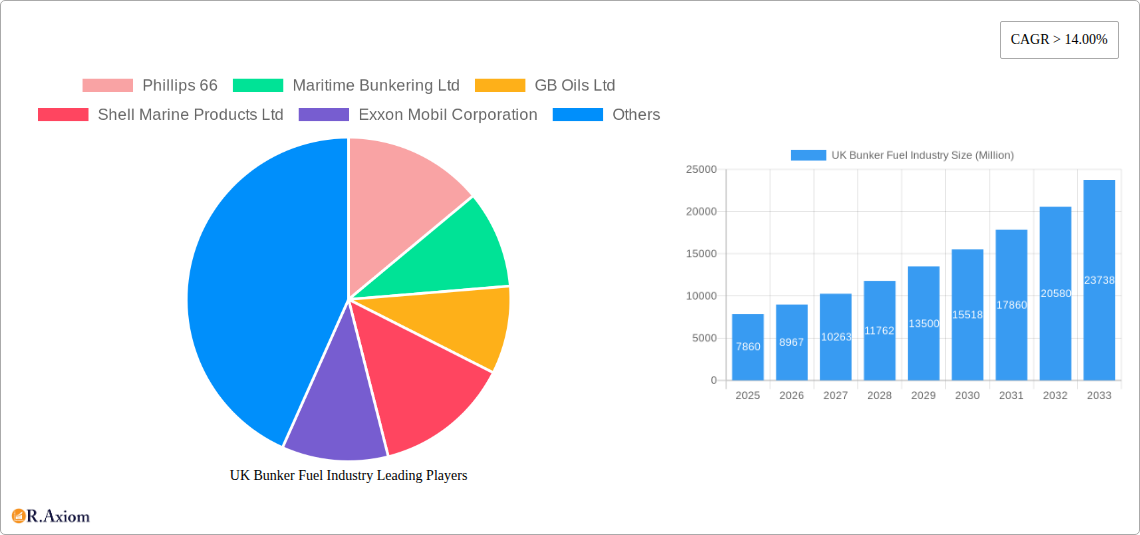
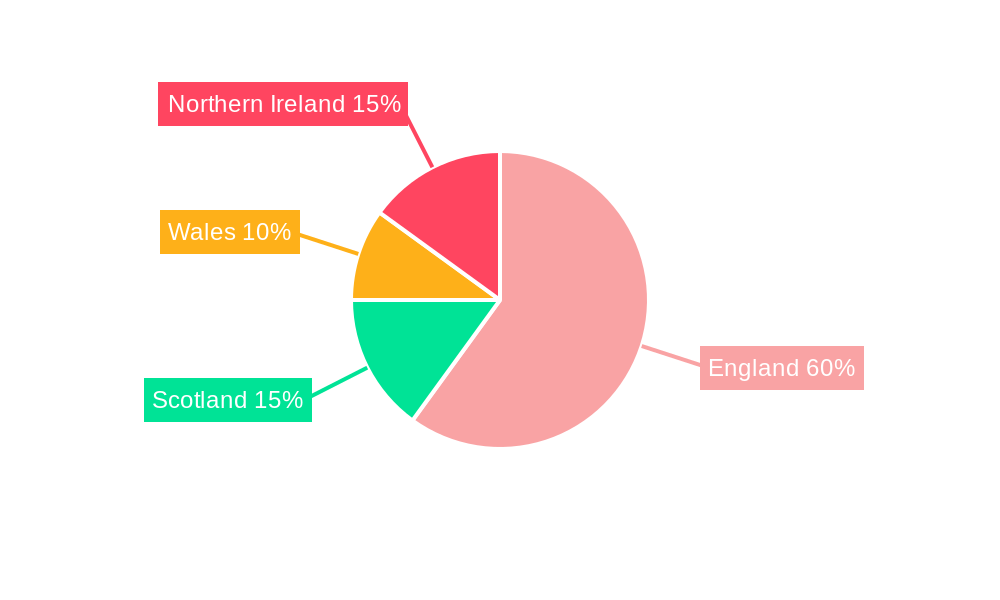
The UK bunker fuel market, valued at approximately £7860 million in 2025, is experiencing robust growth, projected to expand at a Compound Annual Growth Rate (CAGR) exceeding 14% from 2025 to 2033. This surge is primarily driven by the increasing maritime trade volume in and around the UK, particularly container and tanker shipping, fueled by globalisation and e-commerce. Stringent environmental regulations, including the International Maritime Organization's (IMO) 2020 sulfur cap, are also significantly impacting the market. The shift towards cleaner fuels like Very-Low Sulfur Fuel Oil (VLSFO) and Liquefied Natural Gas (LNG) is a major trend, while the price volatility of crude oil and potential future regulations pose restraints on growth. The market is segmented by fuel type (HSFO, VLSFO, MGO, LNG, Others) and vessel type (Containers, Tankers, General Cargo, Bulk Carriers, Others), with VLSFO and LNG witnessing the highest growth due to environmental concerns and regulatory pressures. Major players like Phillips 66, Shell Marine Products, and BP PLC are strategically positioning themselves to capitalize on this transition, investing in infrastructure and expanding their offerings of compliant fuels. The regional distribution within the UK likely mirrors the concentration of port activity, with England, particularly its southern ports, commanding a larger share of the market.
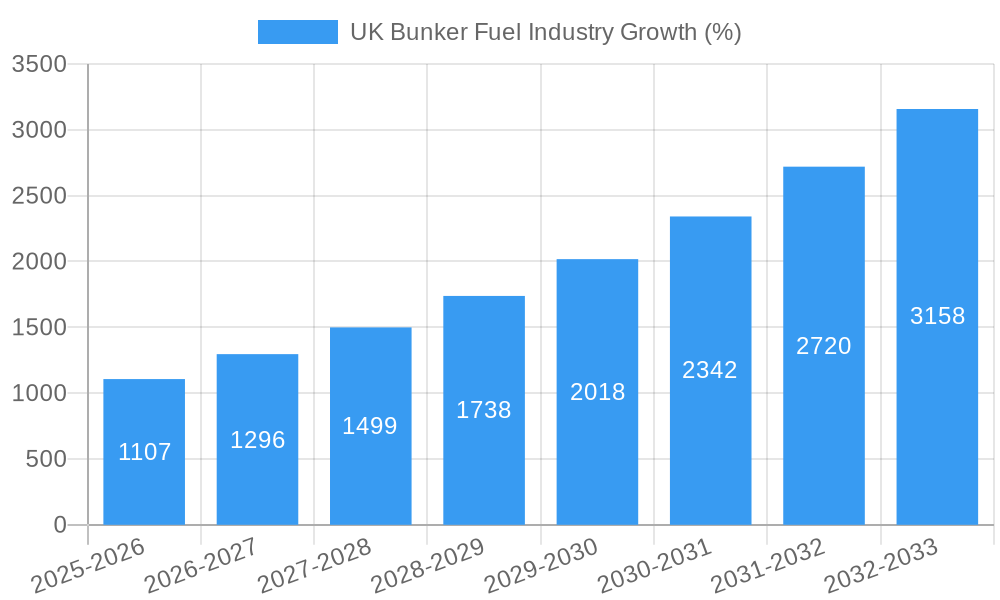
The forecast period (2025-2033) anticipates a substantial increase in market size, exceeding £7860 million. This growth trajectory is underpinned by the continuing expansion of global trade, the increasing demand for efficient and environmentally friendly shipping solutions, and ongoing technological advancements in fuel production and bunkering infrastructure. However, economic fluctuations and potential geopolitical instability can influence the pace of market expansion. The competitive landscape is dynamic, with established players facing pressure from newer entrants focused on sustainable and low-emission fuels. This makes investment in research and development and strategic partnerships crucial for maintaining a competitive edge in the evolving UK bunker fuel market. Successfully navigating the regulatory landscape and catering to evolving customer demands for environmentally responsible options are key to future success.
UK Bunker Fuel Industry: A Comprehensive Market Report (2019-2033)
This in-depth report provides a comprehensive analysis of the UK bunker fuel industry, offering invaluable insights for industry stakeholders, investors, and strategic decision-makers. Covering the period 2019-2033, with a base year of 2025 and a forecast period of 2025-2033, this report dissects market trends, competitive dynamics, and future growth potential. The report leverages extensive data analysis to provide actionable intelligence, crucial for navigating the complexities of this dynamic sector.
UK Bunker Fuel Industry Market Concentration & Innovation
The UK bunker fuel market exhibits a moderately concentrated structure, with several major players holding significant market share. Key players such as Shell Marine Products Ltd, BP PLC, Exxon Mobil Corporation, and Phillips 66 dominate the market, collectively accounting for an estimated xx% of the total market revenue in 2025. However, smaller independent suppliers like GB Oils Ltd and Maritime Bunkering Ltd also play a significant role, particularly in niche segments. Market share fluctuations are influenced by factors such as fuel pricing, supply chain efficiency, and strategic partnerships.
Innovation is driven by stringent environmental regulations and the increasing demand for cleaner fuels. Major players are investing heavily in Research & Development (R&D) for alternative fuels like LNG and the development of low-sulphur fuel blends. The regulatory landscape, particularly concerning sulfur emissions, significantly shapes innovation. The adoption of IMO 2020 regulations has accelerated the shift towards VLSFO, driving substantial investments in infrastructure and technology upgrades. The market witnesses ongoing M&A activity, with deal values reaching an estimated xx Million in 2024. These acquisitions often aim to consolidate market share, expand geographical reach, and access new technologies. Examples include [Specific example of an M&A deal if available with values, otherwise state "Further details on specific M&A activity are available within the full report"]. End-user trends, particularly towards fuel efficiency and environmental responsibility, further propel innovation within the industry.
UK Bunker Fuel Industry Industry Trends & Insights
The UK bunker fuel market is experiencing dynamic growth, driven by several key factors. The global shipping industry's recovery post-pandemic, coupled with increased trade activity, is a significant contributor to market expansion. The compound annual growth rate (CAGR) is projected at xx% between 2025 and 2033, reaching a market size of xx Million by 2033. This growth is further fuelled by the increasing adoption of VLSFO, driven by stricter environmental regulations. However, the transition to alternative fuels like LNG faces challenges due to limited bunkering infrastructure and higher fuel costs. Market penetration of LNG is currently low but expected to increase gradually over the forecast period, reaching an estimated xx% by 2033. Competitive dynamics are marked by pricing strategies, strategic partnerships, and investments in infrastructure. Major players are focusing on optimizing their supply chains, expanding their bunkering networks, and strengthening their customer relationships to maintain a competitive edge. Consumer preferences are increasingly shifting towards sustainable and environmentally friendly fuel options, forcing players to adapt and innovate to meet these demands.
Dominant Markets & Segments in UK Bunker Fuel Industry
Leading Segment by Fuel Type: VLSFO is the dominant segment within the UK bunker fuel market, owing to the stringent IMO 2020 regulations and growing environmental awareness. Its market share is projected to remain above xx% throughout the forecast period. High Sulphur Fuel Oil (HSFO) usage is declining due to environmental restrictions. Marine Gas Oil (MGO) maintains a steady demand, particularly for smaller vessels. LNG is a nascent but rapidly growing segment, driven by investments in infrastructure and growing environmental concerns. Other fuel types represent a smaller but significant portion of the market.
Leading Segment by Vessel Type: Tankers and Container ships constitute the largest segments within the vessel type category, contributing to the majority of bunker fuel consumption. Bulk carriers and general cargo ships also contribute significantly to market demand.
Key Drivers: The dominance of VLSFO and tankers is driven by factors such as regulatory pressures, the high volume of container traffic through UK ports, and the prevalence of large-scale tankers in international trade. Economic policies supporting cleaner shipping and investments in port infrastructure further underpin the market's development.
UK Bunker Fuel Industry Product Developments
Recent product developments focus on enhancing fuel efficiency, reducing emissions, and meeting evolving environmental regulations. The industry is actively developing and testing new fuel blends, including those incorporating biofuels and other alternative components. Companies are also investing in technologies to improve fuel storage, handling, and delivery, enhancing the efficiency of the supply chain. These innovations aim to provide customers with cleaner, more cost-effective, and environmentally responsible fuel solutions, aligning with industry trends and consumer preferences.
Report Scope & Segmentation Analysis
This report segments the UK bunker fuel market based on fuel type (HSFO, VLSFO, MGO, LNG, Others) and vessel type (Containers, Tankers, General Cargo, Bulk Container, Others). Each segment is analyzed in detail, providing insights into market size, growth projections, competitive dynamics, and key drivers. For instance, the VLSFO segment exhibits significant growth potential, while the LNG segment demonstrates the fastest growth but faces challenges related to infrastructure development. Detailed projections for each segment are provided within the full report.
Key Drivers of UK Bunker Fuel Industry Growth
Growth in the UK bunker fuel industry is driven by several factors, including the increasing volume of global shipping traffic, stricter environmental regulations promoting the use of cleaner fuels, and investments in port infrastructure. The expansion of the renewable energy sector and the growth of e-commerce further contribute to the demand for bunker fuel. These factors collectively drive significant market growth, particularly in the VLSFO segment.
Challenges in the UK Bunker Fuel Industry Sector
The industry faces challenges including the high volatility of crude oil prices, the increasing costs of compliance with stricter environmental regulations, and the limited availability of LNG bunkering infrastructure. Competition from alternative fuels and supply chain disruptions also pose significant hurdles, impacting both profitability and operational efficiency. These factors can impact market growth and profitability.
Emerging Opportunities in UK Bunker Fuel Industry
Emerging opportunities lie in the growing adoption of LNG as a cleaner alternative fuel, the development of biofuels, and the expansion of bunkering infrastructure to support the transition to cleaner fuels. Strategic partnerships, technological advancements in fuel efficiency, and collaborations to enhance supply chain efficiency present further opportunities for growth and innovation.
Leading Players in the UK Bunker Fuel Industry Market
- Phillips 66
- Maritime Bunkering Ltd
- GB Oils Ltd
- Shell Marine Products Ltd
- Exxon Mobil Corporation
- Mærsk A/S
- ConocoPhillips Ltd
- Greenergy International Ltd
- Rosneft Marine UK Ltd
- BP PLC
- Henty Oil Ltd
Key Developments in UK Bunker Fuel Industry Industry
- 2022-2023: Several companies announced investments in LNG bunkering infrastructure, aiming to expand their capabilities and meet growing demand for cleaner fuels.
- 2021-2022: Significant regulatory changes related to bunker fuel specifications and emissions were implemented, driving a shift towards VLSFO and pushing innovation in fuel technology.
- 2019-2024: Ongoing development and testing of new fuel blends and technologies, including biofuels, are underway, reflecting the industry's commitment to sustainable practices.
- Ongoing: Merger and acquisition activity continues, reshaping the competitive landscape and influencing market dynamics. [Specific details on mergers and acquisitions with dates are included within the full report]
Strategic Outlook for UK Bunker Fuel Industry Market
The UK bunker fuel market presents a significant growth opportunity, driven by the increasing demand for shipping services and the ongoing transition to cleaner fuels. Strategic investments in infrastructure, technological advancements in fuel efficiency, and a focus on sustainability will play crucial roles in shaping the future of the market. Companies that successfully adapt to evolving regulations, embrace innovation, and build resilient supply chains are likely to capture significant market share in the years to come.
UK Bunker Fuel Industry Segmentation
-
1. Type
- 1.1. High Sulfur Fuel Oil (HSFO)
- 1.2. Very-Low Sulfur Fuel Oil (VLSFO)
- 1.3. Marine Gas Oil (MGO)
- 1.4. Liquefied Natural Gas (LNG)
- 1.5. Others
-
2. Vessel Type
- 2.1. Containers
- 2.2. Tankers
- 2.3. General Cargo
- 2.4. Bulk Container
- 2.5. Others
UK Bunker Fuel Industry Segmentation By Geography
-
1. North America
- 1.1. United States
- 1.2. Canada
- 1.3. Mexico
-
2. South America
- 2.1. Brazil
- 2.2. Argentina
- 2.3. Rest of South America
-
3. Europe
- 3.1. United Kingdom
- 3.2. Germany
- 3.3. France
- 3.4. Italy
- 3.5. Spain
- 3.6. Russia
- 3.7. Benelux
- 3.8. Nordics
- 3.9. Rest of Europe
-
4. Middle East & Africa
- 4.1. Turkey
- 4.2. Israel
- 4.3. GCC
- 4.4. North Africa
- 4.5. South Africa
- 4.6. Rest of Middle East & Africa
-
5. Asia Pacific
- 5.1. China
- 5.2. India
- 5.3. Japan
- 5.4. South Korea
- 5.5. ASEAN
- 5.6. Oceania
- 5.7. Rest of Asia Pacific
UK Bunker Fuel Industry REPORT HIGHLIGHTS
| Aspects | Details |
|---|---|
| Study Period | 2019-2033 |
| Base Year | 2024 |
| Estimated Year | 2025 |
| Forecast Period | 2025-2033 |
| Historical Period | 2019-2024 |
| Growth Rate | CAGR of > 14.00% from 2019-2033 |
| Segmentation |
|
Table of Contents
- 1. Introduction
- 1.1. Research Scope
- 1.2. Market Segmentation
- 1.3. Research Methodology
- 1.4. Definitions and Assumptions
- 2. Executive Summary
- 2.1. Introduction
- 3. Market Dynamics
- 3.1. Introduction
- 3.2. Market Drivers
- 3.2.1. 4.; Increasing Demand for Petroleum Products Due to the Growth of the Local Economy4.; Government Initiatives to Boost the Production of Crude Oil and Natural Gas
- 3.3. Market Restrains
- 3.3.1. 4.; Increasing Adoption of Renewable Energy
- 3.4. Market Trends
- 3.4.1. Very Low Sulphur Fuel Oil (VLSFO) to Witness Significant Growth
- 4. Market Factor Analysis
- 4.1. Porters Five Forces
- 4.2. Supply/Value Chain
- 4.3. PESTEL analysis
- 4.4. Market Entropy
- 4.5. Patent/Trademark Analysis
- 5. Global UK Bunker Fuel Industry Analysis, Insights and Forecast, 2019-2031
- 5.1. Market Analysis, Insights and Forecast - by Type
- 5.1.1. High Sulfur Fuel Oil (HSFO)
- 5.1.2. Very-Low Sulfur Fuel Oil (VLSFO)
- 5.1.3. Marine Gas Oil (MGO)
- 5.1.4. Liquefied Natural Gas (LNG)
- 5.1.5. Others
- 5.2. Market Analysis, Insights and Forecast - by Vessel Type
- 5.2.1. Containers
- 5.2.2. Tankers
- 5.2.3. General Cargo
- 5.2.4. Bulk Container
- 5.2.5. Others
- 5.3. Market Analysis, Insights and Forecast - by Region
- 5.3.1. North America
- 5.3.2. South America
- 5.3.3. Europe
- 5.3.4. Middle East & Africa
- 5.3.5. Asia Pacific
- 5.1. Market Analysis, Insights and Forecast - by Type
- 6. North America UK Bunker Fuel Industry Analysis, Insights and Forecast, 2019-2031
- 6.1. Market Analysis, Insights and Forecast - by Type
- 6.1.1. High Sulfur Fuel Oil (HSFO)
- 6.1.2. Very-Low Sulfur Fuel Oil (VLSFO)
- 6.1.3. Marine Gas Oil (MGO)
- 6.1.4. Liquefied Natural Gas (LNG)
- 6.1.5. Others
- 6.2. Market Analysis, Insights and Forecast - by Vessel Type
- 6.2.1. Containers
- 6.2.2. Tankers
- 6.2.3. General Cargo
- 6.2.4. Bulk Container
- 6.2.5. Others
- 6.1. Market Analysis, Insights and Forecast - by Type
- 7. South America UK Bunker Fuel Industry Analysis, Insights and Forecast, 2019-2031
- 7.1. Market Analysis, Insights and Forecast - by Type
- 7.1.1. High Sulfur Fuel Oil (HSFO)
- 7.1.2. Very-Low Sulfur Fuel Oil (VLSFO)
- 7.1.3. Marine Gas Oil (MGO)
- 7.1.4. Liquefied Natural Gas (LNG)
- 7.1.5. Others
- 7.2. Market Analysis, Insights and Forecast - by Vessel Type
- 7.2.1. Containers
- 7.2.2. Tankers
- 7.2.3. General Cargo
- 7.2.4. Bulk Container
- 7.2.5. Others
- 7.1. Market Analysis, Insights and Forecast - by Type
- 8. Europe UK Bunker Fuel Industry Analysis, Insights and Forecast, 2019-2031
- 8.1. Market Analysis, Insights and Forecast - by Type
- 8.1.1. High Sulfur Fuel Oil (HSFO)
- 8.1.2. Very-Low Sulfur Fuel Oil (VLSFO)
- 8.1.3. Marine Gas Oil (MGO)
- 8.1.4. Liquefied Natural Gas (LNG)
- 8.1.5. Others
- 8.2. Market Analysis, Insights and Forecast - by Vessel Type
- 8.2.1. Containers
- 8.2.2. Tankers
- 8.2.3. General Cargo
- 8.2.4. Bulk Container
- 8.2.5. Others
- 8.1. Market Analysis, Insights and Forecast - by Type
- 9. Middle East & Africa UK Bunker Fuel Industry Analysis, Insights and Forecast, 2019-2031
- 9.1. Market Analysis, Insights and Forecast - by Type
- 9.1.1. High Sulfur Fuel Oil (HSFO)
- 9.1.2. Very-Low Sulfur Fuel Oil (VLSFO)
- 9.1.3. Marine Gas Oil (MGO)
- 9.1.4. Liquefied Natural Gas (LNG)
- 9.1.5. Others
- 9.2. Market Analysis, Insights and Forecast - by Vessel Type
- 9.2.1. Containers
- 9.2.2. Tankers
- 9.2.3. General Cargo
- 9.2.4. Bulk Container
- 9.2.5. Others
- 9.1. Market Analysis, Insights and Forecast - by Type
- 10. Asia Pacific UK Bunker Fuel Industry Analysis, Insights and Forecast, 2019-2031
- 10.1. Market Analysis, Insights and Forecast - by Type
- 10.1.1. High Sulfur Fuel Oil (HSFO)
- 10.1.2. Very-Low Sulfur Fuel Oil (VLSFO)
- 10.1.3. Marine Gas Oil (MGO)
- 10.1.4. Liquefied Natural Gas (LNG)
- 10.1.5. Others
- 10.2. Market Analysis, Insights and Forecast - by Vessel Type
- 10.2.1. Containers
- 10.2.2. Tankers
- 10.2.3. General Cargo
- 10.2.4. Bulk Container
- 10.2.5. Others
- 10.1. Market Analysis, Insights and Forecast - by Type
- 11. England UK Bunker Fuel Industry Analysis, Insights and Forecast, 2019-2031
- 12. Wales UK Bunker Fuel Industry Analysis, Insights and Forecast, 2019-2031
- 13. Scotland UK Bunker Fuel Industry Analysis, Insights and Forecast, 2019-2031
- 14. Northern UK Bunker Fuel Industry Analysis, Insights and Forecast, 2019-2031
- 15. Ireland UK Bunker Fuel Industry Analysis, Insights and Forecast, 2019-2031
- 16. Competitive Analysis
- 16.1. Global Market Share Analysis 2024
- 16.2. Company Profiles
- 16.2.1 Phillips 66
- 16.2.1.1. Overview
- 16.2.1.2. Products
- 16.2.1.3. SWOT Analysis
- 16.2.1.4. Recent Developments
- 16.2.1.5. Financials (Based on Availability)
- 16.2.2 Maritime Bunkering Ltd
- 16.2.2.1. Overview
- 16.2.2.2. Products
- 16.2.2.3. SWOT Analysis
- 16.2.2.4. Recent Developments
- 16.2.2.5. Financials (Based on Availability)
- 16.2.3 GB Oils Ltd
- 16.2.3.1. Overview
- 16.2.3.2. Products
- 16.2.3.3. SWOT Analysis
- 16.2.3.4. Recent Developments
- 16.2.3.5. Financials (Based on Availability)
- 16.2.4 Shell Marine Products Ltd
- 16.2.4.1. Overview
- 16.2.4.2. Products
- 16.2.4.3. SWOT Analysis
- 16.2.4.4. Recent Developments
- 16.2.4.5. Financials (Based on Availability)
- 16.2.5 Exxon Mobil Corporation
- 16.2.5.1. Overview
- 16.2.5.2. Products
- 16.2.5.3. SWOT Analysis
- 16.2.5.4. Recent Developments
- 16.2.5.5. Financials (Based on Availability)
- 16.2.6 Mærsk A/S
- 16.2.6.1. Overview
- 16.2.6.2. Products
- 16.2.6.3. SWOT Analysis
- 16.2.6.4. Recent Developments
- 16.2.6.5. Financials (Based on Availability)
- 16.2.7 ConocoPhillips Ltd
- 16.2.7.1. Overview
- 16.2.7.2. Products
- 16.2.7.3. SWOT Analysis
- 16.2.7.4. Recent Developments
- 16.2.7.5. Financials (Based on Availability)
- 16.2.8 Greenergy International Ltd
- 16.2.8.1. Overview
- 16.2.8.2. Products
- 16.2.8.3. SWOT Analysis
- 16.2.8.4. Recent Developments
- 16.2.8.5. Financials (Based on Availability)
- 16.2.9 Rosneft Marine UK Ltd *List Not Exhaustive
- 16.2.9.1. Overview
- 16.2.9.2. Products
- 16.2.9.3. SWOT Analysis
- 16.2.9.4. Recent Developments
- 16.2.9.5. Financials (Based on Availability)
- 16.2.10 BP PLC
- 16.2.10.1. Overview
- 16.2.10.2. Products
- 16.2.10.3. SWOT Analysis
- 16.2.10.4. Recent Developments
- 16.2.10.5. Financials (Based on Availability)
- 16.2.11 Henty Oil Ltd
- 16.2.11.1. Overview
- 16.2.11.2. Products
- 16.2.11.3. SWOT Analysis
- 16.2.11.4. Recent Developments
- 16.2.11.5. Financials (Based on Availability)
- 16.2.1 Phillips 66
List of Figures
- Figure 1: Global UK Bunker Fuel Industry Revenue Breakdown (Million, %) by Region 2024 & 2032
- Figure 2: Global UK Bunker Fuel Industry Volume Breakdown (K Tons, %) by Region 2024 & 2032
- Figure 3: United kingdom Region UK Bunker Fuel Industry Revenue (Million), by Country 2024 & 2032
- Figure 4: United kingdom Region UK Bunker Fuel Industry Volume (K Tons), by Country 2024 & 2032
- Figure 5: United kingdom Region UK Bunker Fuel Industry Revenue Share (%), by Country 2024 & 2032
- Figure 6: United kingdom Region UK Bunker Fuel Industry Volume Share (%), by Country 2024 & 2032
- Figure 7: North America UK Bunker Fuel Industry Revenue (Million), by Type 2024 & 2032
- Figure 8: North America UK Bunker Fuel Industry Volume (K Tons), by Type 2024 & 2032
- Figure 9: North America UK Bunker Fuel Industry Revenue Share (%), by Type 2024 & 2032
- Figure 10: North America UK Bunker Fuel Industry Volume Share (%), by Type 2024 & 2032
- Figure 11: North America UK Bunker Fuel Industry Revenue (Million), by Vessel Type 2024 & 2032
- Figure 12: North America UK Bunker Fuel Industry Volume (K Tons), by Vessel Type 2024 & 2032
- Figure 13: North America UK Bunker Fuel Industry Revenue Share (%), by Vessel Type 2024 & 2032
- Figure 14: North America UK Bunker Fuel Industry Volume Share (%), by Vessel Type 2024 & 2032
- Figure 15: North America UK Bunker Fuel Industry Revenue (Million), by Country 2024 & 2032
- Figure 16: North America UK Bunker Fuel Industry Volume (K Tons), by Country 2024 & 2032
- Figure 17: North America UK Bunker Fuel Industry Revenue Share (%), by Country 2024 & 2032
- Figure 18: North America UK Bunker Fuel Industry Volume Share (%), by Country 2024 & 2032
- Figure 19: South America UK Bunker Fuel Industry Revenue (Million), by Type 2024 & 2032
- Figure 20: South America UK Bunker Fuel Industry Volume (K Tons), by Type 2024 & 2032
- Figure 21: South America UK Bunker Fuel Industry Revenue Share (%), by Type 2024 & 2032
- Figure 22: South America UK Bunker Fuel Industry Volume Share (%), by Type 2024 & 2032
- Figure 23: South America UK Bunker Fuel Industry Revenue (Million), by Vessel Type 2024 & 2032
- Figure 24: South America UK Bunker Fuel Industry Volume (K Tons), by Vessel Type 2024 & 2032
- Figure 25: South America UK Bunker Fuel Industry Revenue Share (%), by Vessel Type 2024 & 2032
- Figure 26: South America UK Bunker Fuel Industry Volume Share (%), by Vessel Type 2024 & 2032
- Figure 27: South America UK Bunker Fuel Industry Revenue (Million), by Country 2024 & 2032
- Figure 28: South America UK Bunker Fuel Industry Volume (K Tons), by Country 2024 & 2032
- Figure 29: South America UK Bunker Fuel Industry Revenue Share (%), by Country 2024 & 2032
- Figure 30: South America UK Bunker Fuel Industry Volume Share (%), by Country 2024 & 2032
- Figure 31: Europe UK Bunker Fuel Industry Revenue (Million), by Type 2024 & 2032
- Figure 32: Europe UK Bunker Fuel Industry Volume (K Tons), by Type 2024 & 2032
- Figure 33: Europe UK Bunker Fuel Industry Revenue Share (%), by Type 2024 & 2032
- Figure 34: Europe UK Bunker Fuel Industry Volume Share (%), by Type 2024 & 2032
- Figure 35: Europe UK Bunker Fuel Industry Revenue (Million), by Vessel Type 2024 & 2032
- Figure 36: Europe UK Bunker Fuel Industry Volume (K Tons), by Vessel Type 2024 & 2032
- Figure 37: Europe UK Bunker Fuel Industry Revenue Share (%), by Vessel Type 2024 & 2032
- Figure 38: Europe UK Bunker Fuel Industry Volume Share (%), by Vessel Type 2024 & 2032
- Figure 39: Europe UK Bunker Fuel Industry Revenue (Million), by Country 2024 & 2032
- Figure 40: Europe UK Bunker Fuel Industry Volume (K Tons), by Country 2024 & 2032
- Figure 41: Europe UK Bunker Fuel Industry Revenue Share (%), by Country 2024 & 2032
- Figure 42: Europe UK Bunker Fuel Industry Volume Share (%), by Country 2024 & 2032
- Figure 43: Middle East & Africa UK Bunker Fuel Industry Revenue (Million), by Type 2024 & 2032
- Figure 44: Middle East & Africa UK Bunker Fuel Industry Volume (K Tons), by Type 2024 & 2032
- Figure 45: Middle East & Africa UK Bunker Fuel Industry Revenue Share (%), by Type 2024 & 2032
- Figure 46: Middle East & Africa UK Bunker Fuel Industry Volume Share (%), by Type 2024 & 2032
- Figure 47: Middle East & Africa UK Bunker Fuel Industry Revenue (Million), by Vessel Type 2024 & 2032
- Figure 48: Middle East & Africa UK Bunker Fuel Industry Volume (K Tons), by Vessel Type 2024 & 2032
- Figure 49: Middle East & Africa UK Bunker Fuel Industry Revenue Share (%), by Vessel Type 2024 & 2032
- Figure 50: Middle East & Africa UK Bunker Fuel Industry Volume Share (%), by Vessel Type 2024 & 2032
- Figure 51: Middle East & Africa UK Bunker Fuel Industry Revenue (Million), by Country 2024 & 2032
- Figure 52: Middle East & Africa UK Bunker Fuel Industry Volume (K Tons), by Country 2024 & 2032
- Figure 53: Middle East & Africa UK Bunker Fuel Industry Revenue Share (%), by Country 2024 & 2032
- Figure 54: Middle East & Africa UK Bunker Fuel Industry Volume Share (%), by Country 2024 & 2032
- Figure 55: Asia Pacific UK Bunker Fuel Industry Revenue (Million), by Type 2024 & 2032
- Figure 56: Asia Pacific UK Bunker Fuel Industry Volume (K Tons), by Type 2024 & 2032
- Figure 57: Asia Pacific UK Bunker Fuel Industry Revenue Share (%), by Type 2024 & 2032
- Figure 58: Asia Pacific UK Bunker Fuel Industry Volume Share (%), by Type 2024 & 2032
- Figure 59: Asia Pacific UK Bunker Fuel Industry Revenue (Million), by Vessel Type 2024 & 2032
- Figure 60: Asia Pacific UK Bunker Fuel Industry Volume (K Tons), by Vessel Type 2024 & 2032
- Figure 61: Asia Pacific UK Bunker Fuel Industry Revenue Share (%), by Vessel Type 2024 & 2032
- Figure 62: Asia Pacific UK Bunker Fuel Industry Volume Share (%), by Vessel Type 2024 & 2032
- Figure 63: Asia Pacific UK Bunker Fuel Industry Revenue (Million), by Country 2024 & 2032
- Figure 64: Asia Pacific UK Bunker Fuel Industry Volume (K Tons), by Country 2024 & 2032
- Figure 65: Asia Pacific UK Bunker Fuel Industry Revenue Share (%), by Country 2024 & 2032
- Figure 66: Asia Pacific UK Bunker Fuel Industry Volume Share (%), by Country 2024 & 2032
List of Tables
- Table 1: Global UK Bunker Fuel Industry Revenue Million Forecast, by Region 2019 & 2032
- Table 2: Global UK Bunker Fuel Industry Volume K Tons Forecast, by Region 2019 & 2032
- Table 3: Global UK Bunker Fuel Industry Revenue Million Forecast, by Type 2019 & 2032
- Table 4: Global UK Bunker Fuel Industry Volume K Tons Forecast, by Type 2019 & 2032
- Table 5: Global UK Bunker Fuel Industry Revenue Million Forecast, by Vessel Type 2019 & 2032
- Table 6: Global UK Bunker Fuel Industry Volume K Tons Forecast, by Vessel Type 2019 & 2032
- Table 7: Global UK Bunker Fuel Industry Revenue Million Forecast, by Region 2019 & 2032
- Table 8: Global UK Bunker Fuel Industry Volume K Tons Forecast, by Region 2019 & 2032
- Table 9: Global UK Bunker Fuel Industry Revenue Million Forecast, by Country 2019 & 2032
- Table 10: Global UK Bunker Fuel Industry Volume K Tons Forecast, by Country 2019 & 2032
- Table 11: England UK Bunker Fuel Industry Revenue (Million) Forecast, by Application 2019 & 2032
- Table 12: England UK Bunker Fuel Industry Volume (K Tons) Forecast, by Application 2019 & 2032
- Table 13: Wales UK Bunker Fuel Industry Revenue (Million) Forecast, by Application 2019 & 2032
- Table 14: Wales UK Bunker Fuel Industry Volume (K Tons) Forecast, by Application 2019 & 2032
- Table 15: Scotland UK Bunker Fuel Industry Revenue (Million) Forecast, by Application 2019 & 2032
- Table 16: Scotland UK Bunker Fuel Industry Volume (K Tons) Forecast, by Application 2019 & 2032
- Table 17: Northern UK Bunker Fuel Industry Revenue (Million) Forecast, by Application 2019 & 2032
- Table 18: Northern UK Bunker Fuel Industry Volume (K Tons) Forecast, by Application 2019 & 2032
- Table 19: Ireland UK Bunker Fuel Industry Revenue (Million) Forecast, by Application 2019 & 2032
- Table 20: Ireland UK Bunker Fuel Industry Volume (K Tons) Forecast, by Application 2019 & 2032
- Table 21: Global UK Bunker Fuel Industry Revenue Million Forecast, by Type 2019 & 2032
- Table 22: Global UK Bunker Fuel Industry Volume K Tons Forecast, by Type 2019 & 2032
- Table 23: Global UK Bunker Fuel Industry Revenue Million Forecast, by Vessel Type 2019 & 2032
- Table 24: Global UK Bunker Fuel Industry Volume K Tons Forecast, by Vessel Type 2019 & 2032
- Table 25: Global UK Bunker Fuel Industry Revenue Million Forecast, by Country 2019 & 2032
- Table 26: Global UK Bunker Fuel Industry Volume K Tons Forecast, by Country 2019 & 2032
- Table 27: United States UK Bunker Fuel Industry Revenue (Million) Forecast, by Application 2019 & 2032
- Table 28: United States UK Bunker Fuel Industry Volume (K Tons) Forecast, by Application 2019 & 2032
- Table 29: Canada UK Bunker Fuel Industry Revenue (Million) Forecast, by Application 2019 & 2032
- Table 30: Canada UK Bunker Fuel Industry Volume (K Tons) Forecast, by Application 2019 & 2032
- Table 31: Mexico UK Bunker Fuel Industry Revenue (Million) Forecast, by Application 2019 & 2032
- Table 32: Mexico UK Bunker Fuel Industry Volume (K Tons) Forecast, by Application 2019 & 2032
- Table 33: Global UK Bunker Fuel Industry Revenue Million Forecast, by Type 2019 & 2032
- Table 34: Global UK Bunker Fuel Industry Volume K Tons Forecast, by Type 2019 & 2032
- Table 35: Global UK Bunker Fuel Industry Revenue Million Forecast, by Vessel Type 2019 & 2032
- Table 36: Global UK Bunker Fuel Industry Volume K Tons Forecast, by Vessel Type 2019 & 2032
- Table 37: Global UK Bunker Fuel Industry Revenue Million Forecast, by Country 2019 & 2032
- Table 38: Global UK Bunker Fuel Industry Volume K Tons Forecast, by Country 2019 & 2032
- Table 39: Brazil UK Bunker Fuel Industry Revenue (Million) Forecast, by Application 2019 & 2032
- Table 40: Brazil UK Bunker Fuel Industry Volume (K Tons) Forecast, by Application 2019 & 2032
- Table 41: Argentina UK Bunker Fuel Industry Revenue (Million) Forecast, by Application 2019 & 2032
- Table 42: Argentina UK Bunker Fuel Industry Volume (K Tons) Forecast, by Application 2019 & 2032
- Table 43: Rest of South America UK Bunker Fuel Industry Revenue (Million) Forecast, by Application 2019 & 2032
- Table 44: Rest of South America UK Bunker Fuel Industry Volume (K Tons) Forecast, by Application 2019 & 2032
- Table 45: Global UK Bunker Fuel Industry Revenue Million Forecast, by Type 2019 & 2032
- Table 46: Global UK Bunker Fuel Industry Volume K Tons Forecast, by Type 2019 & 2032
- Table 47: Global UK Bunker Fuel Industry Revenue Million Forecast, by Vessel Type 2019 & 2032
- Table 48: Global UK Bunker Fuel Industry Volume K Tons Forecast, by Vessel Type 2019 & 2032
- Table 49: Global UK Bunker Fuel Industry Revenue Million Forecast, by Country 2019 & 2032
- Table 50: Global UK Bunker Fuel Industry Volume K Tons Forecast, by Country 2019 & 2032
- Table 51: United Kingdom UK Bunker Fuel Industry Revenue (Million) Forecast, by Application 2019 & 2032
- Table 52: United Kingdom UK Bunker Fuel Industry Volume (K Tons) Forecast, by Application 2019 & 2032
- Table 53: Germany UK Bunker Fuel Industry Revenue (Million) Forecast, by Application 2019 & 2032
- Table 54: Germany UK Bunker Fuel Industry Volume (K Tons) Forecast, by Application 2019 & 2032
- Table 55: France UK Bunker Fuel Industry Revenue (Million) Forecast, by Application 2019 & 2032
- Table 56: France UK Bunker Fuel Industry Volume (K Tons) Forecast, by Application 2019 & 2032
- Table 57: Italy UK Bunker Fuel Industry Revenue (Million) Forecast, by Application 2019 & 2032
- Table 58: Italy UK Bunker Fuel Industry Volume (K Tons) Forecast, by Application 2019 & 2032
- Table 59: Spain UK Bunker Fuel Industry Revenue (Million) Forecast, by Application 2019 & 2032
- Table 60: Spain UK Bunker Fuel Industry Volume (K Tons) Forecast, by Application 2019 & 2032
- Table 61: Russia UK Bunker Fuel Industry Revenue (Million) Forecast, by Application 2019 & 2032
- Table 62: Russia UK Bunker Fuel Industry Volume (K Tons) Forecast, by Application 2019 & 2032
- Table 63: Benelux UK Bunker Fuel Industry Revenue (Million) Forecast, by Application 2019 & 2032
- Table 64: Benelux UK Bunker Fuel Industry Volume (K Tons) Forecast, by Application 2019 & 2032
- Table 65: Nordics UK Bunker Fuel Industry Revenue (Million) Forecast, by Application 2019 & 2032
- Table 66: Nordics UK Bunker Fuel Industry Volume (K Tons) Forecast, by Application 2019 & 2032
- Table 67: Rest of Europe UK Bunker Fuel Industry Revenue (Million) Forecast, by Application 2019 & 2032
- Table 68: Rest of Europe UK Bunker Fuel Industry Volume (K Tons) Forecast, by Application 2019 & 2032
- Table 69: Global UK Bunker Fuel Industry Revenue Million Forecast, by Type 2019 & 2032
- Table 70: Global UK Bunker Fuel Industry Volume K Tons Forecast, by Type 2019 & 2032
- Table 71: Global UK Bunker Fuel Industry Revenue Million Forecast, by Vessel Type 2019 & 2032
- Table 72: Global UK Bunker Fuel Industry Volume K Tons Forecast, by Vessel Type 2019 & 2032
- Table 73: Global UK Bunker Fuel Industry Revenue Million Forecast, by Country 2019 & 2032
- Table 74: Global UK Bunker Fuel Industry Volume K Tons Forecast, by Country 2019 & 2032
- Table 75: Turkey UK Bunker Fuel Industry Revenue (Million) Forecast, by Application 2019 & 2032
- Table 76: Turkey UK Bunker Fuel Industry Volume (K Tons) Forecast, by Application 2019 & 2032
- Table 77: Israel UK Bunker Fuel Industry Revenue (Million) Forecast, by Application 2019 & 2032
- Table 78: Israel UK Bunker Fuel Industry Volume (K Tons) Forecast, by Application 2019 & 2032
- Table 79: GCC UK Bunker Fuel Industry Revenue (Million) Forecast, by Application 2019 & 2032
- Table 80: GCC UK Bunker Fuel Industry Volume (K Tons) Forecast, by Application 2019 & 2032
- Table 81: North Africa UK Bunker Fuel Industry Revenue (Million) Forecast, by Application 2019 & 2032
- Table 82: North Africa UK Bunker Fuel Industry Volume (K Tons) Forecast, by Application 2019 & 2032
- Table 83: South Africa UK Bunker Fuel Industry Revenue (Million) Forecast, by Application 2019 & 2032
- Table 84: South Africa UK Bunker Fuel Industry Volume (K Tons) Forecast, by Application 2019 & 2032
- Table 85: Rest of Middle East & Africa UK Bunker Fuel Industry Revenue (Million) Forecast, by Application 2019 & 2032
- Table 86: Rest of Middle East & Africa UK Bunker Fuel Industry Volume (K Tons) Forecast, by Application 2019 & 2032
- Table 87: Global UK Bunker Fuel Industry Revenue Million Forecast, by Type 2019 & 2032
- Table 88: Global UK Bunker Fuel Industry Volume K Tons Forecast, by Type 2019 & 2032
- Table 89: Global UK Bunker Fuel Industry Revenue Million Forecast, by Vessel Type 2019 & 2032
- Table 90: Global UK Bunker Fuel Industry Volume K Tons Forecast, by Vessel Type 2019 & 2032
- Table 91: Global UK Bunker Fuel Industry Revenue Million Forecast, by Country 2019 & 2032
- Table 92: Global UK Bunker Fuel Industry Volume K Tons Forecast, by Country 2019 & 2032
- Table 93: China UK Bunker Fuel Industry Revenue (Million) Forecast, by Application 2019 & 2032
- Table 94: China UK Bunker Fuel Industry Volume (K Tons) Forecast, by Application 2019 & 2032
- Table 95: India UK Bunker Fuel Industry Revenue (Million) Forecast, by Application 2019 & 2032
- Table 96: India UK Bunker Fuel Industry Volume (K Tons) Forecast, by Application 2019 & 2032
- Table 97: Japan UK Bunker Fuel Industry Revenue (Million) Forecast, by Application 2019 & 2032
- Table 98: Japan UK Bunker Fuel Industry Volume (K Tons) Forecast, by Application 2019 & 2032
- Table 99: South Korea UK Bunker Fuel Industry Revenue (Million) Forecast, by Application 2019 & 2032
- Table 100: South Korea UK Bunker Fuel Industry Volume (K Tons) Forecast, by Application 2019 & 2032
- Table 101: ASEAN UK Bunker Fuel Industry Revenue (Million) Forecast, by Application 2019 & 2032
- Table 102: ASEAN UK Bunker Fuel Industry Volume (K Tons) Forecast, by Application 2019 & 2032
- Table 103: Oceania UK Bunker Fuel Industry Revenue (Million) Forecast, by Application 2019 & 2032
- Table 104: Oceania UK Bunker Fuel Industry Volume (K Tons) Forecast, by Application 2019 & 2032
- Table 105: Rest of Asia Pacific UK Bunker Fuel Industry Revenue (Million) Forecast, by Application 2019 & 2032
- Table 106: Rest of Asia Pacific UK Bunker Fuel Industry Volume (K Tons) Forecast, by Application 2019 & 2032
Frequently Asked Questions
1. What is the projected Compound Annual Growth Rate (CAGR) of the UK Bunker Fuel Industry?
The projected CAGR is approximately > 14.00%.
2. Which companies are prominent players in the UK Bunker Fuel Industry?
Key companies in the market include Phillips 66, Maritime Bunkering Ltd, GB Oils Ltd, Shell Marine Products Ltd, Exxon Mobil Corporation, Mærsk A/S, ConocoPhillips Ltd, Greenergy International Ltd, Rosneft Marine UK Ltd *List Not Exhaustive, BP PLC, Henty Oil Ltd.
3. What are the main segments of the UK Bunker Fuel Industry?
The market segments include Type, Vessel Type.
4. Can you provide details about the market size?
The market size is estimated to be USD 7860 Million as of 2022.
5. What are some drivers contributing to market growth?
4.; Increasing Demand for Petroleum Products Due to the Growth of the Local Economy4.; Government Initiatives to Boost the Production of Crude Oil and Natural Gas.
6. What are the notable trends driving market growth?
Very Low Sulphur Fuel Oil (VLSFO) to Witness Significant Growth.
7. Are there any restraints impacting market growth?
4.; Increasing Adoption of Renewable Energy.
8. Can you provide examples of recent developments in the market?
Investments in LNG bunkering infrastructure and partnerships
9. What pricing options are available for accessing the report?
Pricing options include single-user, multi-user, and enterprise licenses priced at USD 3800, USD 4500, and USD 5800 respectively.
10. Is the market size provided in terms of value or volume?
The market size is provided in terms of value, measured in Million and volume, measured in K Tons.
11. Are there any specific market keywords associated with the report?
Yes, the market keyword associated with the report is "UK Bunker Fuel Industry," which aids in identifying and referencing the specific market segment covered.
12. How do I determine which pricing option suits my needs best?
The pricing options vary based on user requirements and access needs. Individual users may opt for single-user licenses, while businesses requiring broader access may choose multi-user or enterprise licenses for cost-effective access to the report.
13. Are there any additional resources or data provided in the UK Bunker Fuel Industry report?
While the report offers comprehensive insights, it's advisable to review the specific contents or supplementary materials provided to ascertain if additional resources or data are available.
14. How can I stay updated on further developments or reports in the UK Bunker Fuel Industry?
To stay informed about further developments, trends, and reports in the UK Bunker Fuel Industry, consider subscribing to industry newsletters, following relevant companies and organizations, or regularly checking reputable industry news sources and publications.
Methodology
Step 1 - Identification of Relevant Samples Size from Population Database


Step 2 - Approaches for Defining Global Market Size (Value, Volume* & Price*)

Note*: In applicable scenarios
Step 3 - Data Sources
Primary Research
- Web Analytics
- Survey Reports
- Research Institute
- Latest Research Reports
- Opinion Leaders
Secondary Research
- Annual Reports
- White Paper
- Latest Press Release
- Industry Association
- Paid Database
- Investor Presentations

Step 4 - Data Triangulation
Involves using different sources of information in order to increase the validity of a study
These sources are likely to be stakeholders in a program - participants, other researchers, program staff, other community members, and so on.
Then we put all data in single framework & apply various statistical tools to find out the dynamic on the market.
During the analysis stage, feedback from the stakeholder groups would be compared to determine areas of agreement as well as areas of divergence


