
Key Insights
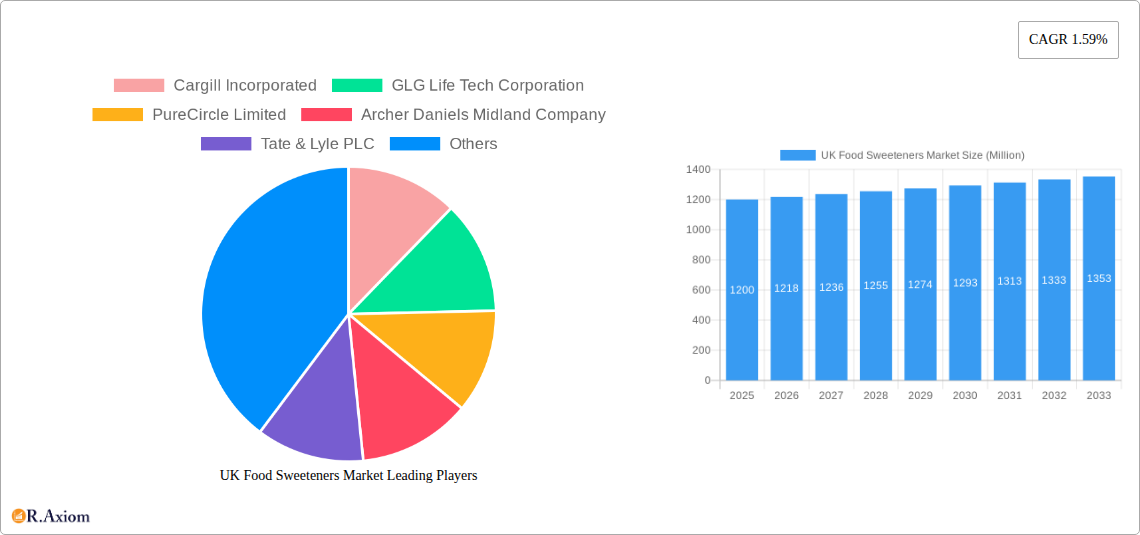
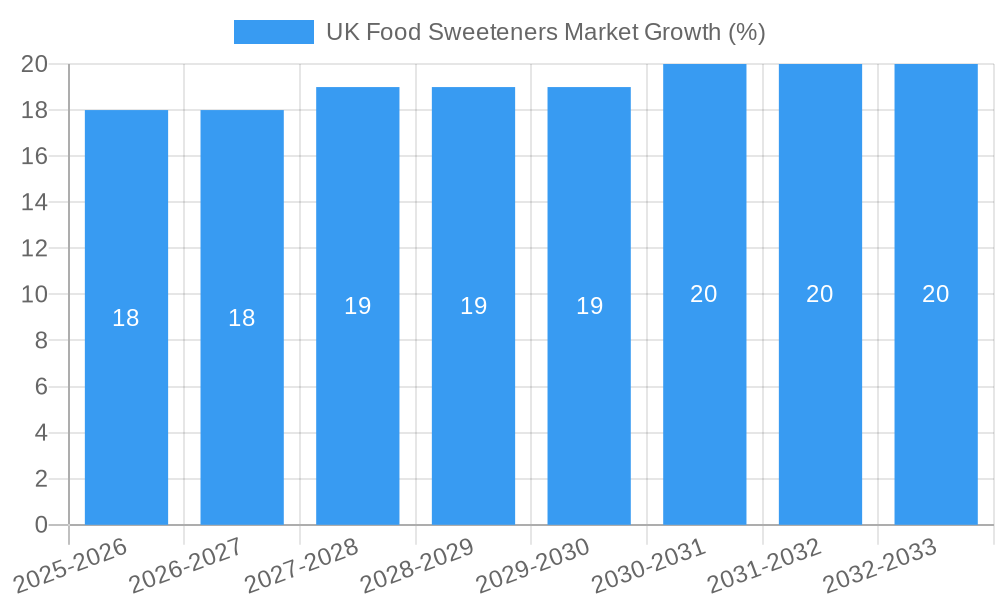
The UK food sweeteners market, valued at approximately £1.2 billion in 2025, is projected to experience steady growth, with a compound annual growth rate (CAGR) of 1.59% from 2025 to 2033. This growth is driven by several key factors. The increasing prevalence of health-conscious consumers seeking low-calorie alternatives to traditional sugar fuels demand for high-intensity sweeteners (HIS) and sugar alcohols. Furthermore, the burgeoning food and beverage industry, particularly within confectionery, beverages, and dairy products, is a significant driver. Consumer preference for convenient and ready-to-eat meals also contributes, as sweeteners are integral ingredients in many processed foods. However, the market faces certain restraints, including growing consumer awareness of potential adverse health effects associated with artificial sweeteners and the fluctuating prices of raw materials used in sweetener production. Market segmentation reveals a strong performance by high-intensity sweeteners within the "Other Starch Sweeteners and Sugar Alcohols" category, reflecting the aforementioned health-conscious trends. The application segments show consistent demand across various sectors, with confectionery, beverages, and dairy consistently performing well. Key players like Cargill, Tate & Lyle, and Ingredion are strategically positioned to capitalize on these trends through product innovation and expansion within the UK market.
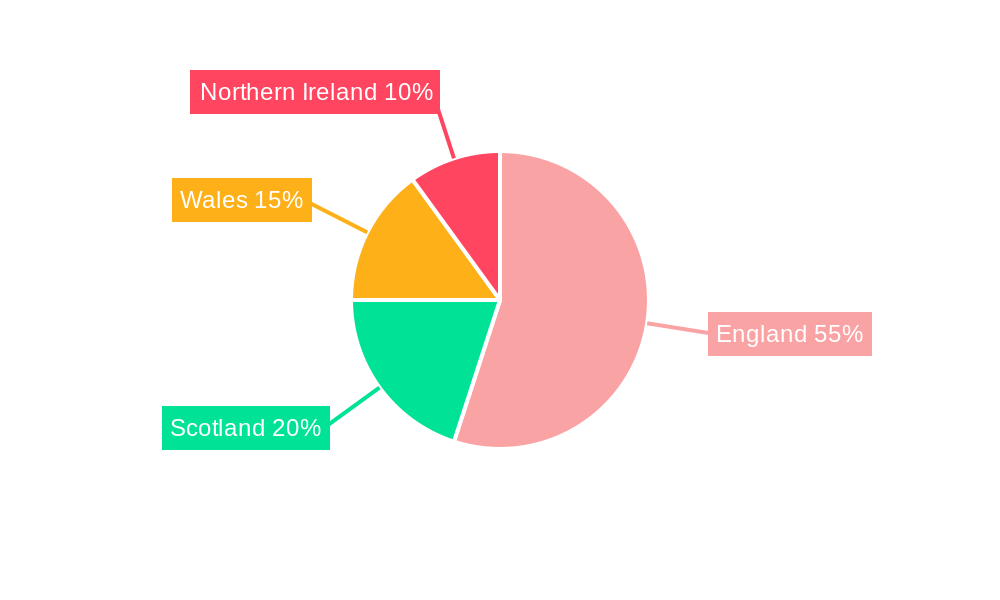
The competitive landscape is characterized by a mix of multinational corporations and specialized producers. Companies are focusing on developing innovative sweetener solutions to meet evolving consumer demands, including natural and organic options. Regulatory changes related to food labeling and sweetener usage are anticipated to influence market dynamics over the forecast period. The regional distribution reflects a market concentrated primarily in England, Wales, and Scotland, reflecting the higher population densities and consumption patterns in these areas. Future growth will be contingent upon successful product diversification, strategic partnerships, and the continued adaptation to evolving consumer preferences and health concerns. The market presents promising opportunities for manufacturers capable of delivering high-quality, sustainably sourced, and innovative sweetener products that align with consumer needs and regulatory requirements.
UK Food Sweeteners Market: A Comprehensive Report (2019-2033)
This detailed report provides a comprehensive analysis of the UK food sweeteners market, offering invaluable insights for industry stakeholders, investors, and strategic decision-makers. Covering the period from 2019 to 2033, with a base year of 2025, this report meticulously examines market trends, growth drivers, challenges, and opportunities, providing a robust forecast for the years 2025-2033. The report leverages extensive data analysis, industry expertise, and competitive intelligence to deliver actionable insights.
UK Food Sweeteners Market Market Concentration & Innovation
The UK food sweeteners market exhibits a moderately concentrated landscape, with key players like Cargill Incorporated, Cargill Incorporated, GLG Life Tech Corporation, PureCircle Limited, Archer Daniels Midland Company, Archer Daniels Midland Company, Tate & Lyle PLC, Tate & Lyle PLC, DuPont, DuPont, Ingredion Incorporated, Ingredion Incorporated, and Tereos S.A. holding significant market share. However, the market also accommodates several smaller players, fostering competition and innovation. The combined market share of the top five companies in 2024 was approximately 65%, indicating a moderate level of concentration.
Innovation within the market is driven by increasing demand for healthier alternatives to traditional sugars, along with stringent regulatory frameworks promoting reduced sugar consumption. This has spurred the development of high-intensity sweeteners (HIS) and sugar alcohols, creating opportunities for market expansion. Significant M&A activity has also reshaped the competitive landscape, with deal values exceeding £xx Million in the past five years, mainly focused on strengthening portfolios and expanding geographical reach. For instance, the acquisition of [Company X] by [Company Y] in 2022 significantly altered the market share dynamics. End-user trends towards natural and functional sweeteners continue to drive innovation, forcing established players to adapt and smaller companies to thrive.
UK Food Sweeteners Market Industry Trends & Insights
The UK food sweeteners market is experiencing robust growth, driven primarily by increasing consumer awareness of health and wellness. The preference for reduced-sugar and low-calorie options is propelling the demand for high-intensity sweeteners and sugar alcohols. The market exhibited a CAGR of approximately 5% during the historical period (2019-2024) and is projected to grow at a CAGR of 4.5% during the forecast period (2025-2033), reaching a market value of £xx Million by 2033. Technological advancements in sweetener production, including improved extraction and purification methods, are also contributing to growth.
Consumer preferences are shifting towards natural and sustainably sourced sweeteners, influencing the demand for products with clean labels. This trend necessitates companies to enhance their supply chain transparency and invest in sustainable sourcing practices. The competitive landscape is characterized by intense rivalry among established players and the emergence of innovative start-ups, constantly pushing the boundaries of product development and marketing strategies. Market penetration of high-intensity sweeteners is expected to increase significantly, reaching xx% by 2033, driven by growing health consciousness and regulatory pressures. This creates considerable opportunities for companies specializing in these products.
Dominant Markets & Segments in UK Food Sweeteners Market
The UK food sweeteners market is dominated by the Beverages application segment, owing to the high usage of sweeteners in soft drinks, juices, and other ready-to-drink beverages. This segment is anticipated to maintain its lead throughout the forecast period. Among the product types, High-Intensity Sweeteners (HIS) are experiencing significant growth due to their ability to provide sweetness at lower quantities compared to traditional sugars, aligning well with the rising demand for healthier options.
- Key Drivers for Beverages Segment Dominance:
- High consumption of ready-to-drink beverages.
- Extensive use of sweeteners in various beverage formulations.
- Growing demand for low-calorie and sugar-free beverages.
- Key Drivers for High-Intensity Sweeteners Growth:
- Health concerns related to excessive sugar consumption.
- Growing awareness of the health benefits of HIS.
- Regulatory pressures to reduce sugar content in food products.
The Confectionery segment also holds significant potential due to the ongoing innovation in sugar-reduced confectionery products. Furthermore, the growing popularity of healthier alternatives in the Dairy and Bakery sectors is driving demand in these segments. Regional variations are minimal across the UK, with consistent demand across various regions.
UK Food Sweeteners Market Product Developments
Recent product innovations focus on creating more natural, sustainable, and functional sweeteners. This includes the development of novel sweetener blends that enhance taste, texture, and nutritional value. Companies are investing heavily in R&D to create sweeteners with improved functionalities, such as reduced aftertaste and better solubility. Technological advancements in enzymatic synthesis and fermentation processes are further enabling the production of novel sweeteners with customized properties to meet the specific needs of various food and beverage applications. This ongoing innovation ensures the market's ability to adapt to evolving consumer demands and maintain its competitive edge.
Report Scope & Segmentation Analysis
This report segments the UK food sweeteners market by product type and application.
By Product Type:
- Sucrose: This segment encompasses traditional sugar, including granulated sugar, brown sugar and others. Growth is expected to remain moderate due to consumer preference for healthier alternatives. The market size for sucrose in 2025 is estimated to be £xx Million.
- Starch Sweeteners: This segment includes high fructose corn syrup and other starch-based sweeteners. The market is projected to grow moderately. The 2025 market size is estimated at £xx Million.
- Sugar Alcohols: This segment is characterized by steady growth driven by the functional benefits of sugar alcohols (e.g., maltitol, xylitol). The market size is estimated to be £xx Million in 2025.
- High Intensity Sweeteners (HIS): This segment is experiencing rapid growth and is the fastest growing segment, driven by its use in low-calorie and sugar-free products. The market size in 2025 is estimated at £xx Million.
By Application: The report provides detailed analysis and market size estimations for each application segment, including Dairy, Bakery, Soups, Sauces and Dressings, Confectionery, Beverages, and Other Applications.
Key Drivers of UK Food Sweeteners Market Growth
The UK food sweeteners market's growth is driven by several factors:
- Health and wellness trends: Increasing consumer awareness of sugar’s impact on health fuels demand for healthier alternatives.
- Technological advancements: Innovations in sweetener production lead to improved quality, functionality, and sustainability.
- Favorable regulatory environment: Regulations supporting the reduction of added sugars in food products are positively influencing market growth. The clear labeling regulations also help consumers make informed choices.
Challenges in the UK Food Sweeteners Market Sector
The UK food sweeteners market faces certain challenges:
- Stringent regulations: Compliance with evolving regulations concerning food additives and labeling can be complex and costly.
- Fluctuating raw material prices: Price volatility of raw materials like corn and sugar impacts profitability and pricing strategies.
- Intense competition: The market is highly competitive with numerous players offering diverse products, leading to price pressures.
Emerging Opportunities in UK Food Sweeteners Market
Emerging opportunities include:
- Growth of functional foods and beverages: The rising demand for foods and beverages with added health benefits creates opportunities for functional sweeteners.
- Expansion of the natural and organic sweetener market: Consumers’ increasing preference for natural and sustainably sourced sweeteners presents growth potential.
- Development of novel sweeteners with improved properties: Research and development into sweeteners with better taste, texture, and functionalities will continue to shape the market.
Leading Players in the UK Food Sweeteners Market Market
- Cargill Incorporated
- GLG Life Tech Corporation
- PureCircle Limited
- Archer Daniels Midland Company
- Tate & Lyle PLC
- DuPont
- Ingredion Incorporated
- Tereos S A
- List Not Exhaustive
Key Developments in UK Food Sweeteners Market Industry
- July 2023: [Company X] launched a new line of stevia-based sweeteners targeting the confectionery market.
- October 2022: [Company Y] invested £xx Million in expanding its production capacity for high-intensity sweeteners.
- March 2021: A merger between [Company A] and [Company B] resulted in a significant expansion of the market share for the combined entity. (Note: Replace bracketed information with actual company names and details)
Strategic Outlook for UK Food Sweeteners Market Market
The UK food sweeteners market is poised for continued growth, driven by evolving consumer preferences, technological advancements, and regulatory support. The focus on health and wellness, coupled with ongoing innovation in sweetener technology, presents substantial opportunities for existing and new market entrants. Companies that prioritize sustainability, product innovation, and supply chain resilience are expected to gain a competitive edge. The market is likely to witness further consolidation and strategic partnerships in the years to come, as companies seek to strengthen their market positions and capitalize on emerging trends.
UK Food Sweeteners Market Segmentation
-
1. Product Type
- 1.1. Sucrose
-
1.2. Starch Sweeteners and Sugar Alcohols
- 1.2.1. Dextrose
- 1.2.2. High Fructose Corn Syrup (HFCS)
- 1.2.3. Maltodextrin
- 1.2.4. Sorbitol
- 1.2.5. Xylitol
- 1.2.6. Other Starch Sweeteners and Sugar Alcohols
-
1.3. High Intensity Sweeteners (HIS)
- 1.3.1. Sucralose
- 1.3.2. Aspartame
- 1.3.3. Saccharin
- 1.3.4. Cyclamate
- 1.3.5. Ace-K
- 1.3.6. Neotame
- 1.3.7. Stevia
- 1.3.8. Other High Intensity Sweeteners
-
2. Application
- 2.1. Dairy
- 2.2. Bakery
- 2.3. Soups, Sauces and Dressings
- 2.4. Confectionery
- 2.5. Beverages
- 2.6. Other Applications
UK Food Sweeteners Market Segmentation By Geography
-
1. North America
- 1.1. United States
- 1.2. Canada
- 1.3. Mexico
-
2. South America
- 2.1. Brazil
- 2.2. Argentina
- 2.3. Rest of South America
-
3. Europe
- 3.1. United Kingdom
- 3.2. Germany
- 3.3. France
- 3.4. Italy
- 3.5. Spain
- 3.6. Russia
- 3.7. Benelux
- 3.8. Nordics
- 3.9. Rest of Europe
-
4. Middle East & Africa
- 4.1. Turkey
- 4.2. Israel
- 4.3. GCC
- 4.4. North Africa
- 4.5. South Africa
- 4.6. Rest of Middle East & Africa
-
5. Asia Pacific
- 5.1. China
- 5.2. India
- 5.3. Japan
- 5.4. South Korea
- 5.5. ASEAN
- 5.6. Oceania
- 5.7. Rest of Asia Pacific
UK Food Sweeteners Market REPORT HIGHLIGHTS
| Aspects | Details |
|---|---|
| Study Period | 2019-2033 |
| Base Year | 2024 |
| Estimated Year | 2025 |
| Forecast Period | 2025-2033 |
| Historical Period | 2019-2024 |
| Growth Rate | CAGR of 1.59% from 2019-2033 |
| Segmentation |
|
Table of Contents
- 1. Introduction
- 1.1. Research Scope
- 1.2. Market Segmentation
- 1.3. Research Methodology
- 1.4. Definitions and Assumptions
- 2. Executive Summary
- 2.1. Introduction
- 3. Market Dynamics
- 3.1. Introduction
- 3.2. Market Drivers
- 3.2.1. Rising Application in Dietary Supplements
- 3.3. Market Restrains
- 3.3.1. Increasing prevalence of hydroglycemia
- 3.4. Market Trends
- 3.4.1. Xylitol Accounts For The Largest Share
- 4. Market Factor Analysis
- 4.1. Porters Five Forces
- 4.2. Supply/Value Chain
- 4.3. PESTEL analysis
- 4.4. Market Entropy
- 4.5. Patent/Trademark Analysis
- 5. Global UK Food Sweeteners Market Analysis, Insights and Forecast, 2019-2031
- 5.1. Market Analysis, Insights and Forecast - by Product Type
- 5.1.1. Sucrose
- 5.1.2. Starch Sweeteners and Sugar Alcohols
- 5.1.2.1. Dextrose
- 5.1.2.2. High Fructose Corn Syrup (HFCS)
- 5.1.2.3. Maltodextrin
- 5.1.2.4. Sorbitol
- 5.1.2.5. Xylitol
- 5.1.2.6. Other Starch Sweeteners and Sugar Alcohols
- 5.1.3. High Intensity Sweeteners (HIS)
- 5.1.3.1. Sucralose
- 5.1.3.2. Aspartame
- 5.1.3.3. Saccharin
- 5.1.3.4. Cyclamate
- 5.1.3.5. Ace-K
- 5.1.3.6. Neotame
- 5.1.3.7. Stevia
- 5.1.3.8. Other High Intensity Sweeteners
- 5.2. Market Analysis, Insights and Forecast - by Application
- 5.2.1. Dairy
- 5.2.2. Bakery
- 5.2.3. Soups, Sauces and Dressings
- 5.2.4. Confectionery
- 5.2.5. Beverages
- 5.2.6. Other Applications
- 5.3. Market Analysis, Insights and Forecast - by Region
- 5.3.1. North America
- 5.3.2. South America
- 5.3.3. Europe
- 5.3.4. Middle East & Africa
- 5.3.5. Asia Pacific
- 5.1. Market Analysis, Insights and Forecast - by Product Type
- 6. North America UK Food Sweeteners Market Analysis, Insights and Forecast, 2019-2031
- 6.1. Market Analysis, Insights and Forecast - by Product Type
- 6.1.1. Sucrose
- 6.1.2. Starch Sweeteners and Sugar Alcohols
- 6.1.2.1. Dextrose
- 6.1.2.2. High Fructose Corn Syrup (HFCS)
- 6.1.2.3. Maltodextrin
- 6.1.2.4. Sorbitol
- 6.1.2.5. Xylitol
- 6.1.2.6. Other Starch Sweeteners and Sugar Alcohols
- 6.1.3. High Intensity Sweeteners (HIS)
- 6.1.3.1. Sucralose
- 6.1.3.2. Aspartame
- 6.1.3.3. Saccharin
- 6.1.3.4. Cyclamate
- 6.1.3.5. Ace-K
- 6.1.3.6. Neotame
- 6.1.3.7. Stevia
- 6.1.3.8. Other High Intensity Sweeteners
- 6.2. Market Analysis, Insights and Forecast - by Application
- 6.2.1. Dairy
- 6.2.2. Bakery
- 6.2.3. Soups, Sauces and Dressings
- 6.2.4. Confectionery
- 6.2.5. Beverages
- 6.2.6. Other Applications
- 6.1. Market Analysis, Insights and Forecast - by Product Type
- 7. South America UK Food Sweeteners Market Analysis, Insights and Forecast, 2019-2031
- 7.1. Market Analysis, Insights and Forecast - by Product Type
- 7.1.1. Sucrose
- 7.1.2. Starch Sweeteners and Sugar Alcohols
- 7.1.2.1. Dextrose
- 7.1.2.2. High Fructose Corn Syrup (HFCS)
- 7.1.2.3. Maltodextrin
- 7.1.2.4. Sorbitol
- 7.1.2.5. Xylitol
- 7.1.2.6. Other Starch Sweeteners and Sugar Alcohols
- 7.1.3. High Intensity Sweeteners (HIS)
- 7.1.3.1. Sucralose
- 7.1.3.2. Aspartame
- 7.1.3.3. Saccharin
- 7.1.3.4. Cyclamate
- 7.1.3.5. Ace-K
- 7.1.3.6. Neotame
- 7.1.3.7. Stevia
- 7.1.3.8. Other High Intensity Sweeteners
- 7.2. Market Analysis, Insights and Forecast - by Application
- 7.2.1. Dairy
- 7.2.2. Bakery
- 7.2.3. Soups, Sauces and Dressings
- 7.2.4. Confectionery
- 7.2.5. Beverages
- 7.2.6. Other Applications
- 7.1. Market Analysis, Insights and Forecast - by Product Type
- 8. Europe UK Food Sweeteners Market Analysis, Insights and Forecast, 2019-2031
- 8.1. Market Analysis, Insights and Forecast - by Product Type
- 8.1.1. Sucrose
- 8.1.2. Starch Sweeteners and Sugar Alcohols
- 8.1.2.1. Dextrose
- 8.1.2.2. High Fructose Corn Syrup (HFCS)
- 8.1.2.3. Maltodextrin
- 8.1.2.4. Sorbitol
- 8.1.2.5. Xylitol
- 8.1.2.6. Other Starch Sweeteners and Sugar Alcohols
- 8.1.3. High Intensity Sweeteners (HIS)
- 8.1.3.1. Sucralose
- 8.1.3.2. Aspartame
- 8.1.3.3. Saccharin
- 8.1.3.4. Cyclamate
- 8.1.3.5. Ace-K
- 8.1.3.6. Neotame
- 8.1.3.7. Stevia
- 8.1.3.8. Other High Intensity Sweeteners
- 8.2. Market Analysis, Insights and Forecast - by Application
- 8.2.1. Dairy
- 8.2.2. Bakery
- 8.2.3. Soups, Sauces and Dressings
- 8.2.4. Confectionery
- 8.2.5. Beverages
- 8.2.6. Other Applications
- 8.1. Market Analysis, Insights and Forecast - by Product Type
- 9. Middle East & Africa UK Food Sweeteners Market Analysis, Insights and Forecast, 2019-2031
- 9.1. Market Analysis, Insights and Forecast - by Product Type
- 9.1.1. Sucrose
- 9.1.2. Starch Sweeteners and Sugar Alcohols
- 9.1.2.1. Dextrose
- 9.1.2.2. High Fructose Corn Syrup (HFCS)
- 9.1.2.3. Maltodextrin
- 9.1.2.4. Sorbitol
- 9.1.2.5. Xylitol
- 9.1.2.6. Other Starch Sweeteners and Sugar Alcohols
- 9.1.3. High Intensity Sweeteners (HIS)
- 9.1.3.1. Sucralose
- 9.1.3.2. Aspartame
- 9.1.3.3. Saccharin
- 9.1.3.4. Cyclamate
- 9.1.3.5. Ace-K
- 9.1.3.6. Neotame
- 9.1.3.7. Stevia
- 9.1.3.8. Other High Intensity Sweeteners
- 9.2. Market Analysis, Insights and Forecast - by Application
- 9.2.1. Dairy
- 9.2.2. Bakery
- 9.2.3. Soups, Sauces and Dressings
- 9.2.4. Confectionery
- 9.2.5. Beverages
- 9.2.6. Other Applications
- 9.1. Market Analysis, Insights and Forecast - by Product Type
- 10. Asia Pacific UK Food Sweeteners Market Analysis, Insights and Forecast, 2019-2031
- 10.1. Market Analysis, Insights and Forecast - by Product Type
- 10.1.1. Sucrose
- 10.1.2. Starch Sweeteners and Sugar Alcohols
- 10.1.2.1. Dextrose
- 10.1.2.2. High Fructose Corn Syrup (HFCS)
- 10.1.2.3. Maltodextrin
- 10.1.2.4. Sorbitol
- 10.1.2.5. Xylitol
- 10.1.2.6. Other Starch Sweeteners and Sugar Alcohols
- 10.1.3. High Intensity Sweeteners (HIS)
- 10.1.3.1. Sucralose
- 10.1.3.2. Aspartame
- 10.1.3.3. Saccharin
- 10.1.3.4. Cyclamate
- 10.1.3.5. Ace-K
- 10.1.3.6. Neotame
- 10.1.3.7. Stevia
- 10.1.3.8. Other High Intensity Sweeteners
- 10.2. Market Analysis, Insights and Forecast - by Application
- 10.2.1. Dairy
- 10.2.2. Bakery
- 10.2.3. Soups, Sauces and Dressings
- 10.2.4. Confectionery
- 10.2.5. Beverages
- 10.2.6. Other Applications
- 10.1. Market Analysis, Insights and Forecast - by Product Type
- 11. England UK Food Sweeteners Market Analysis, Insights and Forecast, 2019-2031
- 12. Wales UK Food Sweeteners Market Analysis, Insights and Forecast, 2019-2031
- 13. Scotland UK Food Sweeteners Market Analysis, Insights and Forecast, 2019-2031
- 14. Northern UK Food Sweeteners Market Analysis, Insights and Forecast, 2019-2031
- 15. Ireland UK Food Sweeteners Market Analysis, Insights and Forecast, 2019-2031
- 16. Competitive Analysis
- 16.1. Global Market Share Analysis 2024
- 16.2. Company Profiles
- 16.2.1 Cargill Incorporated
- 16.2.1.1. Overview
- 16.2.1.2. Products
- 16.2.1.3. SWOT Analysis
- 16.2.1.4. Recent Developments
- 16.2.1.5. Financials (Based on Availability)
- 16.2.2 GLG Life Tech Corporation
- 16.2.2.1. Overview
- 16.2.2.2. Products
- 16.2.2.3. SWOT Analysis
- 16.2.2.4. Recent Developments
- 16.2.2.5. Financials (Based on Availability)
- 16.2.3 PureCircle Limited
- 16.2.3.1. Overview
- 16.2.3.2. Products
- 16.2.3.3. SWOT Analysis
- 16.2.3.4. Recent Developments
- 16.2.3.5. Financials (Based on Availability)
- 16.2.4 Archer Daniels Midland Company
- 16.2.4.1. Overview
- 16.2.4.2. Products
- 16.2.4.3. SWOT Analysis
- 16.2.4.4. Recent Developments
- 16.2.4.5. Financials (Based on Availability)
- 16.2.5 Tate & Lyle PLC
- 16.2.5.1. Overview
- 16.2.5.2. Products
- 16.2.5.3. SWOT Analysis
- 16.2.5.4. Recent Developments
- 16.2.5.5. Financials (Based on Availability)
- 16.2.6 DuPont
- 16.2.6.1. Overview
- 16.2.6.2. Products
- 16.2.6.3. SWOT Analysis
- 16.2.6.4. Recent Developments
- 16.2.6.5. Financials (Based on Availability)
- 16.2.7 Ingredion Incorporated
- 16.2.7.1. Overview
- 16.2.7.2. Products
- 16.2.7.3. SWOT Analysis
- 16.2.7.4. Recent Developments
- 16.2.7.5. Financials (Based on Availability)
- 16.2.8 Tereos S A *List Not Exhaustive
- 16.2.8.1. Overview
- 16.2.8.2. Products
- 16.2.8.3. SWOT Analysis
- 16.2.8.4. Recent Developments
- 16.2.8.5. Financials (Based on Availability)
- 16.2.1 Cargill Incorporated
List of Figures
- Figure 1: Global UK Food Sweeteners Market Revenue Breakdown (Million, %) by Region 2024 & 2032
- Figure 2: Global UK Food Sweeteners Market Volume Breakdown (K Tons, %) by Region 2024 & 2032
- Figure 3: United kingdom Region UK Food Sweeteners Market Revenue (Million), by Country 2024 & 2032
- Figure 4: United kingdom Region UK Food Sweeteners Market Volume (K Tons), by Country 2024 & 2032
- Figure 5: United kingdom Region UK Food Sweeteners Market Revenue Share (%), by Country 2024 & 2032
- Figure 6: United kingdom Region UK Food Sweeteners Market Volume Share (%), by Country 2024 & 2032
- Figure 7: North America UK Food Sweeteners Market Revenue (Million), by Product Type 2024 & 2032
- Figure 8: North America UK Food Sweeteners Market Volume (K Tons), by Product Type 2024 & 2032
- Figure 9: North America UK Food Sweeteners Market Revenue Share (%), by Product Type 2024 & 2032
- Figure 10: North America UK Food Sweeteners Market Volume Share (%), by Product Type 2024 & 2032
- Figure 11: North America UK Food Sweeteners Market Revenue (Million), by Application 2024 & 2032
- Figure 12: North America UK Food Sweeteners Market Volume (K Tons), by Application 2024 & 2032
- Figure 13: North America UK Food Sweeteners Market Revenue Share (%), by Application 2024 & 2032
- Figure 14: North America UK Food Sweeteners Market Volume Share (%), by Application 2024 & 2032
- Figure 15: North America UK Food Sweeteners Market Revenue (Million), by Country 2024 & 2032
- Figure 16: North America UK Food Sweeteners Market Volume (K Tons), by Country 2024 & 2032
- Figure 17: North America UK Food Sweeteners Market Revenue Share (%), by Country 2024 & 2032
- Figure 18: North America UK Food Sweeteners Market Volume Share (%), by Country 2024 & 2032
- Figure 19: South America UK Food Sweeteners Market Revenue (Million), by Product Type 2024 & 2032
- Figure 20: South America UK Food Sweeteners Market Volume (K Tons), by Product Type 2024 & 2032
- Figure 21: South America UK Food Sweeteners Market Revenue Share (%), by Product Type 2024 & 2032
- Figure 22: South America UK Food Sweeteners Market Volume Share (%), by Product Type 2024 & 2032
- Figure 23: South America UK Food Sweeteners Market Revenue (Million), by Application 2024 & 2032
- Figure 24: South America UK Food Sweeteners Market Volume (K Tons), by Application 2024 & 2032
- Figure 25: South America UK Food Sweeteners Market Revenue Share (%), by Application 2024 & 2032
- Figure 26: South America UK Food Sweeteners Market Volume Share (%), by Application 2024 & 2032
- Figure 27: South America UK Food Sweeteners Market Revenue (Million), by Country 2024 & 2032
- Figure 28: South America UK Food Sweeteners Market Volume (K Tons), by Country 2024 & 2032
- Figure 29: South America UK Food Sweeteners Market Revenue Share (%), by Country 2024 & 2032
- Figure 30: South America UK Food Sweeteners Market Volume Share (%), by Country 2024 & 2032
- Figure 31: Europe UK Food Sweeteners Market Revenue (Million), by Product Type 2024 & 2032
- Figure 32: Europe UK Food Sweeteners Market Volume (K Tons), by Product Type 2024 & 2032
- Figure 33: Europe UK Food Sweeteners Market Revenue Share (%), by Product Type 2024 & 2032
- Figure 34: Europe UK Food Sweeteners Market Volume Share (%), by Product Type 2024 & 2032
- Figure 35: Europe UK Food Sweeteners Market Revenue (Million), by Application 2024 & 2032
- Figure 36: Europe UK Food Sweeteners Market Volume (K Tons), by Application 2024 & 2032
- Figure 37: Europe UK Food Sweeteners Market Revenue Share (%), by Application 2024 & 2032
- Figure 38: Europe UK Food Sweeteners Market Volume Share (%), by Application 2024 & 2032
- Figure 39: Europe UK Food Sweeteners Market Revenue (Million), by Country 2024 & 2032
- Figure 40: Europe UK Food Sweeteners Market Volume (K Tons), by Country 2024 & 2032
- Figure 41: Europe UK Food Sweeteners Market Revenue Share (%), by Country 2024 & 2032
- Figure 42: Europe UK Food Sweeteners Market Volume Share (%), by Country 2024 & 2032
- Figure 43: Middle East & Africa UK Food Sweeteners Market Revenue (Million), by Product Type 2024 & 2032
- Figure 44: Middle East & Africa UK Food Sweeteners Market Volume (K Tons), by Product Type 2024 & 2032
- Figure 45: Middle East & Africa UK Food Sweeteners Market Revenue Share (%), by Product Type 2024 & 2032
- Figure 46: Middle East & Africa UK Food Sweeteners Market Volume Share (%), by Product Type 2024 & 2032
- Figure 47: Middle East & Africa UK Food Sweeteners Market Revenue (Million), by Application 2024 & 2032
- Figure 48: Middle East & Africa UK Food Sweeteners Market Volume (K Tons), by Application 2024 & 2032
- Figure 49: Middle East & Africa UK Food Sweeteners Market Revenue Share (%), by Application 2024 & 2032
- Figure 50: Middle East & Africa UK Food Sweeteners Market Volume Share (%), by Application 2024 & 2032
- Figure 51: Middle East & Africa UK Food Sweeteners Market Revenue (Million), by Country 2024 & 2032
- Figure 52: Middle East & Africa UK Food Sweeteners Market Volume (K Tons), by Country 2024 & 2032
- Figure 53: Middle East & Africa UK Food Sweeteners Market Revenue Share (%), by Country 2024 & 2032
- Figure 54: Middle East & Africa UK Food Sweeteners Market Volume Share (%), by Country 2024 & 2032
- Figure 55: Asia Pacific UK Food Sweeteners Market Revenue (Million), by Product Type 2024 & 2032
- Figure 56: Asia Pacific UK Food Sweeteners Market Volume (K Tons), by Product Type 2024 & 2032
- Figure 57: Asia Pacific UK Food Sweeteners Market Revenue Share (%), by Product Type 2024 & 2032
- Figure 58: Asia Pacific UK Food Sweeteners Market Volume Share (%), by Product Type 2024 & 2032
- Figure 59: Asia Pacific UK Food Sweeteners Market Revenue (Million), by Application 2024 & 2032
- Figure 60: Asia Pacific UK Food Sweeteners Market Volume (K Tons), by Application 2024 & 2032
- Figure 61: Asia Pacific UK Food Sweeteners Market Revenue Share (%), by Application 2024 & 2032
- Figure 62: Asia Pacific UK Food Sweeteners Market Volume Share (%), by Application 2024 & 2032
- Figure 63: Asia Pacific UK Food Sweeteners Market Revenue (Million), by Country 2024 & 2032
- Figure 64: Asia Pacific UK Food Sweeteners Market Volume (K Tons), by Country 2024 & 2032
- Figure 65: Asia Pacific UK Food Sweeteners Market Revenue Share (%), by Country 2024 & 2032
- Figure 66: Asia Pacific UK Food Sweeteners Market Volume Share (%), by Country 2024 & 2032
List of Tables
- Table 1: Global UK Food Sweeteners Market Revenue Million Forecast, by Region 2019 & 2032
- Table 2: Global UK Food Sweeteners Market Volume K Tons Forecast, by Region 2019 & 2032
- Table 3: Global UK Food Sweeteners Market Revenue Million Forecast, by Product Type 2019 & 2032
- Table 4: Global UK Food Sweeteners Market Volume K Tons Forecast, by Product Type 2019 & 2032
- Table 5: Global UK Food Sweeteners Market Revenue Million Forecast, by Application 2019 & 2032
- Table 6: Global UK Food Sweeteners Market Volume K Tons Forecast, by Application 2019 & 2032
- Table 7: Global UK Food Sweeteners Market Revenue Million Forecast, by Region 2019 & 2032
- Table 8: Global UK Food Sweeteners Market Volume K Tons Forecast, by Region 2019 & 2032
- Table 9: Global UK Food Sweeteners Market Revenue Million Forecast, by Country 2019 & 2032
- Table 10: Global UK Food Sweeteners Market Volume K Tons Forecast, by Country 2019 & 2032
- Table 11: England UK Food Sweeteners Market Revenue (Million) Forecast, by Application 2019 & 2032
- Table 12: England UK Food Sweeteners Market Volume (K Tons) Forecast, by Application 2019 & 2032
- Table 13: Wales UK Food Sweeteners Market Revenue (Million) Forecast, by Application 2019 & 2032
- Table 14: Wales UK Food Sweeteners Market Volume (K Tons) Forecast, by Application 2019 & 2032
- Table 15: Scotland UK Food Sweeteners Market Revenue (Million) Forecast, by Application 2019 & 2032
- Table 16: Scotland UK Food Sweeteners Market Volume (K Tons) Forecast, by Application 2019 & 2032
- Table 17: Northern UK Food Sweeteners Market Revenue (Million) Forecast, by Application 2019 & 2032
- Table 18: Northern UK Food Sweeteners Market Volume (K Tons) Forecast, by Application 2019 & 2032
- Table 19: Ireland UK Food Sweeteners Market Revenue (Million) Forecast, by Application 2019 & 2032
- Table 20: Ireland UK Food Sweeteners Market Volume (K Tons) Forecast, by Application 2019 & 2032
- Table 21: Global UK Food Sweeteners Market Revenue Million Forecast, by Product Type 2019 & 2032
- Table 22: Global UK Food Sweeteners Market Volume K Tons Forecast, by Product Type 2019 & 2032
- Table 23: Global UK Food Sweeteners Market Revenue Million Forecast, by Application 2019 & 2032
- Table 24: Global UK Food Sweeteners Market Volume K Tons Forecast, by Application 2019 & 2032
- Table 25: Global UK Food Sweeteners Market Revenue Million Forecast, by Country 2019 & 2032
- Table 26: Global UK Food Sweeteners Market Volume K Tons Forecast, by Country 2019 & 2032
- Table 27: United States UK Food Sweeteners Market Revenue (Million) Forecast, by Application 2019 & 2032
- Table 28: United States UK Food Sweeteners Market Volume (K Tons) Forecast, by Application 2019 & 2032
- Table 29: Canada UK Food Sweeteners Market Revenue (Million) Forecast, by Application 2019 & 2032
- Table 30: Canada UK Food Sweeteners Market Volume (K Tons) Forecast, by Application 2019 & 2032
- Table 31: Mexico UK Food Sweeteners Market Revenue (Million) Forecast, by Application 2019 & 2032
- Table 32: Mexico UK Food Sweeteners Market Volume (K Tons) Forecast, by Application 2019 & 2032
- Table 33: Global UK Food Sweeteners Market Revenue Million Forecast, by Product Type 2019 & 2032
- Table 34: Global UK Food Sweeteners Market Volume K Tons Forecast, by Product Type 2019 & 2032
- Table 35: Global UK Food Sweeteners Market Revenue Million Forecast, by Application 2019 & 2032
- Table 36: Global UK Food Sweeteners Market Volume K Tons Forecast, by Application 2019 & 2032
- Table 37: Global UK Food Sweeteners Market Revenue Million Forecast, by Country 2019 & 2032
- Table 38: Global UK Food Sweeteners Market Volume K Tons Forecast, by Country 2019 & 2032
- Table 39: Brazil UK Food Sweeteners Market Revenue (Million) Forecast, by Application 2019 & 2032
- Table 40: Brazil UK Food Sweeteners Market Volume (K Tons) Forecast, by Application 2019 & 2032
- Table 41: Argentina UK Food Sweeteners Market Revenue (Million) Forecast, by Application 2019 & 2032
- Table 42: Argentina UK Food Sweeteners Market Volume (K Tons) Forecast, by Application 2019 & 2032
- Table 43: Rest of South America UK Food Sweeteners Market Revenue (Million) Forecast, by Application 2019 & 2032
- Table 44: Rest of South America UK Food Sweeteners Market Volume (K Tons) Forecast, by Application 2019 & 2032
- Table 45: Global UK Food Sweeteners Market Revenue Million Forecast, by Product Type 2019 & 2032
- Table 46: Global UK Food Sweeteners Market Volume K Tons Forecast, by Product Type 2019 & 2032
- Table 47: Global UK Food Sweeteners Market Revenue Million Forecast, by Application 2019 & 2032
- Table 48: Global UK Food Sweeteners Market Volume K Tons Forecast, by Application 2019 & 2032
- Table 49: Global UK Food Sweeteners Market Revenue Million Forecast, by Country 2019 & 2032
- Table 50: Global UK Food Sweeteners Market Volume K Tons Forecast, by Country 2019 & 2032
- Table 51: United Kingdom UK Food Sweeteners Market Revenue (Million) Forecast, by Application 2019 & 2032
- Table 52: United Kingdom UK Food Sweeteners Market Volume (K Tons) Forecast, by Application 2019 & 2032
- Table 53: Germany UK Food Sweeteners Market Revenue (Million) Forecast, by Application 2019 & 2032
- Table 54: Germany UK Food Sweeteners Market Volume (K Tons) Forecast, by Application 2019 & 2032
- Table 55: France UK Food Sweeteners Market Revenue (Million) Forecast, by Application 2019 & 2032
- Table 56: France UK Food Sweeteners Market Volume (K Tons) Forecast, by Application 2019 & 2032
- Table 57: Italy UK Food Sweeteners Market Revenue (Million) Forecast, by Application 2019 & 2032
- Table 58: Italy UK Food Sweeteners Market Volume (K Tons) Forecast, by Application 2019 & 2032
- Table 59: Spain UK Food Sweeteners Market Revenue (Million) Forecast, by Application 2019 & 2032
- Table 60: Spain UK Food Sweeteners Market Volume (K Tons) Forecast, by Application 2019 & 2032
- Table 61: Russia UK Food Sweeteners Market Revenue (Million) Forecast, by Application 2019 & 2032
- Table 62: Russia UK Food Sweeteners Market Volume (K Tons) Forecast, by Application 2019 & 2032
- Table 63: Benelux UK Food Sweeteners Market Revenue (Million) Forecast, by Application 2019 & 2032
- Table 64: Benelux UK Food Sweeteners Market Volume (K Tons) Forecast, by Application 2019 & 2032
- Table 65: Nordics UK Food Sweeteners Market Revenue (Million) Forecast, by Application 2019 & 2032
- Table 66: Nordics UK Food Sweeteners Market Volume (K Tons) Forecast, by Application 2019 & 2032
- Table 67: Rest of Europe UK Food Sweeteners Market Revenue (Million) Forecast, by Application 2019 & 2032
- Table 68: Rest of Europe UK Food Sweeteners Market Volume (K Tons) Forecast, by Application 2019 & 2032
- Table 69: Global UK Food Sweeteners Market Revenue Million Forecast, by Product Type 2019 & 2032
- Table 70: Global UK Food Sweeteners Market Volume K Tons Forecast, by Product Type 2019 & 2032
- Table 71: Global UK Food Sweeteners Market Revenue Million Forecast, by Application 2019 & 2032
- Table 72: Global UK Food Sweeteners Market Volume K Tons Forecast, by Application 2019 & 2032
- Table 73: Global UK Food Sweeteners Market Revenue Million Forecast, by Country 2019 & 2032
- Table 74: Global UK Food Sweeteners Market Volume K Tons Forecast, by Country 2019 & 2032
- Table 75: Turkey UK Food Sweeteners Market Revenue (Million) Forecast, by Application 2019 & 2032
- Table 76: Turkey UK Food Sweeteners Market Volume (K Tons) Forecast, by Application 2019 & 2032
- Table 77: Israel UK Food Sweeteners Market Revenue (Million) Forecast, by Application 2019 & 2032
- Table 78: Israel UK Food Sweeteners Market Volume (K Tons) Forecast, by Application 2019 & 2032
- Table 79: GCC UK Food Sweeteners Market Revenue (Million) Forecast, by Application 2019 & 2032
- Table 80: GCC UK Food Sweeteners Market Volume (K Tons) Forecast, by Application 2019 & 2032
- Table 81: North Africa UK Food Sweeteners Market Revenue (Million) Forecast, by Application 2019 & 2032
- Table 82: North Africa UK Food Sweeteners Market Volume (K Tons) Forecast, by Application 2019 & 2032
- Table 83: South Africa UK Food Sweeteners Market Revenue (Million) Forecast, by Application 2019 & 2032
- Table 84: South Africa UK Food Sweeteners Market Volume (K Tons) Forecast, by Application 2019 & 2032
- Table 85: Rest of Middle East & Africa UK Food Sweeteners Market Revenue (Million) Forecast, by Application 2019 & 2032
- Table 86: Rest of Middle East & Africa UK Food Sweeteners Market Volume (K Tons) Forecast, by Application 2019 & 2032
- Table 87: Global UK Food Sweeteners Market Revenue Million Forecast, by Product Type 2019 & 2032
- Table 88: Global UK Food Sweeteners Market Volume K Tons Forecast, by Product Type 2019 & 2032
- Table 89: Global UK Food Sweeteners Market Revenue Million Forecast, by Application 2019 & 2032
- Table 90: Global UK Food Sweeteners Market Volume K Tons Forecast, by Application 2019 & 2032
- Table 91: Global UK Food Sweeteners Market Revenue Million Forecast, by Country 2019 & 2032
- Table 92: Global UK Food Sweeteners Market Volume K Tons Forecast, by Country 2019 & 2032
- Table 93: China UK Food Sweeteners Market Revenue (Million) Forecast, by Application 2019 & 2032
- Table 94: China UK Food Sweeteners Market Volume (K Tons) Forecast, by Application 2019 & 2032
- Table 95: India UK Food Sweeteners Market Revenue (Million) Forecast, by Application 2019 & 2032
- Table 96: India UK Food Sweeteners Market Volume (K Tons) Forecast, by Application 2019 & 2032
- Table 97: Japan UK Food Sweeteners Market Revenue (Million) Forecast, by Application 2019 & 2032
- Table 98: Japan UK Food Sweeteners Market Volume (K Tons) Forecast, by Application 2019 & 2032
- Table 99: South Korea UK Food Sweeteners Market Revenue (Million) Forecast, by Application 2019 & 2032
- Table 100: South Korea UK Food Sweeteners Market Volume (K Tons) Forecast, by Application 2019 & 2032
- Table 101: ASEAN UK Food Sweeteners Market Revenue (Million) Forecast, by Application 2019 & 2032
- Table 102: ASEAN UK Food Sweeteners Market Volume (K Tons) Forecast, by Application 2019 & 2032
- Table 103: Oceania UK Food Sweeteners Market Revenue (Million) Forecast, by Application 2019 & 2032
- Table 104: Oceania UK Food Sweeteners Market Volume (K Tons) Forecast, by Application 2019 & 2032
- Table 105: Rest of Asia Pacific UK Food Sweeteners Market Revenue (Million) Forecast, by Application 2019 & 2032
- Table 106: Rest of Asia Pacific UK Food Sweeteners Market Volume (K Tons) Forecast, by Application 2019 & 2032
Frequently Asked Questions
1. What is the projected Compound Annual Growth Rate (CAGR) of the UK Food Sweeteners Market?
The projected CAGR is approximately 1.59%.
2. Which companies are prominent players in the UK Food Sweeteners Market?
Key companies in the market include Cargill Incorporated, GLG Life Tech Corporation, PureCircle Limited, Archer Daniels Midland Company, Tate & Lyle PLC, DuPont, Ingredion Incorporated, Tereos S A *List Not Exhaustive.
3. What are the main segments of the UK Food Sweeteners Market?
The market segments include Product Type, Application.
4. Can you provide details about the market size?
The market size is estimated to be USD XX Million as of 2022.
5. What are some drivers contributing to market growth?
Rising Application in Dietary Supplements.
6. What are the notable trends driving market growth?
Xylitol Accounts For The Largest Share.
7. Are there any restraints impacting market growth?
Increasing prevalence of hydroglycemia.
8. Can you provide examples of recent developments in the market?
N/A
9. What pricing options are available for accessing the report?
Pricing options include single-user, multi-user, and enterprise licenses priced at USD 3800, USD 4500, and USD 5800 respectively.
10. Is the market size provided in terms of value or volume?
The market size is provided in terms of value, measured in Million and volume, measured in K Tons.
11. Are there any specific market keywords associated with the report?
Yes, the market keyword associated with the report is "UK Food Sweeteners Market," which aids in identifying and referencing the specific market segment covered.
12. How do I determine which pricing option suits my needs best?
The pricing options vary based on user requirements and access needs. Individual users may opt for single-user licenses, while businesses requiring broader access may choose multi-user or enterprise licenses for cost-effective access to the report.
13. Are there any additional resources or data provided in the UK Food Sweeteners Market report?
While the report offers comprehensive insights, it's advisable to review the specific contents or supplementary materials provided to ascertain if additional resources or data are available.
14. How can I stay updated on further developments or reports in the UK Food Sweeteners Market?
To stay informed about further developments, trends, and reports in the UK Food Sweeteners Market, consider subscribing to industry newsletters, following relevant companies and organizations, or regularly checking reputable industry news sources and publications.
Methodology
Step 1 - Identification of Relevant Samples Size from Population Database


Step 2 - Approaches for Defining Global Market Size (Value, Volume* & Price*)

Note*: In applicable scenarios
Step 3 - Data Sources
Primary Research
- Web Analytics
- Survey Reports
- Research Institute
- Latest Research Reports
- Opinion Leaders
Secondary Research
- Annual Reports
- White Paper
- Latest Press Release
- Industry Association
- Paid Database
- Investor Presentations

Step 4 - Data Triangulation
Involves using different sources of information in order to increase the validity of a study
These sources are likely to be stakeholders in a program - participants, other researchers, program staff, other community members, and so on.
Then we put all data in single framework & apply various statistical tools to find out the dynamic on the market.
During the analysis stage, feedback from the stakeholder groups would be compared to determine areas of agreement as well as areas of divergence


