
Key Insights
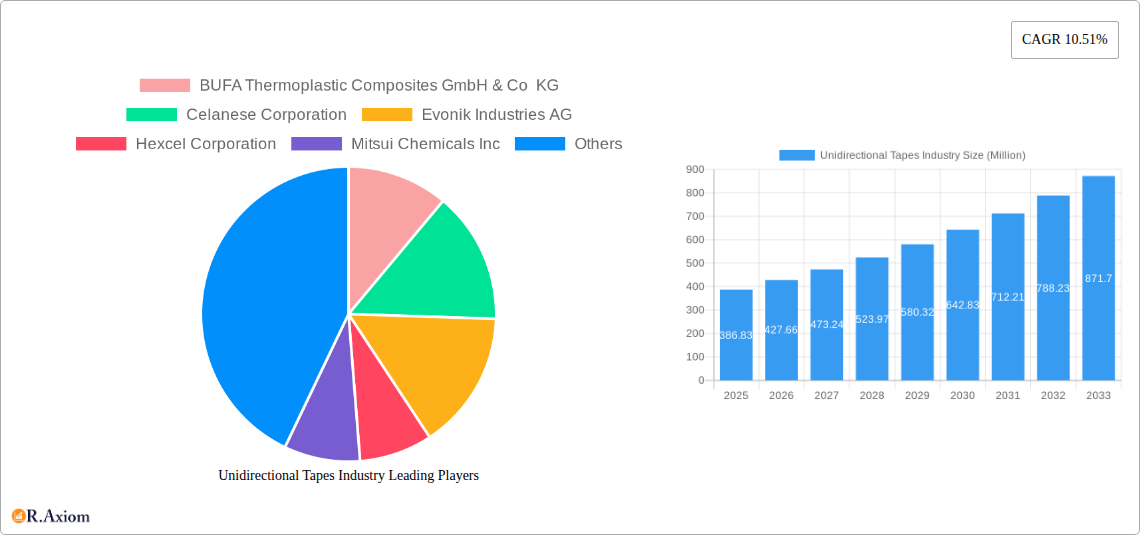
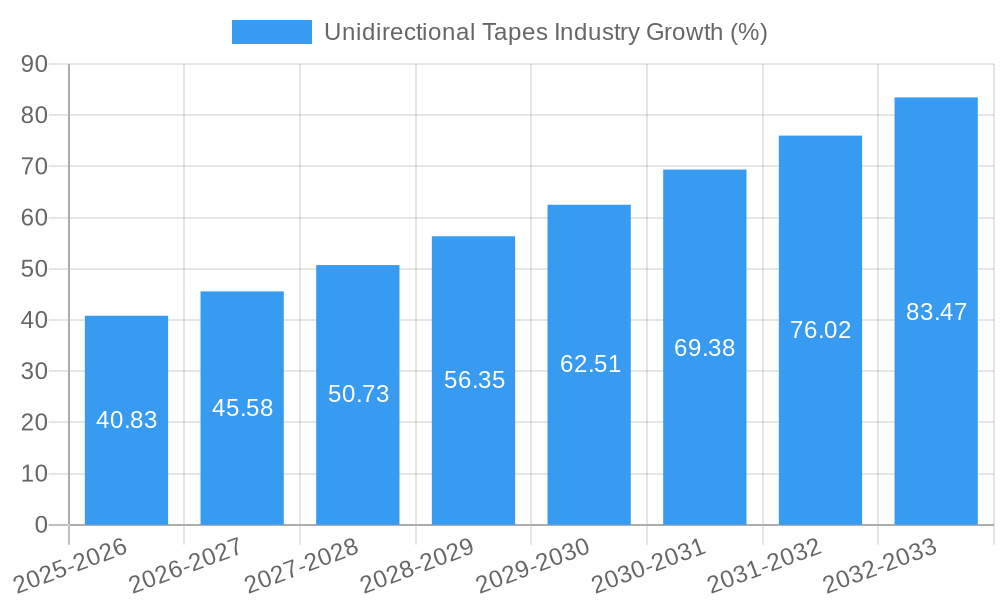
The unidirectional tapes market, valued at $386.83 million in 2025, is projected to experience robust growth, exhibiting a compound annual growth rate (CAGR) of 10.51% from 2025 to 2033. This expansion is fueled by several key drivers. The increasing demand for lightweight yet high-strength materials in aerospace and automotive applications is a primary catalyst. Furthermore, the growing adoption of unidirectional tapes in wind energy turbine blade manufacturing, driven by the need for improved efficiency and durability, significantly contributes to market growth. Advancements in material science, leading to the development of stronger and more versatile tapes with enhanced performance characteristics, also propel market expansion. While challenges such as raw material price fluctuations and the potential for competitive pressure from alternative materials exist, the overall market outlook remains positive. The diverse applications across various industries, including sporting goods and construction, further ensure sustained demand. Key players such as BUFA Thermoplastic Composites GmbH & Co KG, Celanese Corporation, and Toray Industries Inc. are actively involved in innovation and expansion, contributing to the competitive landscape.
The segmentation of the unidirectional tapes market is likely driven by fiber type (carbon fiber, glass fiber, aramid fiber, etc.), resin type (epoxy, polyester, etc.), and application. While specific segment data is unavailable, a reasonable assumption based on industry trends is that carbon fiber tapes hold the largest market share due to their superior strength-to-weight ratio. The automotive and aerospace sectors are likely to dominate application segments, followed by the wind energy and construction industries. Regional variations are also anticipated, with North America and Europe potentially holding significant shares due to established manufacturing and aerospace industries. However, the Asia-Pacific region is expected to demonstrate faster growth due to expanding industrialization and investments in renewable energy. Future market growth will depend on technological advancements, government regulations promoting lightweighting and sustainability, and the continued expansion of key industries leveraging unidirectional tapes' unique properties.
Unidirectional Tapes Industry Market Report: 2019-2033
This comprehensive report provides a detailed analysis of the Unidirectional Tapes industry, offering invaluable insights for stakeholders across the value chain. Covering the period from 2019 to 2033, with a focus on 2025, this report examines market dynamics, growth drivers, competitive landscapes, and future opportunities. The report uses real data and predicted values (marked as "xx" where unavailable) and avoids placeholders. The report projects a xx Million market size by 2025, with a CAGR of xx% expected during 2025-2033.
Unidirectional Tapes Industry Market Concentration & Innovation
This section analyzes the Unidirectional Tapes market's competitive landscape, exploring factors influencing market concentration, innovation, regulatory frameworks, product substitutes, end-user trends, and mergers & acquisitions (M&A) activities.
The market is moderately concentrated, with several major players holding significant market share. While precise market share figures for each company are xx, key players include BUFA Thermoplastic Composites GmbH & Co KG, Celanese Corporation, Evonik Industries AG, Hexcel Corporation, Mitsui Chemicals Inc, Oxeon AB (TeXtreme), Plastic Reinforcement Fabrics Ltd, SABIC, SGL Carbon, Solvay, TCR Composites Inc, TEIJIN LIMITED, TOPOLO New Materials, TORAY INDUSTRIES INC, and Victrex plc. The industry witnesses continuous innovation driven by the demand for lighter, stronger, and more sustainable materials in various applications.
- Innovation Drivers: Advancements in fiber technology (e.g., carbon fiber, aramid fiber), resin systems (e.g., thermosets, thermoplastics), and manufacturing processes (e.g., automated tape laying) are key drivers.
- Regulatory Frameworks: Environmental regulations are pushing for sustainable materials, influencing the adoption of bio-based and recycled fibers. Safety standards for various end-use industries also play a crucial role.
- Product Substitutes: Other composite materials, such as woven fabrics and pultruded profiles, compete with unidirectional tapes. However, unidirectional tapes' superior strength-to-weight ratio and design flexibility often give them an edge.
- End-User Trends: The growing demand for lightweight and high-performance materials in aerospace, automotive, and wind energy sectors is fueling market growth.
- M&A Activities: Recent M&A activities have focused on expanding product portfolios, geographical reach, and technological capabilities. The total value of M&A deals in the last five years is estimated at xx Million.
Unidirectional Tapes Industry Industry Trends & Insights
This section delves into the broader trends shaping the Unidirectional Tapes market. The market is experiencing robust growth, driven by increasing demand across diverse sectors. The automotive industry's shift toward electric vehicles and lightweight designs is a significant catalyst. Similarly, the aerospace industry's pursuit of fuel efficiency is boosting the demand for high-performance, lightweight composite materials. The global wind energy sector's expansion further fuels this demand, requiring strong and durable materials for turbine blades. Technological advancements, such as improved resin systems and automated manufacturing processes, are also contributing to market growth.
The market is also witnessing a growing focus on sustainability, with the increased use of bio-based and recycled materials. Consumer preferences are shifting towards environmentally friendly products, creating opportunities for manufacturers of sustainable unidirectional tapes. Competitive dynamics are characterized by innovation in material science, manufacturing efficiency, and strategic partnerships. The market penetration of unidirectional tapes in various applications varies, but overall, the market displays significant growth potential.
Dominant Markets & Segments in Unidirectional Tapes Industry
The aerospace industry represents a dominant segment, particularly in high-value applications requiring superior strength and lightweight properties. The automotive sector also demonstrates considerable potential, driven by the increasing adoption of composites in vehicles. The wind energy sector presents another significant market segment.
- Key Drivers for Aerospace Dominance: Stringent lightweighting requirements, high performance demands, and the need for superior mechanical properties drive the dominance of the aerospace sector.
- Key Drivers for Automotive Dominance: The growing need for fuel-efficient vehicles, lightweight designs, and the increased adoption of electric vehicles are shaping the market growth in the automotive sector.
- Key Drivers for Wind Energy Dominance: The rapid growth of renewable energy and the demand for robust and efficient wind turbine blades fuel the market growth in the wind energy sector.
- Geographic Dominance: North America and Europe currently hold the largest market share due to established aerospace and automotive industries. However, Asia-Pacific is showing strong growth due to increasing manufacturing and infrastructure development.
Unidirectional Tapes Industry Product Developments
Recent product innovations focus on enhancing performance characteristics, including improved tensile strength, fatigue resistance, and durability. There's a growing trend towards developing unidirectional tapes with enhanced processability and improved adhesion to various substrates. These advancements cater to the specific needs of various end-use industries, broadening the market applications. Technological trends focus on utilizing advanced fiber types, novel resin chemistries, and advanced manufacturing techniques to enhance product performance and reduce manufacturing costs.
Report Scope & Segmentation Analysis
This report segments the Unidirectional Tapes market based on fiber type (carbon fiber, aramid fiber, glass fiber, others), resin type (thermoset, thermoplastic), application (aerospace, automotive, wind energy, others), and region (North America, Europe, Asia-Pacific, Middle East & Africa, South America). Each segment’s growth projections, market sizes, and competitive dynamics are thoroughly analyzed. Detailed growth projections for each segment are presented for the forecast period (2025-2033).
Key Drivers of Unidirectional Tapes Industry Growth
Several factors drive the growth of the unidirectional tapes industry:
- Technological advancements: Innovations in fiber and resin technologies continuously improve the performance of unidirectional tapes.
- Lightweighting initiatives: The demand for lighter materials across various industries (aerospace, automotive) fuels market growth.
- Sustainable materials: Growing environmental awareness drives the adoption of bio-based and recycled materials in unidirectional tapes.
- Government regulations: Regulations promoting fuel efficiency and reducing emissions create a demand for lightweight and high-performance materials.
Challenges in the Unidirectional Tapes Industry Sector
The industry faces several challenges:
- High raw material costs: Fluctuations in raw material prices, particularly for carbon fiber, impact profitability.
- Supply chain disruptions: Global supply chain issues can affect the availability and cost of raw materials.
- Stringent quality control: Maintaining consistent quality in unidirectional tape manufacturing is critical due to the high-performance demands of end-use industries.
- Intense competition: The market is witnessing increasing competition from existing and emerging players.
Emerging Opportunities in Unidirectional Tapes Industry
The industry offers significant growth opportunities:
- New applications: Expanding into emerging applications like sporting goods, construction, and consumer electronics.
- Advanced materials: The development of high-performance fibers and resins opens up possibilities for enhanced unidirectional tapes.
- Sustainable solutions: The rising demand for eco-friendly materials will drive the growth of bio-based and recycled unidirectional tapes.
Leading Players in the Unidirectional Tapes Industry Market
- BUFA Thermoplastic Composites GmbH & Co KG
- Celanese Corporation
- Evonik Industries AG
- Hexcel Corporation
- Mitsui Chemicals Inc
- Oxeon AB (TeXtreme)
- Plastic Reinforcement Fabrics Ltd
- SABIC
- SGL Carbon
- Solvay
- TCR Composites Inc
- TEIJIN LIMITED
- TOPOLO New Materials
- TORAY INDUSTRIES INC
- Victrex plc *List Not Exhaustive
Key Developments in Unidirectional Tapes Industry Industry
- January 2022: Evonik Industries AG received DNV certification for its VESTAPE PA12-CF unidirectional tape, expanding its applications in hydrocarbon, water, and gas injection.
- June 2021: Teijin joined Spirit AeroSystems' Aerospace Innovation Center to collaborate on carbon fiber thermoplastic unidirectional pre-impregnated tape development for aircraft applications.
- March 2021: BÜFA Thermoplastic Composites GmbH & Co. KG partnered with B-PREG to offer unidirectional prepreg tapes using flax fiber and polypropylene, focusing on sustainable materials.
Strategic Outlook for Unidirectional Tapes Industry Market
The Unidirectional Tapes market is poised for significant growth, driven by technological advancements, increasing demand from key industries, and the rising adoption of sustainable materials. Continued innovation in fiber and resin technologies, coupled with strategic partnerships and investments in manufacturing capabilities, will shape future market dynamics. The focus on lightweighting, high-performance materials, and sustainability will continue to be crucial drivers for industry growth throughout the forecast period.
Unidirectional Tapes Industry Segmentation
-
1. Reinforcement Type
- 1.1. Glass Fiber
- 1.2. Carbon Fiber
- 1.3. Other Reinforcement Types
-
2. Backing Material
- 2.1. Polyether Ether Ketone (PEEK)
- 2.2. Polyamide (PA)
- 2.3. Polypropylene (PP)
- 2.4. Polycarbonate (PC)
- 2.5. Polyphenylene Sulfide (PPS)
- 2.6. Other Backing Materials
-
3. Adhesive Type
- 3.1. Epoxy
- 3.2. Polyurethane
- 3.3. Other Adhesive Types
-
4. End-user Industry
- 4.1. Aerospace and Defense
- 4.2. Automotive
- 4.3. Sports and Leisure
- 4.4. Industrial
- 4.5. Wind Energy
- 4.6. Other End-user Industries
Unidirectional Tapes Industry Segmentation By Geography
-
1. Asia Pacific
- 1.1. China
- 1.2. India
- 1.3. Japan
- 1.4. South Korea
- 1.5. Rest of Asia Pacific
-
2. North America
- 2.1. United States
- 2.2. Canada
- 2.3. Mexico
-
3. Europe
- 3.1. Germany
- 3.2. United Kingdom
- 3.3. France
- 3.4. Italy
- 3.5. Rest of Europe
-
4. South America
- 4.1. Brazil
- 4.2. Argentina
- 4.3. Rest of South America
-
5. Middle East and Africa
- 5.1. Saudi Arabia
- 5.2. South Africa
- 5.3. Rest of Middle East and Africa

Unidirectional Tapes Industry REPORT HIGHLIGHTS
| Aspects | Details |
|---|---|
| Study Period | 2019-2033 |
| Base Year | 2024 |
| Estimated Year | 2025 |
| Forecast Period | 2025-2033 |
| Historical Period | 2019-2024 |
| Growth Rate | CAGR of 10.51% from 2019-2033 |
| Segmentation |
|
Table of Contents
- 1. Introduction
- 1.1. Research Scope
- 1.2. Market Segmentation
- 1.3. Research Methodology
- 1.4. Definitions and Assumptions
- 2. Executive Summary
- 2.1. Introduction
- 3. Market Dynamics
- 3.1. Introduction
- 3.2. Market Drivers
- 3.2.1. Growing Demand from the Aerospace and Defense Industry; Rising Usage of Unidirectional Tape in the Wind and Automotive Industries
- 3.3. Market Restrains
- 3.3.1. Growing Demand from the Aerospace and Defense Industry; Rising Usage of Unidirectional Tape in the Wind and Automotive Industries
- 3.4. Market Trends
- 3.4.1. Growing Demand from the Aerospace and Defense Industry
- 4. Market Factor Analysis
- 4.1. Porters Five Forces
- 4.2. Supply/Value Chain
- 4.3. PESTEL analysis
- 4.4. Market Entropy
- 4.5. Patent/Trademark Analysis
- 5. Global Unidirectional Tapes Industry Analysis, Insights and Forecast, 2019-2031
- 5.1. Market Analysis, Insights and Forecast - by Reinforcement Type
- 5.1.1. Glass Fiber
- 5.1.2. Carbon Fiber
- 5.1.3. Other Reinforcement Types
- 5.2. Market Analysis, Insights and Forecast - by Backing Material
- 5.2.1. Polyether Ether Ketone (PEEK)
- 5.2.2. Polyamide (PA)
- 5.2.3. Polypropylene (PP)
- 5.2.4. Polycarbonate (PC)
- 5.2.5. Polyphenylene Sulfide (PPS)
- 5.2.6. Other Backing Materials
- 5.3. Market Analysis, Insights and Forecast - by Adhesive Type
- 5.3.1. Epoxy
- 5.3.2. Polyurethane
- 5.3.3. Other Adhesive Types
- 5.4. Market Analysis, Insights and Forecast - by End-user Industry
- 5.4.1. Aerospace and Defense
- 5.4.2. Automotive
- 5.4.3. Sports and Leisure
- 5.4.4. Industrial
- 5.4.5. Wind Energy
- 5.4.6. Other End-user Industries
- 5.5. Market Analysis, Insights and Forecast - by Region
- 5.5.1. Asia Pacific
- 5.5.2. North America
- 5.5.3. Europe
- 5.5.4. South America
- 5.5.5. Middle East and Africa
- 5.1. Market Analysis, Insights and Forecast - by Reinforcement Type
- 6. Asia Pacific Unidirectional Tapes Industry Analysis, Insights and Forecast, 2019-2031
- 6.1. Market Analysis, Insights and Forecast - by Reinforcement Type
- 6.1.1. Glass Fiber
- 6.1.2. Carbon Fiber
- 6.1.3. Other Reinforcement Types
- 6.2. Market Analysis, Insights and Forecast - by Backing Material
- 6.2.1. Polyether Ether Ketone (PEEK)
- 6.2.2. Polyamide (PA)
- 6.2.3. Polypropylene (PP)
- 6.2.4. Polycarbonate (PC)
- 6.2.5. Polyphenylene Sulfide (PPS)
- 6.2.6. Other Backing Materials
- 6.3. Market Analysis, Insights and Forecast - by Adhesive Type
- 6.3.1. Epoxy
- 6.3.2. Polyurethane
- 6.3.3. Other Adhesive Types
- 6.4. Market Analysis, Insights and Forecast - by End-user Industry
- 6.4.1. Aerospace and Defense
- 6.4.2. Automotive
- 6.4.3. Sports and Leisure
- 6.4.4. Industrial
- 6.4.5. Wind Energy
- 6.4.6. Other End-user Industries
- 6.1. Market Analysis, Insights and Forecast - by Reinforcement Type
- 7. North America Unidirectional Tapes Industry Analysis, Insights and Forecast, 2019-2031
- 7.1. Market Analysis, Insights and Forecast - by Reinforcement Type
- 7.1.1. Glass Fiber
- 7.1.2. Carbon Fiber
- 7.1.3. Other Reinforcement Types
- 7.2. Market Analysis, Insights and Forecast - by Backing Material
- 7.2.1. Polyether Ether Ketone (PEEK)
- 7.2.2. Polyamide (PA)
- 7.2.3. Polypropylene (PP)
- 7.2.4. Polycarbonate (PC)
- 7.2.5. Polyphenylene Sulfide (PPS)
- 7.2.6. Other Backing Materials
- 7.3. Market Analysis, Insights and Forecast - by Adhesive Type
- 7.3.1. Epoxy
- 7.3.2. Polyurethane
- 7.3.3. Other Adhesive Types
- 7.4. Market Analysis, Insights and Forecast - by End-user Industry
- 7.4.1. Aerospace and Defense
- 7.4.2. Automotive
- 7.4.3. Sports and Leisure
- 7.4.4. Industrial
- 7.4.5. Wind Energy
- 7.4.6. Other End-user Industries
- 7.1. Market Analysis, Insights and Forecast - by Reinforcement Type
- 8. Europe Unidirectional Tapes Industry Analysis, Insights and Forecast, 2019-2031
- 8.1. Market Analysis, Insights and Forecast - by Reinforcement Type
- 8.1.1. Glass Fiber
- 8.1.2. Carbon Fiber
- 8.1.3. Other Reinforcement Types
- 8.2. Market Analysis, Insights and Forecast - by Backing Material
- 8.2.1. Polyether Ether Ketone (PEEK)
- 8.2.2. Polyamide (PA)
- 8.2.3. Polypropylene (PP)
- 8.2.4. Polycarbonate (PC)
- 8.2.5. Polyphenylene Sulfide (PPS)
- 8.2.6. Other Backing Materials
- 8.3. Market Analysis, Insights and Forecast - by Adhesive Type
- 8.3.1. Epoxy
- 8.3.2. Polyurethane
- 8.3.3. Other Adhesive Types
- 8.4. Market Analysis, Insights and Forecast - by End-user Industry
- 8.4.1. Aerospace and Defense
- 8.4.2. Automotive
- 8.4.3. Sports and Leisure
- 8.4.4. Industrial
- 8.4.5. Wind Energy
- 8.4.6. Other End-user Industries
- 8.1. Market Analysis, Insights and Forecast - by Reinforcement Type
- 9. South America Unidirectional Tapes Industry Analysis, Insights and Forecast, 2019-2031
- 9.1. Market Analysis, Insights and Forecast - by Reinforcement Type
- 9.1.1. Glass Fiber
- 9.1.2. Carbon Fiber
- 9.1.3. Other Reinforcement Types
- 9.2. Market Analysis, Insights and Forecast - by Backing Material
- 9.2.1. Polyether Ether Ketone (PEEK)
- 9.2.2. Polyamide (PA)
- 9.2.3. Polypropylene (PP)
- 9.2.4. Polycarbonate (PC)
- 9.2.5. Polyphenylene Sulfide (PPS)
- 9.2.6. Other Backing Materials
- 9.3. Market Analysis, Insights and Forecast - by Adhesive Type
- 9.3.1. Epoxy
- 9.3.2. Polyurethane
- 9.3.3. Other Adhesive Types
- 9.4. Market Analysis, Insights and Forecast - by End-user Industry
- 9.4.1. Aerospace and Defense
- 9.4.2. Automotive
- 9.4.3. Sports and Leisure
- 9.4.4. Industrial
- 9.4.5. Wind Energy
- 9.4.6. Other End-user Industries
- 9.1. Market Analysis, Insights and Forecast - by Reinforcement Type
- 10. Middle East and Africa Unidirectional Tapes Industry Analysis, Insights and Forecast, 2019-2031
- 10.1. Market Analysis, Insights and Forecast - by Reinforcement Type
- 10.1.1. Glass Fiber
- 10.1.2. Carbon Fiber
- 10.1.3. Other Reinforcement Types
- 10.2. Market Analysis, Insights and Forecast - by Backing Material
- 10.2.1. Polyether Ether Ketone (PEEK)
- 10.2.2. Polyamide (PA)
- 10.2.3. Polypropylene (PP)
- 10.2.4. Polycarbonate (PC)
- 10.2.5. Polyphenylene Sulfide (PPS)
- 10.2.6. Other Backing Materials
- 10.3. Market Analysis, Insights and Forecast - by Adhesive Type
- 10.3.1. Epoxy
- 10.3.2. Polyurethane
- 10.3.3. Other Adhesive Types
- 10.4. Market Analysis, Insights and Forecast - by End-user Industry
- 10.4.1. Aerospace and Defense
- 10.4.2. Automotive
- 10.4.3. Sports and Leisure
- 10.4.4. Industrial
- 10.4.5. Wind Energy
- 10.4.6. Other End-user Industries
- 10.1. Market Analysis, Insights and Forecast - by Reinforcement Type
- 11. Competitive Analysis
- 11.1. Global Market Share Analysis 2024
- 11.2. Company Profiles
- 11.2.1 BUFA Thermoplastic Composites GmbH & Co KG
- 11.2.1.1. Overview
- 11.2.1.2. Products
- 11.2.1.3. SWOT Analysis
- 11.2.1.4. Recent Developments
- 11.2.1.5. Financials (Based on Availability)
- 11.2.2 Celanese Corporation
- 11.2.2.1. Overview
- 11.2.2.2. Products
- 11.2.2.3. SWOT Analysis
- 11.2.2.4. Recent Developments
- 11.2.2.5. Financials (Based on Availability)
- 11.2.3 Evonik Industries AG
- 11.2.3.1. Overview
- 11.2.3.2. Products
- 11.2.3.3. SWOT Analysis
- 11.2.3.4. Recent Developments
- 11.2.3.5. Financials (Based on Availability)
- 11.2.4 Hexcel Corporation
- 11.2.4.1. Overview
- 11.2.4.2. Products
- 11.2.4.3. SWOT Analysis
- 11.2.4.4. Recent Developments
- 11.2.4.5. Financials (Based on Availability)
- 11.2.5 Mitsui Chemicals Inc
- 11.2.5.1. Overview
- 11.2.5.2. Products
- 11.2.5.3. SWOT Analysis
- 11.2.5.4. Recent Developments
- 11.2.5.5. Financials (Based on Availability)
- 11.2.6 Oxeon AB (TeXtreme)
- 11.2.6.1. Overview
- 11.2.6.2. Products
- 11.2.6.3. SWOT Analysis
- 11.2.6.4. Recent Developments
- 11.2.6.5. Financials (Based on Availability)
- 11.2.7 Plastic Reinforcement Fabrics Ltd
- 11.2.7.1. Overview
- 11.2.7.2. Products
- 11.2.7.3. SWOT Analysis
- 11.2.7.4. Recent Developments
- 11.2.7.5. Financials (Based on Availability)
- 11.2.8 SABIC
- 11.2.8.1. Overview
- 11.2.8.2. Products
- 11.2.8.3. SWOT Analysis
- 11.2.8.4. Recent Developments
- 11.2.8.5. Financials (Based on Availability)
- 11.2.9 SGL Carbon
- 11.2.9.1. Overview
- 11.2.9.2. Products
- 11.2.9.3. SWOT Analysis
- 11.2.9.4. Recent Developments
- 11.2.9.5. Financials (Based on Availability)
- 11.2.10 Solvay
- 11.2.10.1. Overview
- 11.2.10.2. Products
- 11.2.10.3. SWOT Analysis
- 11.2.10.4. Recent Developments
- 11.2.10.5. Financials (Based on Availability)
- 11.2.11 TCR Composites Inc
- 11.2.11.1. Overview
- 11.2.11.2. Products
- 11.2.11.3. SWOT Analysis
- 11.2.11.4. Recent Developments
- 11.2.11.5. Financials (Based on Availability)
- 11.2.12 TEIJIN LIMITED
- 11.2.12.1. Overview
- 11.2.12.2. Products
- 11.2.12.3. SWOT Analysis
- 11.2.12.4. Recent Developments
- 11.2.12.5. Financials (Based on Availability)
- 11.2.13 TOPOLO New Materials
- 11.2.13.1. Overview
- 11.2.13.2. Products
- 11.2.13.3. SWOT Analysis
- 11.2.13.4. Recent Developments
- 11.2.13.5. Financials (Based on Availability)
- 11.2.14 TORAY INDUSTRIES INC
- 11.2.14.1. Overview
- 11.2.14.2. Products
- 11.2.14.3. SWOT Analysis
- 11.2.14.4. Recent Developments
- 11.2.14.5. Financials (Based on Availability)
- 11.2.15 Victrex plc*List Not Exhaustive
- 11.2.15.1. Overview
- 11.2.15.2. Products
- 11.2.15.3. SWOT Analysis
- 11.2.15.4. Recent Developments
- 11.2.15.5. Financials (Based on Availability)
- 11.2.1 BUFA Thermoplastic Composites GmbH & Co KG
List of Figures
- Figure 1: Global Unidirectional Tapes Industry Revenue Breakdown (Million, %) by Region 2024 & 2032
- Figure 2: Global Unidirectional Tapes Industry Volume Breakdown (Million, %) by Region 2024 & 2032
- Figure 3: Asia Pacific Unidirectional Tapes Industry Revenue (Million), by Reinforcement Type 2024 & 2032
- Figure 4: Asia Pacific Unidirectional Tapes Industry Volume (Million), by Reinforcement Type 2024 & 2032
- Figure 5: Asia Pacific Unidirectional Tapes Industry Revenue Share (%), by Reinforcement Type 2024 & 2032
- Figure 6: Asia Pacific Unidirectional Tapes Industry Volume Share (%), by Reinforcement Type 2024 & 2032
- Figure 7: Asia Pacific Unidirectional Tapes Industry Revenue (Million), by Backing Material 2024 & 2032
- Figure 8: Asia Pacific Unidirectional Tapes Industry Volume (Million), by Backing Material 2024 & 2032
- Figure 9: Asia Pacific Unidirectional Tapes Industry Revenue Share (%), by Backing Material 2024 & 2032
- Figure 10: Asia Pacific Unidirectional Tapes Industry Volume Share (%), by Backing Material 2024 & 2032
- Figure 11: Asia Pacific Unidirectional Tapes Industry Revenue (Million), by Adhesive Type 2024 & 2032
- Figure 12: Asia Pacific Unidirectional Tapes Industry Volume (Million), by Adhesive Type 2024 & 2032
- Figure 13: Asia Pacific Unidirectional Tapes Industry Revenue Share (%), by Adhesive Type 2024 & 2032
- Figure 14: Asia Pacific Unidirectional Tapes Industry Volume Share (%), by Adhesive Type 2024 & 2032
- Figure 15: Asia Pacific Unidirectional Tapes Industry Revenue (Million), by End-user Industry 2024 & 2032
- Figure 16: Asia Pacific Unidirectional Tapes Industry Volume (Million), by End-user Industry 2024 & 2032
- Figure 17: Asia Pacific Unidirectional Tapes Industry Revenue Share (%), by End-user Industry 2024 & 2032
- Figure 18: Asia Pacific Unidirectional Tapes Industry Volume Share (%), by End-user Industry 2024 & 2032
- Figure 19: Asia Pacific Unidirectional Tapes Industry Revenue (Million), by Country 2024 & 2032
- Figure 20: Asia Pacific Unidirectional Tapes Industry Volume (Million), by Country 2024 & 2032
- Figure 21: Asia Pacific Unidirectional Tapes Industry Revenue Share (%), by Country 2024 & 2032
- Figure 22: Asia Pacific Unidirectional Tapes Industry Volume Share (%), by Country 2024 & 2032
- Figure 23: North America Unidirectional Tapes Industry Revenue (Million), by Reinforcement Type 2024 & 2032
- Figure 24: North America Unidirectional Tapes Industry Volume (Million), by Reinforcement Type 2024 & 2032
- Figure 25: North America Unidirectional Tapes Industry Revenue Share (%), by Reinforcement Type 2024 & 2032
- Figure 26: North America Unidirectional Tapes Industry Volume Share (%), by Reinforcement Type 2024 & 2032
- Figure 27: North America Unidirectional Tapes Industry Revenue (Million), by Backing Material 2024 & 2032
- Figure 28: North America Unidirectional Tapes Industry Volume (Million), by Backing Material 2024 & 2032
- Figure 29: North America Unidirectional Tapes Industry Revenue Share (%), by Backing Material 2024 & 2032
- Figure 30: North America Unidirectional Tapes Industry Volume Share (%), by Backing Material 2024 & 2032
- Figure 31: North America Unidirectional Tapes Industry Revenue (Million), by Adhesive Type 2024 & 2032
- Figure 32: North America Unidirectional Tapes Industry Volume (Million), by Adhesive Type 2024 & 2032
- Figure 33: North America Unidirectional Tapes Industry Revenue Share (%), by Adhesive Type 2024 & 2032
- Figure 34: North America Unidirectional Tapes Industry Volume Share (%), by Adhesive Type 2024 & 2032
- Figure 35: North America Unidirectional Tapes Industry Revenue (Million), by End-user Industry 2024 & 2032
- Figure 36: North America Unidirectional Tapes Industry Volume (Million), by End-user Industry 2024 & 2032
- Figure 37: North America Unidirectional Tapes Industry Revenue Share (%), by End-user Industry 2024 & 2032
- Figure 38: North America Unidirectional Tapes Industry Volume Share (%), by End-user Industry 2024 & 2032
- Figure 39: North America Unidirectional Tapes Industry Revenue (Million), by Country 2024 & 2032
- Figure 40: North America Unidirectional Tapes Industry Volume (Million), by Country 2024 & 2032
- Figure 41: North America Unidirectional Tapes Industry Revenue Share (%), by Country 2024 & 2032
- Figure 42: North America Unidirectional Tapes Industry Volume Share (%), by Country 2024 & 2032
- Figure 43: Europe Unidirectional Tapes Industry Revenue (Million), by Reinforcement Type 2024 & 2032
- Figure 44: Europe Unidirectional Tapes Industry Volume (Million), by Reinforcement Type 2024 & 2032
- Figure 45: Europe Unidirectional Tapes Industry Revenue Share (%), by Reinforcement Type 2024 & 2032
- Figure 46: Europe Unidirectional Tapes Industry Volume Share (%), by Reinforcement Type 2024 & 2032
- Figure 47: Europe Unidirectional Tapes Industry Revenue (Million), by Backing Material 2024 & 2032
- Figure 48: Europe Unidirectional Tapes Industry Volume (Million), by Backing Material 2024 & 2032
- Figure 49: Europe Unidirectional Tapes Industry Revenue Share (%), by Backing Material 2024 & 2032
- Figure 50: Europe Unidirectional Tapes Industry Volume Share (%), by Backing Material 2024 & 2032
- Figure 51: Europe Unidirectional Tapes Industry Revenue (Million), by Adhesive Type 2024 & 2032
- Figure 52: Europe Unidirectional Tapes Industry Volume (Million), by Adhesive Type 2024 & 2032
- Figure 53: Europe Unidirectional Tapes Industry Revenue Share (%), by Adhesive Type 2024 & 2032
- Figure 54: Europe Unidirectional Tapes Industry Volume Share (%), by Adhesive Type 2024 & 2032
- Figure 55: Europe Unidirectional Tapes Industry Revenue (Million), by End-user Industry 2024 & 2032
- Figure 56: Europe Unidirectional Tapes Industry Volume (Million), by End-user Industry 2024 & 2032
- Figure 57: Europe Unidirectional Tapes Industry Revenue Share (%), by End-user Industry 2024 & 2032
- Figure 58: Europe Unidirectional Tapes Industry Volume Share (%), by End-user Industry 2024 & 2032
- Figure 59: Europe Unidirectional Tapes Industry Revenue (Million), by Country 2024 & 2032
- Figure 60: Europe Unidirectional Tapes Industry Volume (Million), by Country 2024 & 2032
- Figure 61: Europe Unidirectional Tapes Industry Revenue Share (%), by Country 2024 & 2032
- Figure 62: Europe Unidirectional Tapes Industry Volume Share (%), by Country 2024 & 2032
- Figure 63: South America Unidirectional Tapes Industry Revenue (Million), by Reinforcement Type 2024 & 2032
- Figure 64: South America Unidirectional Tapes Industry Volume (Million), by Reinforcement Type 2024 & 2032
- Figure 65: South America Unidirectional Tapes Industry Revenue Share (%), by Reinforcement Type 2024 & 2032
- Figure 66: South America Unidirectional Tapes Industry Volume Share (%), by Reinforcement Type 2024 & 2032
- Figure 67: South America Unidirectional Tapes Industry Revenue (Million), by Backing Material 2024 & 2032
- Figure 68: South America Unidirectional Tapes Industry Volume (Million), by Backing Material 2024 & 2032
- Figure 69: South America Unidirectional Tapes Industry Revenue Share (%), by Backing Material 2024 & 2032
- Figure 70: South America Unidirectional Tapes Industry Volume Share (%), by Backing Material 2024 & 2032
- Figure 71: South America Unidirectional Tapes Industry Revenue (Million), by Adhesive Type 2024 & 2032
- Figure 72: South America Unidirectional Tapes Industry Volume (Million), by Adhesive Type 2024 & 2032
- Figure 73: South America Unidirectional Tapes Industry Revenue Share (%), by Adhesive Type 2024 & 2032
- Figure 74: South America Unidirectional Tapes Industry Volume Share (%), by Adhesive Type 2024 & 2032
- Figure 75: South America Unidirectional Tapes Industry Revenue (Million), by End-user Industry 2024 & 2032
- Figure 76: South America Unidirectional Tapes Industry Volume (Million), by End-user Industry 2024 & 2032
- Figure 77: South America Unidirectional Tapes Industry Revenue Share (%), by End-user Industry 2024 & 2032
- Figure 78: South America Unidirectional Tapes Industry Volume Share (%), by End-user Industry 2024 & 2032
- Figure 79: South America Unidirectional Tapes Industry Revenue (Million), by Country 2024 & 2032
- Figure 80: South America Unidirectional Tapes Industry Volume (Million), by Country 2024 & 2032
- Figure 81: South America Unidirectional Tapes Industry Revenue Share (%), by Country 2024 & 2032
- Figure 82: South America Unidirectional Tapes Industry Volume Share (%), by Country 2024 & 2032
- Figure 83: Middle East and Africa Unidirectional Tapes Industry Revenue (Million), by Reinforcement Type 2024 & 2032
- Figure 84: Middle East and Africa Unidirectional Tapes Industry Volume (Million), by Reinforcement Type 2024 & 2032
- Figure 85: Middle East and Africa Unidirectional Tapes Industry Revenue Share (%), by Reinforcement Type 2024 & 2032
- Figure 86: Middle East and Africa Unidirectional Tapes Industry Volume Share (%), by Reinforcement Type 2024 & 2032
- Figure 87: Middle East and Africa Unidirectional Tapes Industry Revenue (Million), by Backing Material 2024 & 2032
- Figure 88: Middle East and Africa Unidirectional Tapes Industry Volume (Million), by Backing Material 2024 & 2032
- Figure 89: Middle East and Africa Unidirectional Tapes Industry Revenue Share (%), by Backing Material 2024 & 2032
- Figure 90: Middle East and Africa Unidirectional Tapes Industry Volume Share (%), by Backing Material 2024 & 2032
- Figure 91: Middle East and Africa Unidirectional Tapes Industry Revenue (Million), by Adhesive Type 2024 & 2032
- Figure 92: Middle East and Africa Unidirectional Tapes Industry Volume (Million), by Adhesive Type 2024 & 2032
- Figure 93: Middle East and Africa Unidirectional Tapes Industry Revenue Share (%), by Adhesive Type 2024 & 2032
- Figure 94: Middle East and Africa Unidirectional Tapes Industry Volume Share (%), by Adhesive Type 2024 & 2032
- Figure 95: Middle East and Africa Unidirectional Tapes Industry Revenue (Million), by End-user Industry 2024 & 2032
- Figure 96: Middle East and Africa Unidirectional Tapes Industry Volume (Million), by End-user Industry 2024 & 2032
- Figure 97: Middle East and Africa Unidirectional Tapes Industry Revenue Share (%), by End-user Industry 2024 & 2032
- Figure 98: Middle East and Africa Unidirectional Tapes Industry Volume Share (%), by End-user Industry 2024 & 2032
- Figure 99: Middle East and Africa Unidirectional Tapes Industry Revenue (Million), by Country 2024 & 2032
- Figure 100: Middle East and Africa Unidirectional Tapes Industry Volume (Million), by Country 2024 & 2032
- Figure 101: Middle East and Africa Unidirectional Tapes Industry Revenue Share (%), by Country 2024 & 2032
- Figure 102: Middle East and Africa Unidirectional Tapes Industry Volume Share (%), by Country 2024 & 2032
List of Tables
- Table 1: Global Unidirectional Tapes Industry Revenue Million Forecast, by Region 2019 & 2032
- Table 2: Global Unidirectional Tapes Industry Volume Million Forecast, by Region 2019 & 2032
- Table 3: Global Unidirectional Tapes Industry Revenue Million Forecast, by Reinforcement Type 2019 & 2032
- Table 4: Global Unidirectional Tapes Industry Volume Million Forecast, by Reinforcement Type 2019 & 2032
- Table 5: Global Unidirectional Tapes Industry Revenue Million Forecast, by Backing Material 2019 & 2032
- Table 6: Global Unidirectional Tapes Industry Volume Million Forecast, by Backing Material 2019 & 2032
- Table 7: Global Unidirectional Tapes Industry Revenue Million Forecast, by Adhesive Type 2019 & 2032
- Table 8: Global Unidirectional Tapes Industry Volume Million Forecast, by Adhesive Type 2019 & 2032
- Table 9: Global Unidirectional Tapes Industry Revenue Million Forecast, by End-user Industry 2019 & 2032
- Table 10: Global Unidirectional Tapes Industry Volume Million Forecast, by End-user Industry 2019 & 2032
- Table 11: Global Unidirectional Tapes Industry Revenue Million Forecast, by Region 2019 & 2032
- Table 12: Global Unidirectional Tapes Industry Volume Million Forecast, by Region 2019 & 2032
- Table 13: Global Unidirectional Tapes Industry Revenue Million Forecast, by Reinforcement Type 2019 & 2032
- Table 14: Global Unidirectional Tapes Industry Volume Million Forecast, by Reinforcement Type 2019 & 2032
- Table 15: Global Unidirectional Tapes Industry Revenue Million Forecast, by Backing Material 2019 & 2032
- Table 16: Global Unidirectional Tapes Industry Volume Million Forecast, by Backing Material 2019 & 2032
- Table 17: Global Unidirectional Tapes Industry Revenue Million Forecast, by Adhesive Type 2019 & 2032
- Table 18: Global Unidirectional Tapes Industry Volume Million Forecast, by Adhesive Type 2019 & 2032
- Table 19: Global Unidirectional Tapes Industry Revenue Million Forecast, by End-user Industry 2019 & 2032
- Table 20: Global Unidirectional Tapes Industry Volume Million Forecast, by End-user Industry 2019 & 2032
- Table 21: Global Unidirectional Tapes Industry Revenue Million Forecast, by Country 2019 & 2032
- Table 22: Global Unidirectional Tapes Industry Volume Million Forecast, by Country 2019 & 2032
- Table 23: China Unidirectional Tapes Industry Revenue (Million) Forecast, by Application 2019 & 2032
- Table 24: China Unidirectional Tapes Industry Volume (Million) Forecast, by Application 2019 & 2032
- Table 25: India Unidirectional Tapes Industry Revenue (Million) Forecast, by Application 2019 & 2032
- Table 26: India Unidirectional Tapes Industry Volume (Million) Forecast, by Application 2019 & 2032
- Table 27: Japan Unidirectional Tapes Industry Revenue (Million) Forecast, by Application 2019 & 2032
- Table 28: Japan Unidirectional Tapes Industry Volume (Million) Forecast, by Application 2019 & 2032
- Table 29: South Korea Unidirectional Tapes Industry Revenue (Million) Forecast, by Application 2019 & 2032
- Table 30: South Korea Unidirectional Tapes Industry Volume (Million) Forecast, by Application 2019 & 2032
- Table 31: Rest of Asia Pacific Unidirectional Tapes Industry Revenue (Million) Forecast, by Application 2019 & 2032
- Table 32: Rest of Asia Pacific Unidirectional Tapes Industry Volume (Million) Forecast, by Application 2019 & 2032
- Table 33: Global Unidirectional Tapes Industry Revenue Million Forecast, by Reinforcement Type 2019 & 2032
- Table 34: Global Unidirectional Tapes Industry Volume Million Forecast, by Reinforcement Type 2019 & 2032
- Table 35: Global Unidirectional Tapes Industry Revenue Million Forecast, by Backing Material 2019 & 2032
- Table 36: Global Unidirectional Tapes Industry Volume Million Forecast, by Backing Material 2019 & 2032
- Table 37: Global Unidirectional Tapes Industry Revenue Million Forecast, by Adhesive Type 2019 & 2032
- Table 38: Global Unidirectional Tapes Industry Volume Million Forecast, by Adhesive Type 2019 & 2032
- Table 39: Global Unidirectional Tapes Industry Revenue Million Forecast, by End-user Industry 2019 & 2032
- Table 40: Global Unidirectional Tapes Industry Volume Million Forecast, by End-user Industry 2019 & 2032
- Table 41: Global Unidirectional Tapes Industry Revenue Million Forecast, by Country 2019 & 2032
- Table 42: Global Unidirectional Tapes Industry Volume Million Forecast, by Country 2019 & 2032
- Table 43: United States Unidirectional Tapes Industry Revenue (Million) Forecast, by Application 2019 & 2032
- Table 44: United States Unidirectional Tapes Industry Volume (Million) Forecast, by Application 2019 & 2032
- Table 45: Canada Unidirectional Tapes Industry Revenue (Million) Forecast, by Application 2019 & 2032
- Table 46: Canada Unidirectional Tapes Industry Volume (Million) Forecast, by Application 2019 & 2032
- Table 47: Mexico Unidirectional Tapes Industry Revenue (Million) Forecast, by Application 2019 & 2032
- Table 48: Mexico Unidirectional Tapes Industry Volume (Million) Forecast, by Application 2019 & 2032
- Table 49: Global Unidirectional Tapes Industry Revenue Million Forecast, by Reinforcement Type 2019 & 2032
- Table 50: Global Unidirectional Tapes Industry Volume Million Forecast, by Reinforcement Type 2019 & 2032
- Table 51: Global Unidirectional Tapes Industry Revenue Million Forecast, by Backing Material 2019 & 2032
- Table 52: Global Unidirectional Tapes Industry Volume Million Forecast, by Backing Material 2019 & 2032
- Table 53: Global Unidirectional Tapes Industry Revenue Million Forecast, by Adhesive Type 2019 & 2032
- Table 54: Global Unidirectional Tapes Industry Volume Million Forecast, by Adhesive Type 2019 & 2032
- Table 55: Global Unidirectional Tapes Industry Revenue Million Forecast, by End-user Industry 2019 & 2032
- Table 56: Global Unidirectional Tapes Industry Volume Million Forecast, by End-user Industry 2019 & 2032
- Table 57: Global Unidirectional Tapes Industry Revenue Million Forecast, by Country 2019 & 2032
- Table 58: Global Unidirectional Tapes Industry Volume Million Forecast, by Country 2019 & 2032
- Table 59: Germany Unidirectional Tapes Industry Revenue (Million) Forecast, by Application 2019 & 2032
- Table 60: Germany Unidirectional Tapes Industry Volume (Million) Forecast, by Application 2019 & 2032
- Table 61: United Kingdom Unidirectional Tapes Industry Revenue (Million) Forecast, by Application 2019 & 2032
- Table 62: United Kingdom Unidirectional Tapes Industry Volume (Million) Forecast, by Application 2019 & 2032
- Table 63: France Unidirectional Tapes Industry Revenue (Million) Forecast, by Application 2019 & 2032
- Table 64: France Unidirectional Tapes Industry Volume (Million) Forecast, by Application 2019 & 2032
- Table 65: Italy Unidirectional Tapes Industry Revenue (Million) Forecast, by Application 2019 & 2032
- Table 66: Italy Unidirectional Tapes Industry Volume (Million) Forecast, by Application 2019 & 2032
- Table 67: Rest of Europe Unidirectional Tapes Industry Revenue (Million) Forecast, by Application 2019 & 2032
- Table 68: Rest of Europe Unidirectional Tapes Industry Volume (Million) Forecast, by Application 2019 & 2032
- Table 69: Global Unidirectional Tapes Industry Revenue Million Forecast, by Reinforcement Type 2019 & 2032
- Table 70: Global Unidirectional Tapes Industry Volume Million Forecast, by Reinforcement Type 2019 & 2032
- Table 71: Global Unidirectional Tapes Industry Revenue Million Forecast, by Backing Material 2019 & 2032
- Table 72: Global Unidirectional Tapes Industry Volume Million Forecast, by Backing Material 2019 & 2032
- Table 73: Global Unidirectional Tapes Industry Revenue Million Forecast, by Adhesive Type 2019 & 2032
- Table 74: Global Unidirectional Tapes Industry Volume Million Forecast, by Adhesive Type 2019 & 2032
- Table 75: Global Unidirectional Tapes Industry Revenue Million Forecast, by End-user Industry 2019 & 2032
- Table 76: Global Unidirectional Tapes Industry Volume Million Forecast, by End-user Industry 2019 & 2032
- Table 77: Global Unidirectional Tapes Industry Revenue Million Forecast, by Country 2019 & 2032
- Table 78: Global Unidirectional Tapes Industry Volume Million Forecast, by Country 2019 & 2032
- Table 79: Brazil Unidirectional Tapes Industry Revenue (Million) Forecast, by Application 2019 & 2032
- Table 80: Brazil Unidirectional Tapes Industry Volume (Million) Forecast, by Application 2019 & 2032
- Table 81: Argentina Unidirectional Tapes Industry Revenue (Million) Forecast, by Application 2019 & 2032
- Table 82: Argentina Unidirectional Tapes Industry Volume (Million) Forecast, by Application 2019 & 2032
- Table 83: Rest of South America Unidirectional Tapes Industry Revenue (Million) Forecast, by Application 2019 & 2032
- Table 84: Rest of South America Unidirectional Tapes Industry Volume (Million) Forecast, by Application 2019 & 2032
- Table 85: Global Unidirectional Tapes Industry Revenue Million Forecast, by Reinforcement Type 2019 & 2032
- Table 86: Global Unidirectional Tapes Industry Volume Million Forecast, by Reinforcement Type 2019 & 2032
- Table 87: Global Unidirectional Tapes Industry Revenue Million Forecast, by Backing Material 2019 & 2032
- Table 88: Global Unidirectional Tapes Industry Volume Million Forecast, by Backing Material 2019 & 2032
- Table 89: Global Unidirectional Tapes Industry Revenue Million Forecast, by Adhesive Type 2019 & 2032
- Table 90: Global Unidirectional Tapes Industry Volume Million Forecast, by Adhesive Type 2019 & 2032
- Table 91: Global Unidirectional Tapes Industry Revenue Million Forecast, by End-user Industry 2019 & 2032
- Table 92: Global Unidirectional Tapes Industry Volume Million Forecast, by End-user Industry 2019 & 2032
- Table 93: Global Unidirectional Tapes Industry Revenue Million Forecast, by Country 2019 & 2032
- Table 94: Global Unidirectional Tapes Industry Volume Million Forecast, by Country 2019 & 2032
- Table 95: Saudi Arabia Unidirectional Tapes Industry Revenue (Million) Forecast, by Application 2019 & 2032
- Table 96: Saudi Arabia Unidirectional Tapes Industry Volume (Million) Forecast, by Application 2019 & 2032
- Table 97: South Africa Unidirectional Tapes Industry Revenue (Million) Forecast, by Application 2019 & 2032
- Table 98: South Africa Unidirectional Tapes Industry Volume (Million) Forecast, by Application 2019 & 2032
- Table 99: Rest of Middle East and Africa Unidirectional Tapes Industry Revenue (Million) Forecast, by Application 2019 & 2032
- Table 100: Rest of Middle East and Africa Unidirectional Tapes Industry Volume (Million) Forecast, by Application 2019 & 2032
Frequently Asked Questions
1. What is the projected Compound Annual Growth Rate (CAGR) of the Unidirectional Tapes Industry?
The projected CAGR is approximately 10.51%.
2. Which companies are prominent players in the Unidirectional Tapes Industry?
Key companies in the market include BUFA Thermoplastic Composites GmbH & Co KG, Celanese Corporation, Evonik Industries AG, Hexcel Corporation, Mitsui Chemicals Inc, Oxeon AB (TeXtreme), Plastic Reinforcement Fabrics Ltd, SABIC, SGL Carbon, Solvay, TCR Composites Inc, TEIJIN LIMITED, TOPOLO New Materials, TORAY INDUSTRIES INC, Victrex plc*List Not Exhaustive.
3. What are the main segments of the Unidirectional Tapes Industry?
The market segments include Reinforcement Type, Backing Material, Adhesive Type, End-user Industry.
4. Can you provide details about the market size?
The market size is estimated to be USD 386.83 Million as of 2022.
5. What are some drivers contributing to market growth?
Growing Demand from the Aerospace and Defense Industry; Rising Usage of Unidirectional Tape in the Wind and Automotive Industries.
6. What are the notable trends driving market growth?
Growing Demand from the Aerospace and Defense Industry.
7. Are there any restraints impacting market growth?
Growing Demand from the Aerospace and Defense Industry; Rising Usage of Unidirectional Tape in the Wind and Automotive Industries.
8. Can you provide examples of recent developments in the market?
In January 2022, Evonik Industries AG was awarded certification from DNV as its unidirectional tape VESTAPE PA12-CF (PA12) became suitable for dynamic sweet and sour hydrocarbons, water, and gas injection applications according to DNV-ST-F119.
9. What pricing options are available for accessing the report?
Pricing options include single-user, multi-user, and enterprise licenses priced at USD 4750, USD 5250, and USD 8750 respectively.
10. Is the market size provided in terms of value or volume?
The market size is provided in terms of value, measured in Million and volume, measured in Million.
11. Are there any specific market keywords associated with the report?
Yes, the market keyword associated with the report is "Unidirectional Tapes Industry," which aids in identifying and referencing the specific market segment covered.
12. How do I determine which pricing option suits my needs best?
The pricing options vary based on user requirements and access needs. Individual users may opt for single-user licenses, while businesses requiring broader access may choose multi-user or enterprise licenses for cost-effective access to the report.
13. Are there any additional resources or data provided in the Unidirectional Tapes Industry report?
While the report offers comprehensive insights, it's advisable to review the specific contents or supplementary materials provided to ascertain if additional resources or data are available.
14. How can I stay updated on further developments or reports in the Unidirectional Tapes Industry?
To stay informed about further developments, trends, and reports in the Unidirectional Tapes Industry, consider subscribing to industry newsletters, following relevant companies and organizations, or regularly checking reputable industry news sources and publications.
Methodology
Step 1 - Identification of Relevant Samples Size from Population Database


Step 2 - Approaches for Defining Global Market Size (Value, Volume* & Price*)

Note*: In applicable scenarios
Step 3 - Data Sources
Primary Research
- Web Analytics
- Survey Reports
- Research Institute
- Latest Research Reports
- Opinion Leaders
Secondary Research
- Annual Reports
- White Paper
- Latest Press Release
- Industry Association
- Paid Database
- Investor Presentations

Step 4 - Data Triangulation
Involves using different sources of information in order to increase the validity of a study
These sources are likely to be stakeholders in a program - participants, other researchers, program staff, other community members, and so on.
Then we put all data in single framework & apply various statistical tools to find out the dynamic on the market.
During the analysis stage, feedback from the stakeholder groups would be compared to determine areas of agreement as well as areas of divergence


