
Key Insights
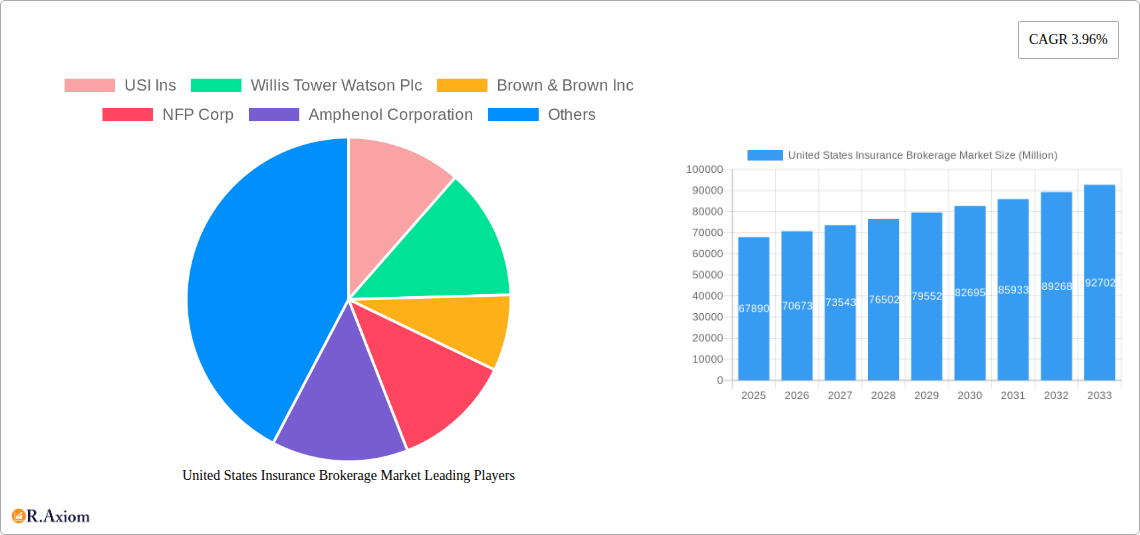
The United States insurance brokerage market, valued at $67.89 billion in 2025, is projected to experience steady growth, driven by several key factors. The increasing complexity of insurance products and the rising demand for specialized risk management solutions are fueling the need for professional brokerage services. Technological advancements, such as the adoption of InsurTech solutions and digital platforms, are streamlining operations and improving efficiency, further boosting market expansion. Furthermore, a growing awareness of risk mitigation strategies among businesses and individuals is contributing to increased demand for insurance brokerage services. The market is segmented by insurance type (Life Insurance, Property & Casualty Insurance) and brokerage type (Retail Brokerage, Wholesale Brokerage). While retail brokerage caters to individual clients, wholesale brokerage focuses on providing services to other insurance agents and brokers. Major players like USI Insurance Services, Willis Towers Watson, Brown & Brown, NFP Corp, Aon, and Marsh & McLennan Companies dominate the market, leveraging their extensive networks and expertise to secure market share. Competition is fierce, with companies investing in mergers and acquisitions, technological upgrades, and expanding service offerings to gain a competitive edge.
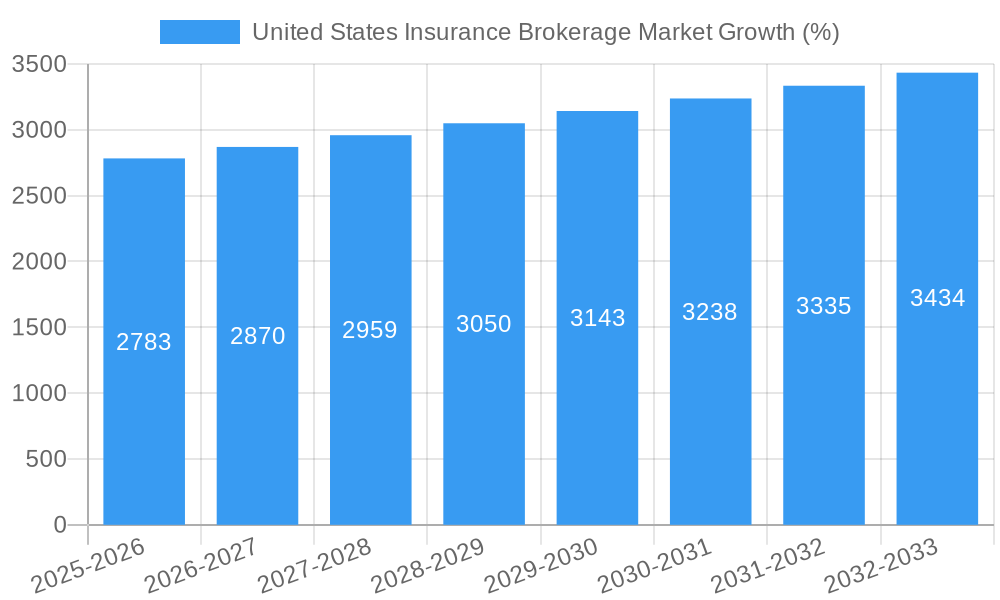
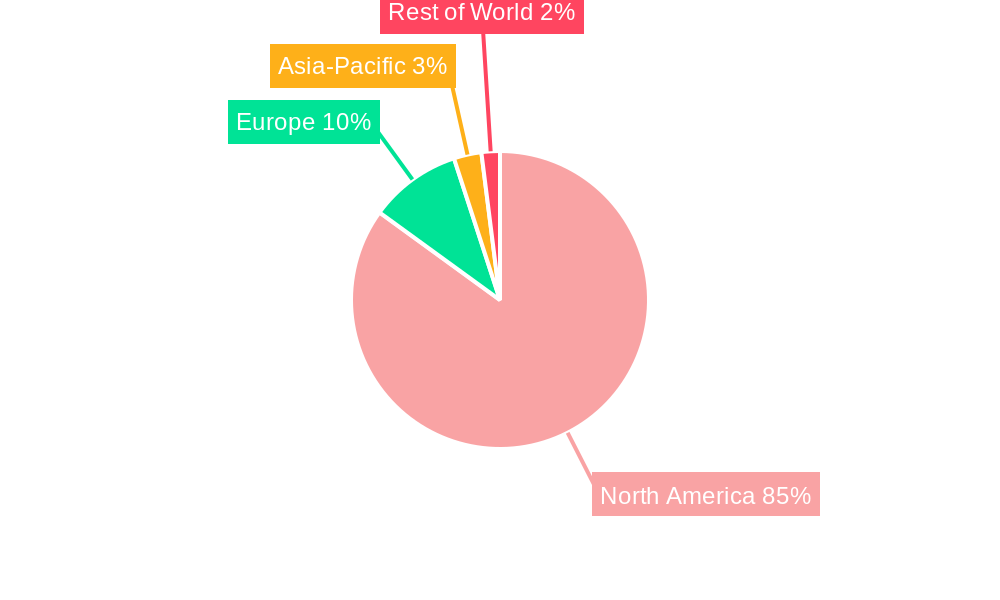
The projected Compound Annual Growth Rate (CAGR) of 3.96% from 2025 to 2033 suggests a continuous, albeit moderate, expansion of the market. This growth will likely be influenced by economic conditions, regulatory changes, and shifts in consumer preferences. The market's historical performance (2019-2024) indicates a stable trajectory, suggesting a consistent demand for insurance brokerage services across various economic cycles. This stable growth is expected to continue, with the market potentially exceeding $90 billion by 2033. The U.S. market's dominance reflects its robust economy, advanced insurance infrastructure, and high insurance penetration rates. However, challenges such as increasing regulatory scrutiny and evolving cybersecurity threats could potentially influence the market's growth trajectory.
United States Insurance Brokerage Market: A Comprehensive Report (2019-2033)
This comprehensive report provides an in-depth analysis of the United States insurance brokerage market, covering the period from 2019 to 2033. It offers a detailed examination of market size, segmentation, growth drivers, challenges, competitive landscape, and future outlook. This report is essential for industry stakeholders, investors, and anyone seeking to understand the dynamics of this crucial sector. The report utilizes data from 2019-2024 as its historical period, 2025 as the base and estimated year, and 2025-2033 as its forecast period.
United States Insurance Brokerage Market Market Concentration & Innovation
The US insurance brokerage market is characterized by a moderate level of concentration, with a few major players holding significant market share. While precise market share figures for each company fluctuate annually, the top 10 players consistently account for a substantial portion (estimated at 60-65%) of the total market revenue. This concentration is driven by economies of scale, strong brand recognition, and extensive client networks. However, the market also displays a significant degree of innovation, spurred by technological advancements and evolving customer needs.
Market Share: Aon Plc, Marsh & McLennan Companies Inc, and Willis Towers Watson Plc consistently rank among the top three, though precise percentages vary annually and are subject to ongoing M&A activity. The remaining top 10 players, including USI Insurance Services, Brown & Brown Inc, Arthur J. Gallagher & Co, NFP Corp, and Hub International Ltd., hold varying, significant market share percentages. Smaller, niche players continue to thrive by specializing in particular insurance types or industry sectors.
Innovation Drivers: Technological advancements, particularly in data analytics and InsurTech, are driving market innovation. The adoption of AI, machine learning, and blockchain technology promises to enhance efficiency, improve risk assessment, and personalize customer experiences. These technologies also facilitate the development of new products and services.
M&A Activity: The insurance brokerage sector witnesses frequent mergers and acquisitions (M&A). Deal values vary significantly, ranging from tens of Millions to billions of Millions of dollars depending on the size and strategic importance of the acquired entity. These activities consolidate market share, broaden service offerings, and expand geographical reach. The xx Million average annual M&A deal value across the period is a strong indicator of industry consolidation.
Regulatory Framework: Stringent regulatory requirements, particularly concerning data privacy and consumer protection, shape market dynamics. These regulations influence how companies operate and innovate within the market.
Product Substitutes: While traditional insurance brokerage services remain prevalent, alternative risk transfer mechanisms and self-insurance options present some degree of substitution. The growing sophistication of these substitutes, particularly within large corporations, is creating challenges to the traditional brokerage model.
End-User Trends: Increasing demand for specialized insurance solutions, coupled with a preference for digital interactions and personalized services, is driving market evolution. The focus is shifting towards providing comprehensive risk management solutions rather than merely placing insurance policies.
United States Insurance Brokerage Market Industry Trends & Insights
The US insurance brokerage market is experiencing robust growth, driven by a confluence of factors. The market's Compound Annual Growth Rate (CAGR) during the historical period (2019-2024) was approximately xx%, and is projected to remain strong at approximately xx% during the forecast period (2025-2033).
Market penetration of insurance brokerage services across various sectors remains high, with consistent demand from businesses of all sizes. This high penetration is maintained despite the availability of alternative risk financing methods. Increased awareness of risk management and the growing complexity of insurance products contribute significantly to the continued reliance on professional brokerage services.
Technological disruptions, such as the rise of InsurTech companies and the increased adoption of digital platforms, are reshaping the industry. These disruptions are forcing traditional brokers to adapt by integrating new technologies and streamlining operations. Customer preferences, meanwhile, are evolving toward greater transparency, personalized service, and digital-first interactions.
Competitive dynamics are intensifying, with established players facing pressure from both smaller, agile InsurTech firms and larger global players. This pressure is leading to strategic partnerships, acquisitions, and investments in technological advancements. The market also observes several factors influencing growth trajectories, including economic cycles, regulatory changes, and emerging societal risks (such as climate change).
Dominant Markets & Segments in United States Insurance Brokerage Market
The US insurance brokerage market is geographically diverse, with no single region exhibiting overwhelming dominance. However, certain states with large business concentrations and high insurance demand (e.g., California, New York, Texas, and Florida) consistently demonstrate higher market volumes. The dominant segment in terms of revenue is Property & Casualty Insurance.
Insurance Type:
Property & Casualty Insurance: This segment holds the largest market share, driven by the broad range of risks covered and consistently high demand from businesses and individuals. Key drivers include economic growth, real estate activity, and fluctuating risk landscapes (e.g., natural disasters).
Life Insurance: While smaller than the Property & Casualty segment, the life insurance brokerage market maintains significant size and steady growth. The demand stems from individual needs for financial protection and estate planning. Economic conditions and demographic changes are key factors shaping demand.
Brokerage Type:
Retail Brokerage: This segment serves individual clients and smaller businesses, and represents a larger market segment than wholesale brokerage. Ease of access and personalized service are critical for this segment.
Wholesale Brokerage: Focusing on larger companies and complex risk management needs, this segment requires specialized expertise and often involves placing insurance through multiple insurers simultaneously. Specialized knowledge and strong insurer relationships are essential.
United States Insurance Brokerage Market Product Developments
Recent product innovations focus on digital platforms integrating data analytics, AI-powered risk assessment tools, and customized insurance solutions tailored to specific customer needs. These developments provide competitive advantages by enhancing efficiency, improving risk management, and delivering personalized service. The market also witnesses the emergence of innovative insurance products addressing emerging risks, particularly in cyber security and climate change.
Report Scope & Segmentation Analysis
This report segments the US insurance brokerage market by insurance type (Life Insurance, Property & Casualty Insurance) and brokerage type (Retail Brokerage, Wholesale Brokerage). Each segment’s growth is projected based on historical trends, current market conditions, and future forecasts. Competitive dynamics within each segment vary significantly; some exhibit greater consolidation, while others maintain a more fragmented landscape. Market sizes are detailed for each segment, providing a granular understanding of the market structure and projected growth.
Key Drivers of United States Insurance Brokerage Market Growth
Several factors drive growth within the US insurance brokerage market. These include robust economic growth leading to increased demand for insurance across various sectors; rising awareness of risk management among businesses and individuals; technological advancements improving operational efficiency and product offerings; and regulatory changes emphasizing consumer protection and transparency.
Challenges in the United States Insurance Brokerage Market Sector
The US insurance brokerage sector faces certain challenges. Increasing regulatory scrutiny and compliance costs pose significant hurdles, while maintaining profitability in a competitive environment is an ongoing concern. Supply chain disruptions and the availability of skilled professionals can also impact operational efficiency and service delivery.
Emerging Opportunities in United States Insurance Brokerage Market
The increasing adoption of InsurTech solutions, expanding into niche markets (e.g., cyber insurance, climate risk management), and offering specialized risk management services present significant growth opportunities. Moreover, the continued evolution of customer preferences and demands will shape new market niches.
Leading Players in the United States Insurance Brokerage Market Market
- USI Ins
- Willis Tower Watson Plc
- Brown & Brown Inc
- NFP Corp
- Amphenol Corporation
- Aon Plc
- Ameritrust Group Inc
- Arthur J Gallagher & Co
- Hub International Ltd
- Marsh & Mclennan Companies Inc
Key Developments in United States Insurance Brokerage Market Industry
June 2023: Marsh McLennan Agency acquired SOLV Risk Solutions, LLC, expanding its presence in the Texas market. This acquisition strengthens its position in the region and broadens its service offerings.
March 2022: Aon Plc acquired the actuarial software platform Tyche, enhancing its technological capabilities and improving client service through advanced data analytics.
Strategic Outlook for United States Insurance Brokerage Market Market
The US insurance brokerage market is poised for continued growth, driven by a combination of strong economic fundamentals, technological advancements, and evolving customer needs. Strategic investments in technology, expansion into new markets, and the development of innovative risk management solutions are key catalysts for future success. The market's long-term prospects remain positive, with considerable opportunities for both established players and emerging InsurTech firms.
United States Insurance Brokerage Market Segmentation
-
1. Insurance Type
- 1.1. Life Insurance
- 1.2. Property & Casualty Insurance
-
2. Brokerage Type
- 2.1. Retail Brokerage
- 2.2. Wholesale Brokerage
United States Insurance Brokerage Market Segmentation By Geography
- 1. United States
United States Insurance Brokerage Market REPORT HIGHLIGHTS
| Aspects | Details |
|---|---|
| Study Period | 2019-2033 |
| Base Year | 2024 |
| Estimated Year | 2025 |
| Forecast Period | 2025-2033 |
| Historical Period | 2019-2024 |
| Growth Rate | CAGR of 3.96% from 2019-2033 |
| Segmentation |
|
Table of Contents
- 1. Introduction
- 1.1. Research Scope
- 1.2. Market Segmentation
- 1.3. Research Methodology
- 1.4. Definitions and Assumptions
- 2. Executive Summary
- 2.1. Introduction
- 3. Market Dynamics
- 3.1. Introduction
- 3.2. Market Drivers
- 3.2.1. Increasing Demand for Life Insurance is Driving the Market; Increasing Digital Adoption in the Insurance Industry is Driving the Market
- 3.3. Market Restrains
- 3.3.1. Increasing Cost Acts as a Restraint to the Market
- 3.4. Market Trends
- 3.4.1. Increasing Merger & Acquisition Deals in Insurance Brokerage Market
- 4. Market Factor Analysis
- 4.1. Porters Five Forces
- 4.2. Supply/Value Chain
- 4.3. PESTEL analysis
- 4.4. Market Entropy
- 4.5. Patent/Trademark Analysis
- 5. United States Insurance Brokerage Market Analysis, Insights and Forecast, 2019-2031
- 5.1. Market Analysis, Insights and Forecast - by Insurance Type
- 5.1.1. Life Insurance
- 5.1.2. Property & Casualty Insurance
- 5.2. Market Analysis, Insights and Forecast - by Brokerage Type
- 5.2.1. Retail Brokerage
- 5.2.2. Wholesale Brokerage
- 5.3. Market Analysis, Insights and Forecast - by Region
- 5.3.1. United States
- 5.1. Market Analysis, Insights and Forecast - by Insurance Type
- 6. Competitive Analysis
- 6.1. Market Share Analysis 2024
- 6.2. Company Profiles
- 6.2.1 USI Ins
- 6.2.1.1. Overview
- 6.2.1.2. Products
- 6.2.1.3. SWOT Analysis
- 6.2.1.4. Recent Developments
- 6.2.1.5. Financials (Based on Availability)
- 6.2.2 Willis Tower Watson Plc
- 6.2.2.1. Overview
- 6.2.2.2. Products
- 6.2.2.3. SWOT Analysis
- 6.2.2.4. Recent Developments
- 6.2.2.5. Financials (Based on Availability)
- 6.2.3 Brown & Brown Inc
- 6.2.3.1. Overview
- 6.2.3.2. Products
- 6.2.3.3. SWOT Analysis
- 6.2.3.4. Recent Developments
- 6.2.3.5. Financials (Based on Availability)
- 6.2.4 NFP Corp
- 6.2.4.1. Overview
- 6.2.4.2. Products
- 6.2.4.3. SWOT Analysis
- 6.2.4.4. Recent Developments
- 6.2.4.5. Financials (Based on Availability)
- 6.2.5 Amphenol Corporation
- 6.2.5.1. Overview
- 6.2.5.2. Products
- 6.2.5.3. SWOT Analysis
- 6.2.5.4. Recent Developments
- 6.2.5.5. Financials (Based on Availability)
- 6.2.6 Aon Plc
- 6.2.6.1. Overview
- 6.2.6.2. Products
- 6.2.6.3. SWOT Analysis
- 6.2.6.4. Recent Developments
- 6.2.6.5. Financials (Based on Availability)
- 6.2.7 Ameritrust Group Inc
- 6.2.7.1. Overview
- 6.2.7.2. Products
- 6.2.7.3. SWOT Analysis
- 6.2.7.4. Recent Developments
- 6.2.7.5. Financials (Based on Availability)
- 6.2.8 Arthur J Gallagher & Co
- 6.2.8.1. Overview
- 6.2.8.2. Products
- 6.2.8.3. SWOT Analysis
- 6.2.8.4. Recent Developments
- 6.2.8.5. Financials (Based on Availability)
- 6.2.9 Hub International Ltd
- 6.2.9.1. Overview
- 6.2.9.2. Products
- 6.2.9.3. SWOT Analysis
- 6.2.9.4. Recent Developments
- 6.2.9.5. Financials (Based on Availability)
- 6.2.10 Marsh & Mclennan Companies Inc
- 6.2.10.1. Overview
- 6.2.10.2. Products
- 6.2.10.3. SWOT Analysis
- 6.2.10.4. Recent Developments
- 6.2.10.5. Financials (Based on Availability)
- 6.2.1 USI Ins
List of Figures
- Figure 1: United States Insurance Brokerage Market Revenue Breakdown (Million, %) by Product 2024 & 2032
- Figure 2: United States Insurance Brokerage Market Share (%) by Company 2024
List of Tables
- Table 1: United States Insurance Brokerage Market Revenue Million Forecast, by Region 2019 & 2032
- Table 2: United States Insurance Brokerage Market Revenue Million Forecast, by Insurance Type 2019 & 2032
- Table 3: United States Insurance Brokerage Market Revenue Million Forecast, by Brokerage Type 2019 & 2032
- Table 4: United States Insurance Brokerage Market Revenue Million Forecast, by Region 2019 & 2032
- Table 5: United States Insurance Brokerage Market Revenue Million Forecast, by Country 2019 & 2032
- Table 6: United States Insurance Brokerage Market Revenue Million Forecast, by Insurance Type 2019 & 2032
- Table 7: United States Insurance Brokerage Market Revenue Million Forecast, by Brokerage Type 2019 & 2032
- Table 8: United States Insurance Brokerage Market Revenue Million Forecast, by Country 2019 & 2032
Frequently Asked Questions
1. What is the projected Compound Annual Growth Rate (CAGR) of the United States Insurance Brokerage Market?
The projected CAGR is approximately 3.96%.
2. Which companies are prominent players in the United States Insurance Brokerage Market?
Key companies in the market include USI Ins, Willis Tower Watson Plc, Brown & Brown Inc, NFP Corp, Amphenol Corporation, Aon Plc, Ameritrust Group Inc, Arthur J Gallagher & Co, Hub International Ltd, Marsh & Mclennan Companies Inc.
3. What are the main segments of the United States Insurance Brokerage Market?
The market segments include Insurance Type, Brokerage Type.
4. Can you provide details about the market size?
The market size is estimated to be USD 67.89 Million as of 2022.
5. What are some drivers contributing to market growth?
Increasing Demand for Life Insurance is Driving the Market; Increasing Digital Adoption in the Insurance Industry is Driving the Market.
6. What are the notable trends driving market growth?
Increasing Merger & Acquisition Deals in Insurance Brokerage Market.
7. Are there any restraints impacting market growth?
Increasing Cost Acts as a Restraint to the Market.
8. Can you provide examples of recent developments in the market?
June 2023: Marsh McLennan Agency, a subsidiary of Marsh, announced the acquisition of SOLV Risk Solutions, LLC, a leading independent agency based in Austin, Texas.
9. What pricing options are available for accessing the report?
Pricing options include single-user, multi-user, and enterprise licenses priced at USD 3800, USD 4500, and USD 5800 respectively.
10. Is the market size provided in terms of value or volume?
The market size is provided in terms of value, measured in Million.
11. Are there any specific market keywords associated with the report?
Yes, the market keyword associated with the report is "United States Insurance Brokerage Market," which aids in identifying and referencing the specific market segment covered.
12. How do I determine which pricing option suits my needs best?
The pricing options vary based on user requirements and access needs. Individual users may opt for single-user licenses, while businesses requiring broader access may choose multi-user or enterprise licenses for cost-effective access to the report.
13. Are there any additional resources or data provided in the United States Insurance Brokerage Market report?
While the report offers comprehensive insights, it's advisable to review the specific contents or supplementary materials provided to ascertain if additional resources or data are available.
14. How can I stay updated on further developments or reports in the United States Insurance Brokerage Market?
To stay informed about further developments, trends, and reports in the United States Insurance Brokerage Market, consider subscribing to industry newsletters, following relevant companies and organizations, or regularly checking reputable industry news sources and publications.
Methodology
Step 1 - Identification of Relevant Samples Size from Population Database


Step 2 - Approaches for Defining Global Market Size (Value, Volume* & Price*)

Note*: In applicable scenarios
Step 3 - Data Sources
Primary Research
- Web Analytics
- Survey Reports
- Research Institute
- Latest Research Reports
- Opinion Leaders
Secondary Research
- Annual Reports
- White Paper
- Latest Press Release
- Industry Association
- Paid Database
- Investor Presentations

Step 4 - Data Triangulation
Involves using different sources of information in order to increase the validity of a study
These sources are likely to be stakeholders in a program - participants, other researchers, program staff, other community members, and so on.
Then we put all data in single framework & apply various statistical tools to find out the dynamic on the market.
During the analysis stage, feedback from the stakeholder groups would be compared to determine areas of agreement as well as areas of divergence


