
Key Insights
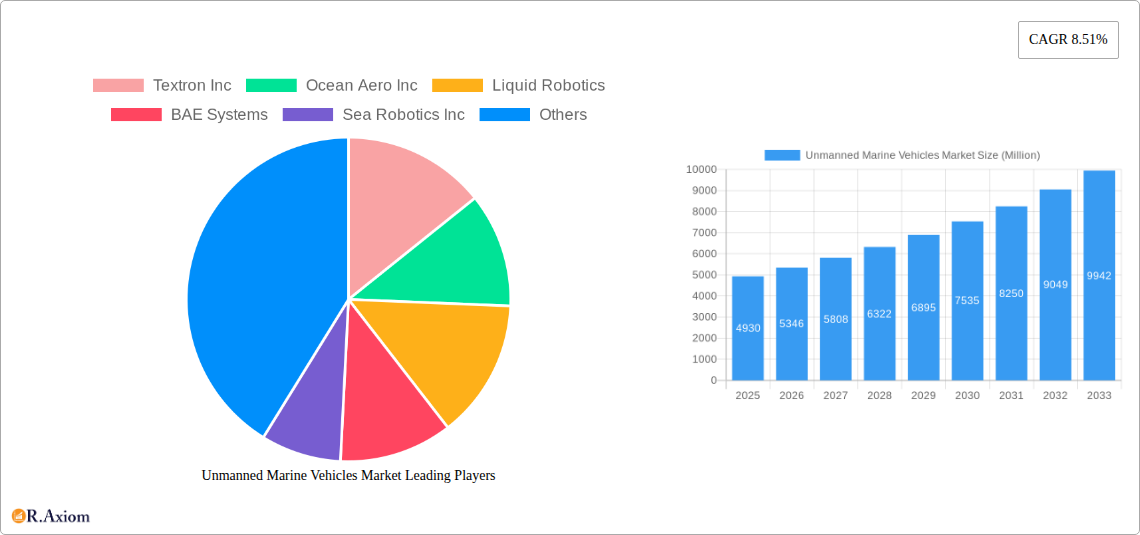
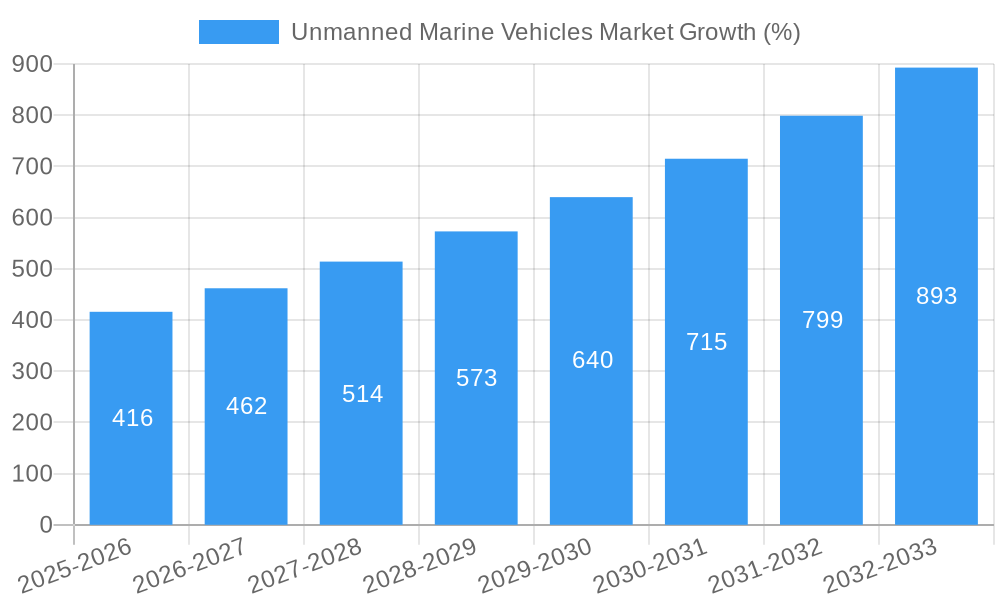
The Unmanned Marine Vehicles (UMV) market is experiencing robust growth, projected to reach \$4.93 billion in 2025 and maintain a Compound Annual Growth Rate (CAGR) of 8.51% from 2025 to 2033. This expansion is fueled by increasing demand across diverse sectors. Defense applications, particularly for maritime surveillance, mine countermeasures, and anti-submarine warfare, are a major driver. The rising adoption of autonomous systems for enhanced operational efficiency and reduced risk to human life further contributes to market growth. Research institutions are also significantly investing in UMVs for oceanographic studies, environmental monitoring, and exploration. The commercial sector is increasingly utilizing UMVs for tasks like offshore infrastructure inspection, subsea cable maintenance, and aquaculture monitoring. Technological advancements, such as improved sensor integration, enhanced navigation capabilities, and the development of more robust and versatile UMV platforms, are propelling market expansion.
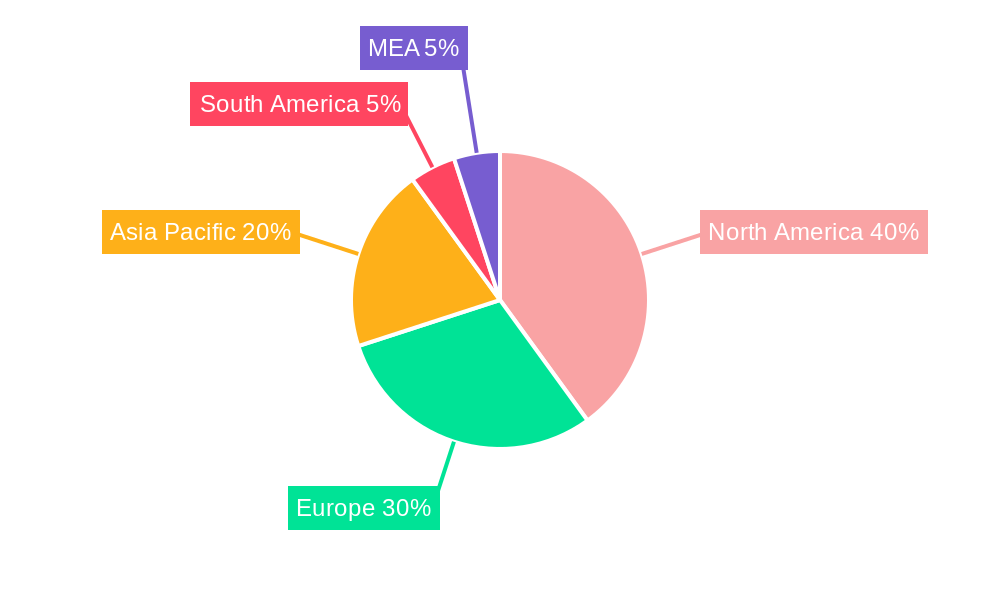
Segmentation analysis reveals a dynamic market landscape. Surface vehicles currently hold a larger market share, although the demand for underwater vehicles is growing rapidly, driven by the expanding scope of subsea operations. Similarly, while remotely operated vehicles (ROVs) maintain a significant presence, the autonomous segment is showcasing impressive growth, benefiting from continuous advancements in artificial intelligence and machine learning. North America and Europe currently dominate the market, with significant contributions from countries like the United States, Germany, and the United Kingdom. However, the Asia-Pacific region is poised for substantial growth, driven by increasing defense spending and expanding commercial activities in maritime sectors within countries such as China, Japan and South Korea. While factors like high initial investment costs and regulatory hurdles pose some challenges, the overall market outlook for UMVs remains highly positive, driven by continued technological innovation and increasing demand across various sectors.
Unmanned Marine Vehicles Market: A Comprehensive Report, 2019-2033
This comprehensive report provides a detailed analysis of the Unmanned Marine Vehicles (UMV) market, offering invaluable insights for industry stakeholders, investors, and researchers. The study period covers 2019-2033, with 2025 as the base and estimated year, and a forecast period of 2025-2033. The report meticulously examines market dynamics, segmentation, leading players, and future growth potential. This report is crucial for understanding the current landscape and future trajectory of the UMV market, valued at xx Million in 2025 and projected to reach xx Million by 2033.
Unmanned Marine Vehicles Market Concentration & Innovation
The Unmanned Marine Vehicles market exhibits a moderately concentrated landscape, with several key players holding significant market share. However, the market is also characterized by a high degree of innovation, driven by advancements in autonomous navigation, sensor technology, and communication systems. The market share of the top 5 players is estimated at xx%, indicating a competitive yet consolidated environment. Mergers and acquisitions (M&A) activities play a substantial role in shaping the market dynamics, with deal values exceeding xx Million in the past five years. Regulatory frameworks, particularly concerning safety and data privacy, are evolving, influencing product development and market access. Product substitution is limited, given the specialized nature of UMVs, but competitive pressures are significant, prompting continuous innovation. End-user trends show increasing demand across diverse sectors including defense, research, and commercial applications.
- Key Players Market Share: Textron Inc (xx%), Ocean Aero Inc (xx%), Liquid Robotics (xx%), BAE Systems (xx%), Sea Robotics Inc (xx%) (These percentages are estimates and subject to change).
- M&A Activity: Significant M&A activities within the past five years focus on expanding product portfolios and geographical reach.
Unmanned Marine Vehicles Market Industry Trends & Insights
The Unmanned Marine Vehicles market is experiencing robust growth, driven by a combination of factors. The increasing adoption of autonomous systems for various maritime applications is a primary driver. Technological disruptions, such as the development of advanced sensors, AI-powered navigation, and improved underwater communication technologies, are further propelling market expansion. Consumer preferences are shifting towards more efficient, cost-effective, and safer maritime operations, leading to the increased adoption of UMVs. The CAGR for the market during the forecast period is estimated at xx%, reflecting a significant growth trajectory. Market penetration in key segments like defense and commercial applications is also steadily increasing. Competitive dynamics are intense, with companies focusing on product differentiation, strategic partnerships, and technological advancements to maintain a competitive edge.
Dominant Markets & Segments in Unmanned Marine Vehicles Market
The North American region currently dominates the Unmanned Marine Vehicles market, owing to substantial investments in defense and research applications. Within the market segments, the Autonomous Control Type and the Underwater Vehicle Type are showing strong growth potential. The Defense application segment represents the largest market share due to increased military spending and adoption of UMVs for surveillance, mine countermeasures, and other critical operations.
Key Drivers for North American Dominance:
- High defense spending.
- Robust R&D investments.
- Presence of major UMV manufacturers.
Fastest-Growing Segment: Autonomous Underwater Vehicles (AUVs) are witnessing the fastest growth due to their versatility across research, defense, and commercial applications. The demand for these vehicles is driven by their ability to perform complex missions in challenging underwater environments without human intervention.
Dominant Application: The defense application segment, led by North America, is currently the largest, driven by heightened geopolitical tensions and increasing military modernization efforts globally.
Unmanned Marine Vehicles Market Product Developments
Recent product innovations focus on enhancing autonomy, payload capacity, endurance, and operational range. Developments include improved sensor integration, advanced AI algorithms for navigation and obstacle avoidance, and more robust underwater communication systems. These advancements have expanded the applications of UMVs, particularly in deep-sea exploration, environmental monitoring, and offshore energy exploration. The market is witnessing a shift towards more versatile, modular systems, allowing customization for specific mission requirements.
Report Scope & Segmentation Analysis
This report provides a comprehensive segmentation of the Unmanned Marine Vehicles market based on Type (Surface Vehicle, Underwater Vehicle), Control Type (Remotely Operated, Autonomous), and Application (Defense, Research, Commercial, Other Applications). Each segment is analyzed based on market size, growth projections, and competitive dynamics. The surface vehicle segment holds a considerable market share, driven by its suitability for various coastal and offshore applications. The autonomous control type segment is experiencing significant growth, reflecting the increasing demand for unmanned, AI-powered solutions. The defense sector currently accounts for a dominant share in the applications segment, fueled by military investment in autonomous maritime systems.
Key Drivers of Unmanned Marine Vehicles Market Growth
Several factors are driving the growth of the Unmanned Marine Vehicles market:
- Technological Advancements: Continuous improvements in autonomy, sensor technology, and communication systems.
- Increased Demand for Maritime Surveillance: Growing need for cost-effective and efficient monitoring of vast oceanic regions.
- Rising Government Spending: Increased investments in defense and research applications of UMVs, particularly in North America and Europe.
- Growing Commercial Applications: Expanding use of UMVs in offshore energy exploration, marine research, and environmental monitoring.
Challenges in the Unmanned Marine Vehicles Market Sector
The Unmanned Marine Vehicles market faces certain challenges:
- High Initial Investment Costs: The procurement and maintenance of UMVs can be expensive, limiting adoption by smaller organizations.
- Regulatory Uncertainties: Evolving regulatory frameworks surrounding data privacy, operational safety, and environmental impact pose hurdles.
- Technological Limitations: Technological limitations in communication, navigation, and power sources can still hinder operational effectiveness in certain environments.
- Cybersecurity Risks: The potential for cyberattacks on autonomous systems presents a significant security concern.
Emerging Opportunities in Unmanned Marine Vehicles Market
Emerging opportunities in the Unmanned Marine Vehicles market include:
- Expansion into New Markets: Growing demand for UMVs in aquaculture, oceanographic research, and underwater infrastructure inspection.
- Technological Advancements: Further development of AI, machine learning, and advanced sensor technologies will drive innovation.
- Collaboration and Partnerships: Increased collaborations between UMV manufacturers, technology providers, and end-users to develop customized solutions.
Leading Players in the Unmanned Marine Vehicles Market
- Textron Inc
- Ocean Aero Inc
- Liquid Robotics
- BAE Systems
- Sea Robotics Inc
- ECA Group
- Rafael Advanced Defense Systems
- Atlas Elektronik
- Thales Group
- General Dynamics
- Northrop Grumman
- Pelorus Naval Systems
- ASV Global
- Teledyne Technologies Inc
Key Developments in Unmanned Marine Vehicles Market Industry
- August 2022: Austal USA partnered with Saildrone to build Saildrone Surveyor autonomous surface vehicles for the U.S. Navy.
- November 2021: Teledyne Marine partnered with Seatronics to expand the distribution of Bowtech underwater equipment.
- July 2021: Textron Systems received a pre-award for the US Marine Corps Advanced Reconnaissance Vehicle prototype.
- March 2021: BAE Systems announced its Riptide UUV-12 unmanned undersea vehicle portfolio.
Strategic Outlook for Unmanned Marine Vehicles Market
The Unmanned Marine Vehicles market is poised for continued growth, driven by technological advancements, increasing demand across diverse sectors, and supportive government policies. Future market potential lies in the development of more sophisticated autonomous systems, enhanced sensor capabilities, and expanded applications in emerging sectors like offshore renewable energy and aquaculture. Strategic partnerships and collaborations will play a crucial role in unlocking the full potential of this dynamic market.
Unmanned Marine Vehicles Market Segmentation
-
1. Type
- 1.1. Surface Vehicle
- 1.2. Underwater Vehicle
-
2. Control Type
- 2.1. Remotely Operated
- 2.2. Autonomous
-
3. Application
- 3.1. Defense
- 3.2. Research
- 3.3. Commercial
- 3.4. Other Applications
Unmanned Marine Vehicles Market Segmentation By Geography
-
1. North America
- 1.1. United States
- 1.2. Canada
-
2. Europe
- 2.1. Germany
- 2.2. Italy
- 2.3. France
- 2.4. Rest of Europe
-
3. Asia Pacific
- 3.1. China
- 3.2. Japan
- 3.3. India
- 3.4. Australia
- 3.5. Rest of Asia Pacific
-
4. Latin America
- 4.1. Brazil
- 4.2. Rest of Latin America
-
5. Middle East and Africa
- 5.1. South Africa
- 5.2. Rest of Middle East and Africa
Unmanned Marine Vehicles Market REPORT HIGHLIGHTS
| Aspects | Details |
|---|---|
| Study Period | 2019-2033 |
| Base Year | 2024 |
| Estimated Year | 2025 |
| Forecast Period | 2025-2033 |
| Historical Period | 2019-2024 |
| Growth Rate | CAGR of 8.51% from 2019-2033 |
| Segmentation |
|
Table of Contents
- 1. Introduction
- 1.1. Research Scope
- 1.2. Market Segmentation
- 1.3. Research Methodology
- 1.4. Definitions and Assumptions
- 2. Executive Summary
- 2.1. Introduction
- 3. Market Dynamics
- 3.1. Introduction
- 3.2. Market Drivers
- 3.2.1. Oceanic Surveillance for Defense Purposes; Increased Usage of Unmanned Marine Vehicles for Underwater Mapping for Marine Geoscience Studies
- 3.3. Market Restrains
- 3.3.1. High Cost for the Equipment and Maintenance Issues
- 3.4. Market Trends
- 3.4.1. The Defense Industry is Expected to Grow Significantly in the Market
- 4. Market Factor Analysis
- 4.1. Porters Five Forces
- 4.2. Supply/Value Chain
- 4.3. PESTEL analysis
- 4.4. Market Entropy
- 4.5. Patent/Trademark Analysis
- 5. Global Unmanned Marine Vehicles Market Analysis, Insights and Forecast, 2019-2031
- 5.1. Market Analysis, Insights and Forecast - by Type
- 5.1.1. Surface Vehicle
- 5.1.2. Underwater Vehicle
- 5.2. Market Analysis, Insights and Forecast - by Control Type
- 5.2.1. Remotely Operated
- 5.2.2. Autonomous
- 5.3. Market Analysis, Insights and Forecast - by Application
- 5.3.1. Defense
- 5.3.2. Research
- 5.3.3. Commercial
- 5.3.4. Other Applications
- 5.4. Market Analysis, Insights and Forecast - by Region
- 5.4.1. North America
- 5.4.2. Europe
- 5.4.3. Asia Pacific
- 5.4.4. Latin America
- 5.4.5. Middle East and Africa
- 5.1. Market Analysis, Insights and Forecast - by Type
- 6. North America Unmanned Marine Vehicles Market Analysis, Insights and Forecast, 2019-2031
- 6.1. Market Analysis, Insights and Forecast - by Type
- 6.1.1. Surface Vehicle
- 6.1.2. Underwater Vehicle
- 6.2. Market Analysis, Insights and Forecast - by Control Type
- 6.2.1. Remotely Operated
- 6.2.2. Autonomous
- 6.3. Market Analysis, Insights and Forecast - by Application
- 6.3.1. Defense
- 6.3.2. Research
- 6.3.3. Commercial
- 6.3.4. Other Applications
- 6.1. Market Analysis, Insights and Forecast - by Type
- 7. Europe Unmanned Marine Vehicles Market Analysis, Insights and Forecast, 2019-2031
- 7.1. Market Analysis, Insights and Forecast - by Type
- 7.1.1. Surface Vehicle
- 7.1.2. Underwater Vehicle
- 7.2. Market Analysis, Insights and Forecast - by Control Type
- 7.2.1. Remotely Operated
- 7.2.2. Autonomous
- 7.3. Market Analysis, Insights and Forecast - by Application
- 7.3.1. Defense
- 7.3.2. Research
- 7.3.3. Commercial
- 7.3.4. Other Applications
- 7.1. Market Analysis, Insights and Forecast - by Type
- 8. Asia Pacific Unmanned Marine Vehicles Market Analysis, Insights and Forecast, 2019-2031
- 8.1. Market Analysis, Insights and Forecast - by Type
- 8.1.1. Surface Vehicle
- 8.1.2. Underwater Vehicle
- 8.2. Market Analysis, Insights and Forecast - by Control Type
- 8.2.1. Remotely Operated
- 8.2.2. Autonomous
- 8.3. Market Analysis, Insights and Forecast - by Application
- 8.3.1. Defense
- 8.3.2. Research
- 8.3.3. Commercial
- 8.3.4. Other Applications
- 8.1. Market Analysis, Insights and Forecast - by Type
- 9. Latin America Unmanned Marine Vehicles Market Analysis, Insights and Forecast, 2019-2031
- 9.1. Market Analysis, Insights and Forecast - by Type
- 9.1.1. Surface Vehicle
- 9.1.2. Underwater Vehicle
- 9.2. Market Analysis, Insights and Forecast - by Control Type
- 9.2.1. Remotely Operated
- 9.2.2. Autonomous
- 9.3. Market Analysis, Insights and Forecast - by Application
- 9.3.1. Defense
- 9.3.2. Research
- 9.3.3. Commercial
- 9.3.4. Other Applications
- 9.1. Market Analysis, Insights and Forecast - by Type
- 10. Middle East and Africa Unmanned Marine Vehicles Market Analysis, Insights and Forecast, 2019-2031
- 10.1. Market Analysis, Insights and Forecast - by Type
- 10.1.1. Surface Vehicle
- 10.1.2. Underwater Vehicle
- 10.2. Market Analysis, Insights and Forecast - by Control Type
- 10.2.1. Remotely Operated
- 10.2.2. Autonomous
- 10.3. Market Analysis, Insights and Forecast - by Application
- 10.3.1. Defense
- 10.3.2. Research
- 10.3.3. Commercial
- 10.3.4. Other Applications
- 10.1. Market Analysis, Insights and Forecast - by Type
- 11. North America Unmanned Marine Vehicles Market Analysis, Insights and Forecast, 2019-2031
- 11.1. Market Analysis, Insights and Forecast - By Country/Sub-region
- 11.1.1 United States
- 11.1.2 Canada
- 11.1.3 Mexico
- 12. Europe Unmanned Marine Vehicles Market Analysis, Insights and Forecast, 2019-2031
- 12.1. Market Analysis, Insights and Forecast - By Country/Sub-region
- 12.1.1 Germany
- 12.1.2 United Kingdom
- 12.1.3 France
- 12.1.4 Spain
- 12.1.5 Italy
- 12.1.6 Spain
- 12.1.7 Belgium
- 12.1.8 Netherland
- 12.1.9 Nordics
- 12.1.10 Rest of Europe
- 13. Asia Pacific Unmanned Marine Vehicles Market Analysis, Insights and Forecast, 2019-2031
- 13.1. Market Analysis, Insights and Forecast - By Country/Sub-region
- 13.1.1 China
- 13.1.2 Japan
- 13.1.3 India
- 13.1.4 South Korea
- 13.1.5 Southeast Asia
- 13.1.6 Australia
- 13.1.7 Indonesia
- 13.1.8 Phillipes
- 13.1.9 Singapore
- 13.1.10 Thailandc
- 13.1.11 Rest of Asia Pacific
- 14. South America Unmanned Marine Vehicles Market Analysis, Insights and Forecast, 2019-2031
- 14.1. Market Analysis, Insights and Forecast - By Country/Sub-region
- 14.1.1 Brazil
- 14.1.2 Argentina
- 14.1.3 Peru
- 14.1.4 Chile
- 14.1.5 Colombia
- 14.1.6 Ecuador
- 14.1.7 Venezuela
- 14.1.8 Rest of South America
- 15. North America Unmanned Marine Vehicles Market Analysis, Insights and Forecast, 2019-2031
- 15.1. Market Analysis, Insights and Forecast - By Country/Sub-region
- 15.1.1 United States
- 15.1.2 Canada
- 15.1.3 Mexico
- 16. MEA Unmanned Marine Vehicles Market Analysis, Insights and Forecast, 2019-2031
- 16.1. Market Analysis, Insights and Forecast - By Country/Sub-region
- 16.1.1 United Arab Emirates
- 16.1.2 Saudi Arabia
- 16.1.3 South Africa
- 16.1.4 Rest of Middle East and Africa
- 17. Competitive Analysis
- 17.1. Global Market Share Analysis 2024
- 17.2. Company Profiles
- 17.2.1 Textron Inc
- 17.2.1.1. Overview
- 17.2.1.2. Products
- 17.2.1.3. SWOT Analysis
- 17.2.1.4. Recent Developments
- 17.2.1.5. Financials (Based on Availability)
- 17.2.2 Ocean Aero Inc
- 17.2.2.1. Overview
- 17.2.2.2. Products
- 17.2.2.3. SWOT Analysis
- 17.2.2.4. Recent Developments
- 17.2.2.5. Financials (Based on Availability)
- 17.2.3 Liquid Robotics
- 17.2.3.1. Overview
- 17.2.3.2. Products
- 17.2.3.3. SWOT Analysis
- 17.2.3.4. Recent Developments
- 17.2.3.5. Financials (Based on Availability)
- 17.2.4 BAE Systems
- 17.2.4.1. Overview
- 17.2.4.2. Products
- 17.2.4.3. SWOT Analysis
- 17.2.4.4. Recent Developments
- 17.2.4.5. Financials (Based on Availability)
- 17.2.5 Sea Robotics Inc
- 17.2.5.1. Overview
- 17.2.5.2. Products
- 17.2.5.3. SWOT Analysis
- 17.2.5.4. Recent Developments
- 17.2.5.5. Financials (Based on Availability)
- 17.2.6 ECA Group
- 17.2.6.1. Overview
- 17.2.6.2. Products
- 17.2.6.3. SWOT Analysis
- 17.2.6.4. Recent Developments
- 17.2.6.5. Financials (Based on Availability)
- 17.2.7 Rafael Advanced Defense Systems
- 17.2.7.1. Overview
- 17.2.7.2. Products
- 17.2.7.3. SWOT Analysis
- 17.2.7.4. Recent Developments
- 17.2.7.5. Financials (Based on Availability)
- 17.2.8 Atlas Elektronik
- 17.2.8.1. Overview
- 17.2.8.2. Products
- 17.2.8.3. SWOT Analysis
- 17.2.8.4. Recent Developments
- 17.2.8.5. Financials (Based on Availability)
- 17.2.9 Thales Group
- 17.2.9.1. Overview
- 17.2.9.2. Products
- 17.2.9.3. SWOT Analysis
- 17.2.9.4. Recent Developments
- 17.2.9.5. Financials (Based on Availability)
- 17.2.10 General Dynamics
- 17.2.10.1. Overview
- 17.2.10.2. Products
- 17.2.10.3. SWOT Analysis
- 17.2.10.4. Recent Developments
- 17.2.10.5. Financials (Based on Availability)
- 17.2.11 Northrop Grumman
- 17.2.11.1. Overview
- 17.2.11.2. Products
- 17.2.11.3. SWOT Analysis
- 17.2.11.4. Recent Developments
- 17.2.11.5. Financials (Based on Availability)
- 17.2.12 Pelorus Naval Systems
- 17.2.12.1. Overview
- 17.2.12.2. Products
- 17.2.12.3. SWOT Analysis
- 17.2.12.4. Recent Developments
- 17.2.12.5. Financials (Based on Availability)
- 17.2.13 ASV Globa
- 17.2.13.1. Overview
- 17.2.13.2. Products
- 17.2.13.3. SWOT Analysis
- 17.2.13.4. Recent Developments
- 17.2.13.5. Financials (Based on Availability)
- 17.2.14 Teledyne Technologies Inc
- 17.2.14.1. Overview
- 17.2.14.2. Products
- 17.2.14.3. SWOT Analysis
- 17.2.14.4. Recent Developments
- 17.2.14.5. Financials (Based on Availability)
- 17.2.1 Textron Inc
List of Figures
- Figure 1: Global Unmanned Marine Vehicles Market Revenue Breakdown (Million, %) by Region 2024 & 2032
- Figure 2: Global Unmanned Marine Vehicles Market Volume Breakdown (K Unit, %) by Region 2024 & 2032
- Figure 3: North America Unmanned Marine Vehicles Market Revenue (Million), by Country 2024 & 2032
- Figure 4: North America Unmanned Marine Vehicles Market Volume (K Unit), by Country 2024 & 2032
- Figure 5: North America Unmanned Marine Vehicles Market Revenue Share (%), by Country 2024 & 2032
- Figure 6: North America Unmanned Marine Vehicles Market Volume Share (%), by Country 2024 & 2032
- Figure 7: Europe Unmanned Marine Vehicles Market Revenue (Million), by Country 2024 & 2032
- Figure 8: Europe Unmanned Marine Vehicles Market Volume (K Unit), by Country 2024 & 2032
- Figure 9: Europe Unmanned Marine Vehicles Market Revenue Share (%), by Country 2024 & 2032
- Figure 10: Europe Unmanned Marine Vehicles Market Volume Share (%), by Country 2024 & 2032
- Figure 11: Asia Pacific Unmanned Marine Vehicles Market Revenue (Million), by Country 2024 & 2032
- Figure 12: Asia Pacific Unmanned Marine Vehicles Market Volume (K Unit), by Country 2024 & 2032
- Figure 13: Asia Pacific Unmanned Marine Vehicles Market Revenue Share (%), by Country 2024 & 2032
- Figure 14: Asia Pacific Unmanned Marine Vehicles Market Volume Share (%), by Country 2024 & 2032
- Figure 15: South America Unmanned Marine Vehicles Market Revenue (Million), by Country 2024 & 2032
- Figure 16: South America Unmanned Marine Vehicles Market Volume (K Unit), by Country 2024 & 2032
- Figure 17: South America Unmanned Marine Vehicles Market Revenue Share (%), by Country 2024 & 2032
- Figure 18: South America Unmanned Marine Vehicles Market Volume Share (%), by Country 2024 & 2032
- Figure 19: North America Unmanned Marine Vehicles Market Revenue (Million), by Country 2024 & 2032
- Figure 20: North America Unmanned Marine Vehicles Market Volume (K Unit), by Country 2024 & 2032
- Figure 21: North America Unmanned Marine Vehicles Market Revenue Share (%), by Country 2024 & 2032
- Figure 22: North America Unmanned Marine Vehicles Market Volume Share (%), by Country 2024 & 2032
- Figure 23: MEA Unmanned Marine Vehicles Market Revenue (Million), by Country 2024 & 2032
- Figure 24: MEA Unmanned Marine Vehicles Market Volume (K Unit), by Country 2024 & 2032
- Figure 25: MEA Unmanned Marine Vehicles Market Revenue Share (%), by Country 2024 & 2032
- Figure 26: MEA Unmanned Marine Vehicles Market Volume Share (%), by Country 2024 & 2032
- Figure 27: North America Unmanned Marine Vehicles Market Revenue (Million), by Type 2024 & 2032
- Figure 28: North America Unmanned Marine Vehicles Market Volume (K Unit), by Type 2024 & 2032
- Figure 29: North America Unmanned Marine Vehicles Market Revenue Share (%), by Type 2024 & 2032
- Figure 30: North America Unmanned Marine Vehicles Market Volume Share (%), by Type 2024 & 2032
- Figure 31: North America Unmanned Marine Vehicles Market Revenue (Million), by Control Type 2024 & 2032
- Figure 32: North America Unmanned Marine Vehicles Market Volume (K Unit), by Control Type 2024 & 2032
- Figure 33: North America Unmanned Marine Vehicles Market Revenue Share (%), by Control Type 2024 & 2032
- Figure 34: North America Unmanned Marine Vehicles Market Volume Share (%), by Control Type 2024 & 2032
- Figure 35: North America Unmanned Marine Vehicles Market Revenue (Million), by Application 2024 & 2032
- Figure 36: North America Unmanned Marine Vehicles Market Volume (K Unit), by Application 2024 & 2032
- Figure 37: North America Unmanned Marine Vehicles Market Revenue Share (%), by Application 2024 & 2032
- Figure 38: North America Unmanned Marine Vehicles Market Volume Share (%), by Application 2024 & 2032
- Figure 39: North America Unmanned Marine Vehicles Market Revenue (Million), by Country 2024 & 2032
- Figure 40: North America Unmanned Marine Vehicles Market Volume (K Unit), by Country 2024 & 2032
- Figure 41: North America Unmanned Marine Vehicles Market Revenue Share (%), by Country 2024 & 2032
- Figure 42: North America Unmanned Marine Vehicles Market Volume Share (%), by Country 2024 & 2032
- Figure 43: Europe Unmanned Marine Vehicles Market Revenue (Million), by Type 2024 & 2032
- Figure 44: Europe Unmanned Marine Vehicles Market Volume (K Unit), by Type 2024 & 2032
- Figure 45: Europe Unmanned Marine Vehicles Market Revenue Share (%), by Type 2024 & 2032
- Figure 46: Europe Unmanned Marine Vehicles Market Volume Share (%), by Type 2024 & 2032
- Figure 47: Europe Unmanned Marine Vehicles Market Revenue (Million), by Control Type 2024 & 2032
- Figure 48: Europe Unmanned Marine Vehicles Market Volume (K Unit), by Control Type 2024 & 2032
- Figure 49: Europe Unmanned Marine Vehicles Market Revenue Share (%), by Control Type 2024 & 2032
- Figure 50: Europe Unmanned Marine Vehicles Market Volume Share (%), by Control Type 2024 & 2032
- Figure 51: Europe Unmanned Marine Vehicles Market Revenue (Million), by Application 2024 & 2032
- Figure 52: Europe Unmanned Marine Vehicles Market Volume (K Unit), by Application 2024 & 2032
- Figure 53: Europe Unmanned Marine Vehicles Market Revenue Share (%), by Application 2024 & 2032
- Figure 54: Europe Unmanned Marine Vehicles Market Volume Share (%), by Application 2024 & 2032
- Figure 55: Europe Unmanned Marine Vehicles Market Revenue (Million), by Country 2024 & 2032
- Figure 56: Europe Unmanned Marine Vehicles Market Volume (K Unit), by Country 2024 & 2032
- Figure 57: Europe Unmanned Marine Vehicles Market Revenue Share (%), by Country 2024 & 2032
- Figure 58: Europe Unmanned Marine Vehicles Market Volume Share (%), by Country 2024 & 2032
- Figure 59: Asia Pacific Unmanned Marine Vehicles Market Revenue (Million), by Type 2024 & 2032
- Figure 60: Asia Pacific Unmanned Marine Vehicles Market Volume (K Unit), by Type 2024 & 2032
- Figure 61: Asia Pacific Unmanned Marine Vehicles Market Revenue Share (%), by Type 2024 & 2032
- Figure 62: Asia Pacific Unmanned Marine Vehicles Market Volume Share (%), by Type 2024 & 2032
- Figure 63: Asia Pacific Unmanned Marine Vehicles Market Revenue (Million), by Control Type 2024 & 2032
- Figure 64: Asia Pacific Unmanned Marine Vehicles Market Volume (K Unit), by Control Type 2024 & 2032
- Figure 65: Asia Pacific Unmanned Marine Vehicles Market Revenue Share (%), by Control Type 2024 & 2032
- Figure 66: Asia Pacific Unmanned Marine Vehicles Market Volume Share (%), by Control Type 2024 & 2032
- Figure 67: Asia Pacific Unmanned Marine Vehicles Market Revenue (Million), by Application 2024 & 2032
- Figure 68: Asia Pacific Unmanned Marine Vehicles Market Volume (K Unit), by Application 2024 & 2032
- Figure 69: Asia Pacific Unmanned Marine Vehicles Market Revenue Share (%), by Application 2024 & 2032
- Figure 70: Asia Pacific Unmanned Marine Vehicles Market Volume Share (%), by Application 2024 & 2032
- Figure 71: Asia Pacific Unmanned Marine Vehicles Market Revenue (Million), by Country 2024 & 2032
- Figure 72: Asia Pacific Unmanned Marine Vehicles Market Volume (K Unit), by Country 2024 & 2032
- Figure 73: Asia Pacific Unmanned Marine Vehicles Market Revenue Share (%), by Country 2024 & 2032
- Figure 74: Asia Pacific Unmanned Marine Vehicles Market Volume Share (%), by Country 2024 & 2032
- Figure 75: Latin America Unmanned Marine Vehicles Market Revenue (Million), by Type 2024 & 2032
- Figure 76: Latin America Unmanned Marine Vehicles Market Volume (K Unit), by Type 2024 & 2032
- Figure 77: Latin America Unmanned Marine Vehicles Market Revenue Share (%), by Type 2024 & 2032
- Figure 78: Latin America Unmanned Marine Vehicles Market Volume Share (%), by Type 2024 & 2032
- Figure 79: Latin America Unmanned Marine Vehicles Market Revenue (Million), by Control Type 2024 & 2032
- Figure 80: Latin America Unmanned Marine Vehicles Market Volume (K Unit), by Control Type 2024 & 2032
- Figure 81: Latin America Unmanned Marine Vehicles Market Revenue Share (%), by Control Type 2024 & 2032
- Figure 82: Latin America Unmanned Marine Vehicles Market Volume Share (%), by Control Type 2024 & 2032
- Figure 83: Latin America Unmanned Marine Vehicles Market Revenue (Million), by Application 2024 & 2032
- Figure 84: Latin America Unmanned Marine Vehicles Market Volume (K Unit), by Application 2024 & 2032
- Figure 85: Latin America Unmanned Marine Vehicles Market Revenue Share (%), by Application 2024 & 2032
- Figure 86: Latin America Unmanned Marine Vehicles Market Volume Share (%), by Application 2024 & 2032
- Figure 87: Latin America Unmanned Marine Vehicles Market Revenue (Million), by Country 2024 & 2032
- Figure 88: Latin America Unmanned Marine Vehicles Market Volume (K Unit), by Country 2024 & 2032
- Figure 89: Latin America Unmanned Marine Vehicles Market Revenue Share (%), by Country 2024 & 2032
- Figure 90: Latin America Unmanned Marine Vehicles Market Volume Share (%), by Country 2024 & 2032
- Figure 91: Middle East and Africa Unmanned Marine Vehicles Market Revenue (Million), by Type 2024 & 2032
- Figure 92: Middle East and Africa Unmanned Marine Vehicles Market Volume (K Unit), by Type 2024 & 2032
- Figure 93: Middle East and Africa Unmanned Marine Vehicles Market Revenue Share (%), by Type 2024 & 2032
- Figure 94: Middle East and Africa Unmanned Marine Vehicles Market Volume Share (%), by Type 2024 & 2032
- Figure 95: Middle East and Africa Unmanned Marine Vehicles Market Revenue (Million), by Control Type 2024 & 2032
- Figure 96: Middle East and Africa Unmanned Marine Vehicles Market Volume (K Unit), by Control Type 2024 & 2032
- Figure 97: Middle East and Africa Unmanned Marine Vehicles Market Revenue Share (%), by Control Type 2024 & 2032
- Figure 98: Middle East and Africa Unmanned Marine Vehicles Market Volume Share (%), by Control Type 2024 & 2032
- Figure 99: Middle East and Africa Unmanned Marine Vehicles Market Revenue (Million), by Application 2024 & 2032
- Figure 100: Middle East and Africa Unmanned Marine Vehicles Market Volume (K Unit), by Application 2024 & 2032
- Figure 101: Middle East and Africa Unmanned Marine Vehicles Market Revenue Share (%), by Application 2024 & 2032
- Figure 102: Middle East and Africa Unmanned Marine Vehicles Market Volume Share (%), by Application 2024 & 2032
- Figure 103: Middle East and Africa Unmanned Marine Vehicles Market Revenue (Million), by Country 2024 & 2032
- Figure 104: Middle East and Africa Unmanned Marine Vehicles Market Volume (K Unit), by Country 2024 & 2032
- Figure 105: Middle East and Africa Unmanned Marine Vehicles Market Revenue Share (%), by Country 2024 & 2032
- Figure 106: Middle East and Africa Unmanned Marine Vehicles Market Volume Share (%), by Country 2024 & 2032
List of Tables
- Table 1: Global Unmanned Marine Vehicles Market Revenue Million Forecast, by Region 2019 & 2032
- Table 2: Global Unmanned Marine Vehicles Market Volume K Unit Forecast, by Region 2019 & 2032
- Table 3: Global Unmanned Marine Vehicles Market Revenue Million Forecast, by Type 2019 & 2032
- Table 4: Global Unmanned Marine Vehicles Market Volume K Unit Forecast, by Type 2019 & 2032
- Table 5: Global Unmanned Marine Vehicles Market Revenue Million Forecast, by Control Type 2019 & 2032
- Table 6: Global Unmanned Marine Vehicles Market Volume K Unit Forecast, by Control Type 2019 & 2032
- Table 7: Global Unmanned Marine Vehicles Market Revenue Million Forecast, by Application 2019 & 2032
- Table 8: Global Unmanned Marine Vehicles Market Volume K Unit Forecast, by Application 2019 & 2032
- Table 9: Global Unmanned Marine Vehicles Market Revenue Million Forecast, by Region 2019 & 2032
- Table 10: Global Unmanned Marine Vehicles Market Volume K Unit Forecast, by Region 2019 & 2032
- Table 11: Global Unmanned Marine Vehicles Market Revenue Million Forecast, by Country 2019 & 2032
- Table 12: Global Unmanned Marine Vehicles Market Volume K Unit Forecast, by Country 2019 & 2032
- Table 13: United States Unmanned Marine Vehicles Market Revenue (Million) Forecast, by Application 2019 & 2032
- Table 14: United States Unmanned Marine Vehicles Market Volume (K Unit) Forecast, by Application 2019 & 2032
- Table 15: Canada Unmanned Marine Vehicles Market Revenue (Million) Forecast, by Application 2019 & 2032
- Table 16: Canada Unmanned Marine Vehicles Market Volume (K Unit) Forecast, by Application 2019 & 2032
- Table 17: Mexico Unmanned Marine Vehicles Market Revenue (Million) Forecast, by Application 2019 & 2032
- Table 18: Mexico Unmanned Marine Vehicles Market Volume (K Unit) Forecast, by Application 2019 & 2032
- Table 19: Global Unmanned Marine Vehicles Market Revenue Million Forecast, by Country 2019 & 2032
- Table 20: Global Unmanned Marine Vehicles Market Volume K Unit Forecast, by Country 2019 & 2032
- Table 21: Germany Unmanned Marine Vehicles Market Revenue (Million) Forecast, by Application 2019 & 2032
- Table 22: Germany Unmanned Marine Vehicles Market Volume (K Unit) Forecast, by Application 2019 & 2032
- Table 23: United Kingdom Unmanned Marine Vehicles Market Revenue (Million) Forecast, by Application 2019 & 2032
- Table 24: United Kingdom Unmanned Marine Vehicles Market Volume (K Unit) Forecast, by Application 2019 & 2032
- Table 25: France Unmanned Marine Vehicles Market Revenue (Million) Forecast, by Application 2019 & 2032
- Table 26: France Unmanned Marine Vehicles Market Volume (K Unit) Forecast, by Application 2019 & 2032
- Table 27: Spain Unmanned Marine Vehicles Market Revenue (Million) Forecast, by Application 2019 & 2032
- Table 28: Spain Unmanned Marine Vehicles Market Volume (K Unit) Forecast, by Application 2019 & 2032
- Table 29: Italy Unmanned Marine Vehicles Market Revenue (Million) Forecast, by Application 2019 & 2032
- Table 30: Italy Unmanned Marine Vehicles Market Volume (K Unit) Forecast, by Application 2019 & 2032
- Table 31: Spain Unmanned Marine Vehicles Market Revenue (Million) Forecast, by Application 2019 & 2032
- Table 32: Spain Unmanned Marine Vehicles Market Volume (K Unit) Forecast, by Application 2019 & 2032
- Table 33: Belgium Unmanned Marine Vehicles Market Revenue (Million) Forecast, by Application 2019 & 2032
- Table 34: Belgium Unmanned Marine Vehicles Market Volume (K Unit) Forecast, by Application 2019 & 2032
- Table 35: Netherland Unmanned Marine Vehicles Market Revenue (Million) Forecast, by Application 2019 & 2032
- Table 36: Netherland Unmanned Marine Vehicles Market Volume (K Unit) Forecast, by Application 2019 & 2032
- Table 37: Nordics Unmanned Marine Vehicles Market Revenue (Million) Forecast, by Application 2019 & 2032
- Table 38: Nordics Unmanned Marine Vehicles Market Volume (K Unit) Forecast, by Application 2019 & 2032
- Table 39: Rest of Europe Unmanned Marine Vehicles Market Revenue (Million) Forecast, by Application 2019 & 2032
- Table 40: Rest of Europe Unmanned Marine Vehicles Market Volume (K Unit) Forecast, by Application 2019 & 2032
- Table 41: Global Unmanned Marine Vehicles Market Revenue Million Forecast, by Country 2019 & 2032
- Table 42: Global Unmanned Marine Vehicles Market Volume K Unit Forecast, by Country 2019 & 2032
- Table 43: China Unmanned Marine Vehicles Market Revenue (Million) Forecast, by Application 2019 & 2032
- Table 44: China Unmanned Marine Vehicles Market Volume (K Unit) Forecast, by Application 2019 & 2032
- Table 45: Japan Unmanned Marine Vehicles Market Revenue (Million) Forecast, by Application 2019 & 2032
- Table 46: Japan Unmanned Marine Vehicles Market Volume (K Unit) Forecast, by Application 2019 & 2032
- Table 47: India Unmanned Marine Vehicles Market Revenue (Million) Forecast, by Application 2019 & 2032
- Table 48: India Unmanned Marine Vehicles Market Volume (K Unit) Forecast, by Application 2019 & 2032
- Table 49: South Korea Unmanned Marine Vehicles Market Revenue (Million) Forecast, by Application 2019 & 2032
- Table 50: South Korea Unmanned Marine Vehicles Market Volume (K Unit) Forecast, by Application 2019 & 2032
- Table 51: Southeast Asia Unmanned Marine Vehicles Market Revenue (Million) Forecast, by Application 2019 & 2032
- Table 52: Southeast Asia Unmanned Marine Vehicles Market Volume (K Unit) Forecast, by Application 2019 & 2032
- Table 53: Australia Unmanned Marine Vehicles Market Revenue (Million) Forecast, by Application 2019 & 2032
- Table 54: Australia Unmanned Marine Vehicles Market Volume (K Unit) Forecast, by Application 2019 & 2032
- Table 55: Indonesia Unmanned Marine Vehicles Market Revenue (Million) Forecast, by Application 2019 & 2032
- Table 56: Indonesia Unmanned Marine Vehicles Market Volume (K Unit) Forecast, by Application 2019 & 2032
- Table 57: Phillipes Unmanned Marine Vehicles Market Revenue (Million) Forecast, by Application 2019 & 2032
- Table 58: Phillipes Unmanned Marine Vehicles Market Volume (K Unit) Forecast, by Application 2019 & 2032
- Table 59: Singapore Unmanned Marine Vehicles Market Revenue (Million) Forecast, by Application 2019 & 2032
- Table 60: Singapore Unmanned Marine Vehicles Market Volume (K Unit) Forecast, by Application 2019 & 2032
- Table 61: Thailandc Unmanned Marine Vehicles Market Revenue (Million) Forecast, by Application 2019 & 2032
- Table 62: Thailandc Unmanned Marine Vehicles Market Volume (K Unit) Forecast, by Application 2019 & 2032
- Table 63: Rest of Asia Pacific Unmanned Marine Vehicles Market Revenue (Million) Forecast, by Application 2019 & 2032
- Table 64: Rest of Asia Pacific Unmanned Marine Vehicles Market Volume (K Unit) Forecast, by Application 2019 & 2032
- Table 65: Global Unmanned Marine Vehicles Market Revenue Million Forecast, by Country 2019 & 2032
- Table 66: Global Unmanned Marine Vehicles Market Volume K Unit Forecast, by Country 2019 & 2032
- Table 67: Brazil Unmanned Marine Vehicles Market Revenue (Million) Forecast, by Application 2019 & 2032
- Table 68: Brazil Unmanned Marine Vehicles Market Volume (K Unit) Forecast, by Application 2019 & 2032
- Table 69: Argentina Unmanned Marine Vehicles Market Revenue (Million) Forecast, by Application 2019 & 2032
- Table 70: Argentina Unmanned Marine Vehicles Market Volume (K Unit) Forecast, by Application 2019 & 2032
- Table 71: Peru Unmanned Marine Vehicles Market Revenue (Million) Forecast, by Application 2019 & 2032
- Table 72: Peru Unmanned Marine Vehicles Market Volume (K Unit) Forecast, by Application 2019 & 2032
- Table 73: Chile Unmanned Marine Vehicles Market Revenue (Million) Forecast, by Application 2019 & 2032
- Table 74: Chile Unmanned Marine Vehicles Market Volume (K Unit) Forecast, by Application 2019 & 2032
- Table 75: Colombia Unmanned Marine Vehicles Market Revenue (Million) Forecast, by Application 2019 & 2032
- Table 76: Colombia Unmanned Marine Vehicles Market Volume (K Unit) Forecast, by Application 2019 & 2032
- Table 77: Ecuador Unmanned Marine Vehicles Market Revenue (Million) Forecast, by Application 2019 & 2032
- Table 78: Ecuador Unmanned Marine Vehicles Market Volume (K Unit) Forecast, by Application 2019 & 2032
- Table 79: Venezuela Unmanned Marine Vehicles Market Revenue (Million) Forecast, by Application 2019 & 2032
- Table 80: Venezuela Unmanned Marine Vehicles Market Volume (K Unit) Forecast, by Application 2019 & 2032
- Table 81: Rest of South America Unmanned Marine Vehicles Market Revenue (Million) Forecast, by Application 2019 & 2032
- Table 82: Rest of South America Unmanned Marine Vehicles Market Volume (K Unit) Forecast, by Application 2019 & 2032
- Table 83: Global Unmanned Marine Vehicles Market Revenue Million Forecast, by Country 2019 & 2032
- Table 84: Global Unmanned Marine Vehicles Market Volume K Unit Forecast, by Country 2019 & 2032
- Table 85: United States Unmanned Marine Vehicles Market Revenue (Million) Forecast, by Application 2019 & 2032
- Table 86: United States Unmanned Marine Vehicles Market Volume (K Unit) Forecast, by Application 2019 & 2032
- Table 87: Canada Unmanned Marine Vehicles Market Revenue (Million) Forecast, by Application 2019 & 2032
- Table 88: Canada Unmanned Marine Vehicles Market Volume (K Unit) Forecast, by Application 2019 & 2032
- Table 89: Mexico Unmanned Marine Vehicles Market Revenue (Million) Forecast, by Application 2019 & 2032
- Table 90: Mexico Unmanned Marine Vehicles Market Volume (K Unit) Forecast, by Application 2019 & 2032
- Table 91: Global Unmanned Marine Vehicles Market Revenue Million Forecast, by Country 2019 & 2032
- Table 92: Global Unmanned Marine Vehicles Market Volume K Unit Forecast, by Country 2019 & 2032
- Table 93: United Arab Emirates Unmanned Marine Vehicles Market Revenue (Million) Forecast, by Application 2019 & 2032
- Table 94: United Arab Emirates Unmanned Marine Vehicles Market Volume (K Unit) Forecast, by Application 2019 & 2032
- Table 95: Saudi Arabia Unmanned Marine Vehicles Market Revenue (Million) Forecast, by Application 2019 & 2032
- Table 96: Saudi Arabia Unmanned Marine Vehicles Market Volume (K Unit) Forecast, by Application 2019 & 2032
- Table 97: South Africa Unmanned Marine Vehicles Market Revenue (Million) Forecast, by Application 2019 & 2032
- Table 98: South Africa Unmanned Marine Vehicles Market Volume (K Unit) Forecast, by Application 2019 & 2032
- Table 99: Rest of Middle East and Africa Unmanned Marine Vehicles Market Revenue (Million) Forecast, by Application 2019 & 2032
- Table 100: Rest of Middle East and Africa Unmanned Marine Vehicles Market Volume (K Unit) Forecast, by Application 2019 & 2032
- Table 101: Global Unmanned Marine Vehicles Market Revenue Million Forecast, by Type 2019 & 2032
- Table 102: Global Unmanned Marine Vehicles Market Volume K Unit Forecast, by Type 2019 & 2032
- Table 103: Global Unmanned Marine Vehicles Market Revenue Million Forecast, by Control Type 2019 & 2032
- Table 104: Global Unmanned Marine Vehicles Market Volume K Unit Forecast, by Control Type 2019 & 2032
- Table 105: Global Unmanned Marine Vehicles Market Revenue Million Forecast, by Application 2019 & 2032
- Table 106: Global Unmanned Marine Vehicles Market Volume K Unit Forecast, by Application 2019 & 2032
- Table 107: Global Unmanned Marine Vehicles Market Revenue Million Forecast, by Country 2019 & 2032
- Table 108: Global Unmanned Marine Vehicles Market Volume K Unit Forecast, by Country 2019 & 2032
- Table 109: United States Unmanned Marine Vehicles Market Revenue (Million) Forecast, by Application 2019 & 2032
- Table 110: United States Unmanned Marine Vehicles Market Volume (K Unit) Forecast, by Application 2019 & 2032
- Table 111: Canada Unmanned Marine Vehicles Market Revenue (Million) Forecast, by Application 2019 & 2032
- Table 112: Canada Unmanned Marine Vehicles Market Volume (K Unit) Forecast, by Application 2019 & 2032
- Table 113: Global Unmanned Marine Vehicles Market Revenue Million Forecast, by Type 2019 & 2032
- Table 114: Global Unmanned Marine Vehicles Market Volume K Unit Forecast, by Type 2019 & 2032
- Table 115: Global Unmanned Marine Vehicles Market Revenue Million Forecast, by Control Type 2019 & 2032
- Table 116: Global Unmanned Marine Vehicles Market Volume K Unit Forecast, by Control Type 2019 & 2032
- Table 117: Global Unmanned Marine Vehicles Market Revenue Million Forecast, by Application 2019 & 2032
- Table 118: Global Unmanned Marine Vehicles Market Volume K Unit Forecast, by Application 2019 & 2032
- Table 119: Global Unmanned Marine Vehicles Market Revenue Million Forecast, by Country 2019 & 2032
- Table 120: Global Unmanned Marine Vehicles Market Volume K Unit Forecast, by Country 2019 & 2032
- Table 121: Germany Unmanned Marine Vehicles Market Revenue (Million) Forecast, by Application 2019 & 2032
- Table 122: Germany Unmanned Marine Vehicles Market Volume (K Unit) Forecast, by Application 2019 & 2032
- Table 123: Italy Unmanned Marine Vehicles Market Revenue (Million) Forecast, by Application 2019 & 2032
- Table 124: Italy Unmanned Marine Vehicles Market Volume (K Unit) Forecast, by Application 2019 & 2032
- Table 125: France Unmanned Marine Vehicles Market Revenue (Million) Forecast, by Application 2019 & 2032
- Table 126: France Unmanned Marine Vehicles Market Volume (K Unit) Forecast, by Application 2019 & 2032
- Table 127: Rest of Europe Unmanned Marine Vehicles Market Revenue (Million) Forecast, by Application 2019 & 2032
- Table 128: Rest of Europe Unmanned Marine Vehicles Market Volume (K Unit) Forecast, by Application 2019 & 2032
- Table 129: Global Unmanned Marine Vehicles Market Revenue Million Forecast, by Type 2019 & 2032
- Table 130: Global Unmanned Marine Vehicles Market Volume K Unit Forecast, by Type 2019 & 2032
- Table 131: Global Unmanned Marine Vehicles Market Revenue Million Forecast, by Control Type 2019 & 2032
- Table 132: Global Unmanned Marine Vehicles Market Volume K Unit Forecast, by Control Type 2019 & 2032
- Table 133: Global Unmanned Marine Vehicles Market Revenue Million Forecast, by Application 2019 & 2032
- Table 134: Global Unmanned Marine Vehicles Market Volume K Unit Forecast, by Application 2019 & 2032
- Table 135: Global Unmanned Marine Vehicles Market Revenue Million Forecast, by Country 2019 & 2032
- Table 136: Global Unmanned Marine Vehicles Market Volume K Unit Forecast, by Country 2019 & 2032
- Table 137: China Unmanned Marine Vehicles Market Revenue (Million) Forecast, by Application 2019 & 2032
- Table 138: China Unmanned Marine Vehicles Market Volume (K Unit) Forecast, by Application 2019 & 2032
- Table 139: Japan Unmanned Marine Vehicles Market Revenue (Million) Forecast, by Application 2019 & 2032
- Table 140: Japan Unmanned Marine Vehicles Market Volume (K Unit) Forecast, by Application 2019 & 2032
- Table 141: India Unmanned Marine Vehicles Market Revenue (Million) Forecast, by Application 2019 & 2032
- Table 142: India Unmanned Marine Vehicles Market Volume (K Unit) Forecast, by Application 2019 & 2032
- Table 143: Australia Unmanned Marine Vehicles Market Revenue (Million) Forecast, by Application 2019 & 2032
- Table 144: Australia Unmanned Marine Vehicles Market Volume (K Unit) Forecast, by Application 2019 & 2032
- Table 145: Rest of Asia Pacific Unmanned Marine Vehicles Market Revenue (Million) Forecast, by Application 2019 & 2032
- Table 146: Rest of Asia Pacific Unmanned Marine Vehicles Market Volume (K Unit) Forecast, by Application 2019 & 2032
- Table 147: Global Unmanned Marine Vehicles Market Revenue Million Forecast, by Type 2019 & 2032
- Table 148: Global Unmanned Marine Vehicles Market Volume K Unit Forecast, by Type 2019 & 2032
- Table 149: Global Unmanned Marine Vehicles Market Revenue Million Forecast, by Control Type 2019 & 2032
- Table 150: Global Unmanned Marine Vehicles Market Volume K Unit Forecast, by Control Type 2019 & 2032
- Table 151: Global Unmanned Marine Vehicles Market Revenue Million Forecast, by Application 2019 & 2032
- Table 152: Global Unmanned Marine Vehicles Market Volume K Unit Forecast, by Application 2019 & 2032
- Table 153: Global Unmanned Marine Vehicles Market Revenue Million Forecast, by Country 2019 & 2032
- Table 154: Global Unmanned Marine Vehicles Market Volume K Unit Forecast, by Country 2019 & 2032
- Table 155: Brazil Unmanned Marine Vehicles Market Revenue (Million) Forecast, by Application 2019 & 2032
- Table 156: Brazil Unmanned Marine Vehicles Market Volume (K Unit) Forecast, by Application 2019 & 2032
- Table 157: Rest of Latin America Unmanned Marine Vehicles Market Revenue (Million) Forecast, by Application 2019 & 2032
- Table 158: Rest of Latin America Unmanned Marine Vehicles Market Volume (K Unit) Forecast, by Application 2019 & 2032
- Table 159: Global Unmanned Marine Vehicles Market Revenue Million Forecast, by Type 2019 & 2032
- Table 160: Global Unmanned Marine Vehicles Market Volume K Unit Forecast, by Type 2019 & 2032
- Table 161: Global Unmanned Marine Vehicles Market Revenue Million Forecast, by Control Type 2019 & 2032
- Table 162: Global Unmanned Marine Vehicles Market Volume K Unit Forecast, by Control Type 2019 & 2032
- Table 163: Global Unmanned Marine Vehicles Market Revenue Million Forecast, by Application 2019 & 2032
- Table 164: Global Unmanned Marine Vehicles Market Volume K Unit Forecast, by Application 2019 & 2032
- Table 165: Global Unmanned Marine Vehicles Market Revenue Million Forecast, by Country 2019 & 2032
- Table 166: Global Unmanned Marine Vehicles Market Volume K Unit Forecast, by Country 2019 & 2032
- Table 167: South Africa Unmanned Marine Vehicles Market Revenue (Million) Forecast, by Application 2019 & 2032
- Table 168: South Africa Unmanned Marine Vehicles Market Volume (K Unit) Forecast, by Application 2019 & 2032
- Table 169: Rest of Middle East and Africa Unmanned Marine Vehicles Market Revenue (Million) Forecast, by Application 2019 & 2032
- Table 170: Rest of Middle East and Africa Unmanned Marine Vehicles Market Volume (K Unit) Forecast, by Application 2019 & 2032
Frequently Asked Questions
1. What is the projected Compound Annual Growth Rate (CAGR) of the Unmanned Marine Vehicles Market?
The projected CAGR is approximately 8.51%.
2. Which companies are prominent players in the Unmanned Marine Vehicles Market?
Key companies in the market include Textron Inc, Ocean Aero Inc, Liquid Robotics, BAE Systems, Sea Robotics Inc, ECA Group, Rafael Advanced Defense Systems, Atlas Elektronik, Thales Group, General Dynamics, Northrop Grumman, Pelorus Naval Systems, ASV Globa, Teledyne Technologies Inc.
3. What are the main segments of the Unmanned Marine Vehicles Market?
The market segments include Type, Control Type, Application.
4. Can you provide details about the market size?
The market size is estimated to be USD 4.93 Million as of 2022.
5. What are some drivers contributing to market growth?
Oceanic Surveillance for Defense Purposes; Increased Usage of Unmanned Marine Vehicles for Underwater Mapping for Marine Geoscience Studies.
6. What are the notable trends driving market growth?
The Defense Industry is Expected to Grow Significantly in the Market.
7. Are there any restraints impacting market growth?
High Cost for the Equipment and Maintenance Issues.
8. Can you provide examples of recent developments in the market?
August 2022 - Austal USA announced to partner with California-based Saildrone for building Saildrone Surveyor autonomous 'uncrewed' surface vehicle in Alabama. The partnership aims to provide a cutting-edge solution for maritime domain awareness, hydrographic survey, and other missions requiring persistent wide area coverage to the U.S. Navy and other government agency customers.
9. What pricing options are available for accessing the report?
Pricing options include single-user, multi-user, and enterprise licenses priced at USD 4750, USD 5250, and USD 8750 respectively.
10. Is the market size provided in terms of value or volume?
The market size is provided in terms of value, measured in Million and volume, measured in K Unit.
11. Are there any specific market keywords associated with the report?
Yes, the market keyword associated with the report is "Unmanned Marine Vehicles Market," which aids in identifying and referencing the specific market segment covered.
12. How do I determine which pricing option suits my needs best?
The pricing options vary based on user requirements and access needs. Individual users may opt for single-user licenses, while businesses requiring broader access may choose multi-user or enterprise licenses for cost-effective access to the report.
13. Are there any additional resources or data provided in the Unmanned Marine Vehicles Market report?
While the report offers comprehensive insights, it's advisable to review the specific contents or supplementary materials provided to ascertain if additional resources or data are available.
14. How can I stay updated on further developments or reports in the Unmanned Marine Vehicles Market?
To stay informed about further developments, trends, and reports in the Unmanned Marine Vehicles Market, consider subscribing to industry newsletters, following relevant companies and organizations, or regularly checking reputable industry news sources and publications.
Methodology
Step 1 - Identification of Relevant Samples Size from Population Database


Step 2 - Approaches for Defining Global Market Size (Value, Volume* & Price*)

Note*: In applicable scenarios
Step 3 - Data Sources
Primary Research
- Web Analytics
- Survey Reports
- Research Institute
- Latest Research Reports
- Opinion Leaders
Secondary Research
- Annual Reports
- White Paper
- Latest Press Release
- Industry Association
- Paid Database
- Investor Presentations

Step 4 - Data Triangulation
Involves using different sources of information in order to increase the validity of a study
These sources are likely to be stakeholders in a program - participants, other researchers, program staff, other community members, and so on.
Then we put all data in single framework & apply various statistical tools to find out the dynamic on the market.
During the analysis stage, feedback from the stakeholder groups would be compared to determine areas of agreement as well as areas of divergence


