
Key Insights
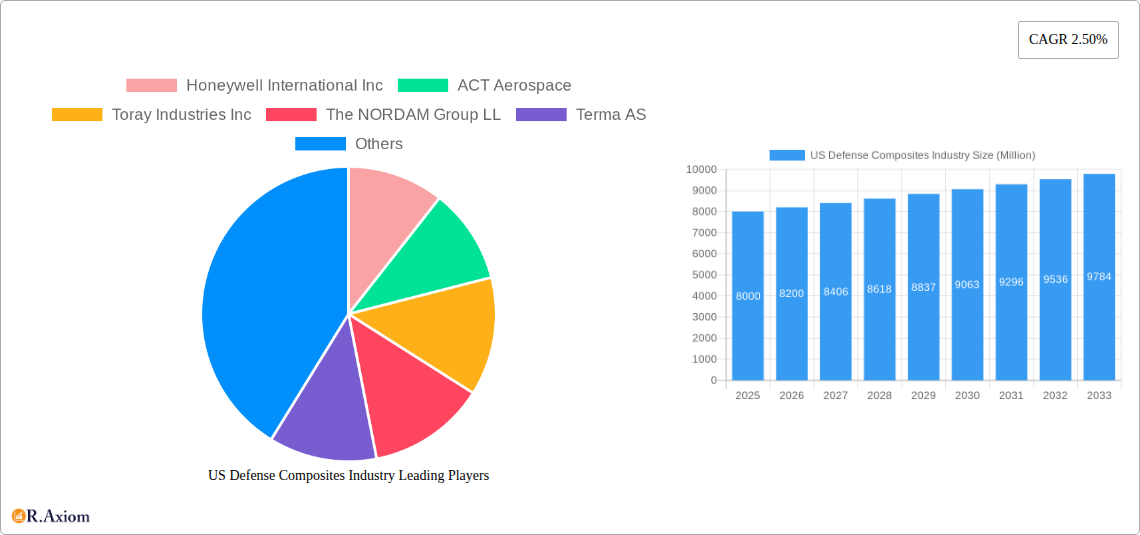
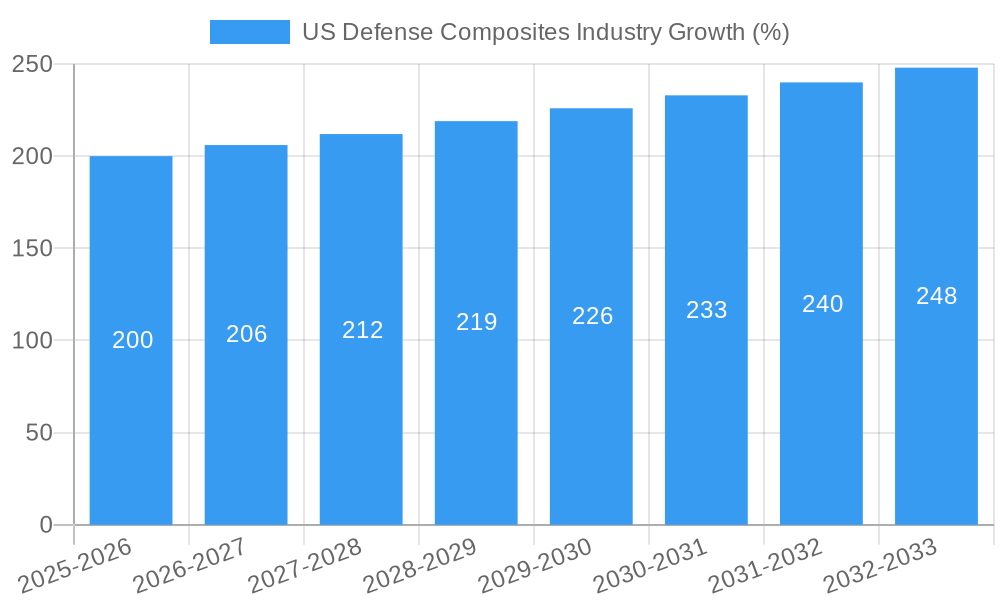
The US defense composites market, valued at approximately $8 billion in 2025, is projected to experience steady growth, driven by increasing demand for lightweight, high-strength materials in advanced military aircraft, naval vessels, and land vehicles. The market's Compound Annual Growth Rate (CAGR) of 2.5% from 2025 to 2033 reflects a sustained but not explosive expansion, influenced by factors such as ongoing military modernization programs and the rising adoption of unmanned systems. Key drivers include the need for improved fuel efficiency in aircraft, enhanced protection in armored vehicles, and the development of advanced composite materials with superior performance characteristics like improved thermal and ballistic resistance. The segmentation reveals significant opportunities within manned and unmanned aircraft applications, fueled by ongoing investments in next-generation fighter jets and drone technology. Thermoset composites currently dominate the resin type segment due to their established performance and mature manufacturing processes, though thermoplastic composites are gaining traction due to their recyclability and potential for automated manufacturing.
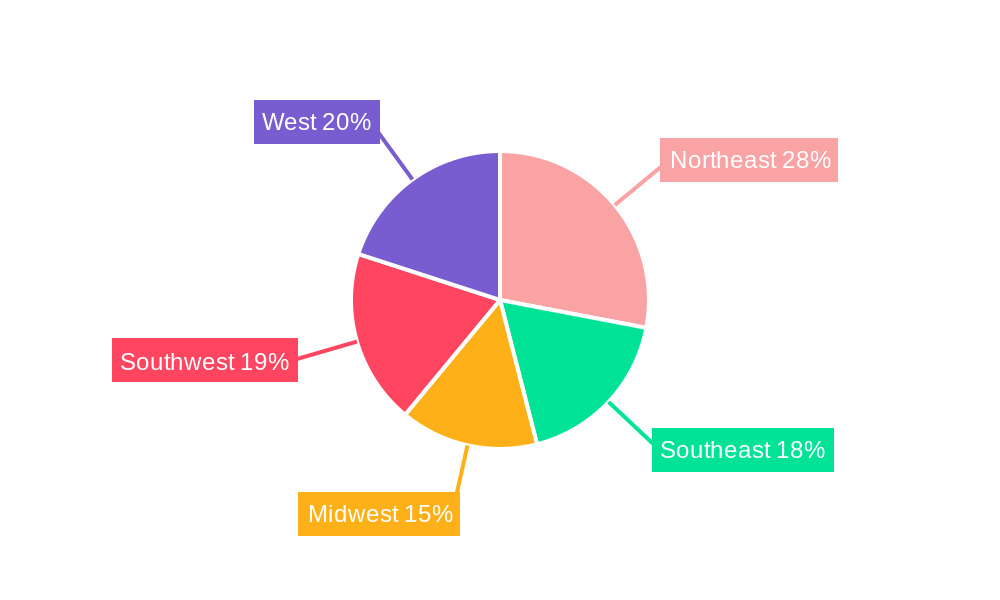
Growth is tempered by factors such as high initial material costs, the complexity of manufacturing processes, and the stringent quality control standards required for defense applications. However, ongoing research and development efforts are focusing on improving manufacturing efficiency and reducing costs, thereby addressing these restraints. Regional analysis shows the Northeast and West regions of the United States to be particularly strong markets due to the concentration of major defense contractors and aerospace manufacturers. Leading companies like Honeywell, Toray Industries, and Hexcel Corporation are at the forefront of innovation and market competition, constantly striving to deliver superior composite materials and integrated solutions to meet the demanding requirements of the US defense sector. The forecast period (2025-2033) presents substantial opportunities for industry players who can adapt to evolving technological advancements and effectively address the challenges presented by the market dynamics.
US Defense Composites Industry: A Comprehensive Market Report (2019-2033)
This in-depth report provides a comprehensive analysis of the US defense composites industry, offering invaluable insights for stakeholders, investors, and industry professionals. Covering the period from 2019 to 2033, with a focus on 2025, this report dissects market dynamics, technological advancements, and competitive landscapes to provide a clear picture of this crucial sector.
US Defense Composites Industry Market Concentration & Innovation
This section analyzes the level of market concentration within the US defense composites industry, identifying key players and their respective market shares. We delve into the innovation drivers shaping the sector, including government regulations, advancements in materials science, and the increasing demand for lighter, stronger, and more durable defense systems. The report examines the impact of mergers and acquisitions (M&A) on market consolidation, analyzing deal values and their strategic implications. We also explore the competitive landscape, including the role of product substitutes and evolving end-user trends. The analysis will cover the period from 2019-2024, using data from 2025 as the base year, and projecting forward to 2033. Expected market share data for major players like Honeywell International Inc., Hexcel Corporation, and DuPont will be provided. M&A activity will be assessed, estimating the total value of deals (in Millions) during the study period.
- Market Share Analysis: Detailed breakdown of market share held by key players in 2025 and projected market share for 2033.
- Innovation Drivers: Analysis of technological advancements, R&D investments, and government initiatives driving innovation.
- Regulatory Landscape: Evaluation of the impact of government regulations and defense standards on market growth.
- M&A Activity: Assessment of recent and projected M&A activity, including deal values and their strategic implications. (xx Million estimated total deal value 2019-2024)
US Defense Composites Industry Industry Trends & Insights
This section provides a detailed overview of the key trends shaping the US defense composites industry. We will examine market growth drivers, including increasing defense budgets, the demand for advanced military platforms, and the growing adoption of composite materials in various defense applications. The analysis will also explore technological disruptions, such as the development of next-generation composite materials and advanced manufacturing techniques, which are transforming the industry. We will assess the impact of these trends on market growth, measuring the compound annual growth rate (CAGR) and market penetration rates for key segments. Competitive dynamics, including pricing strategies and technological differentiation, will be analyzed. The analysis considers factors influencing consumer preferences, focusing on the requirements of the defense sector.
- Market Growth Drivers: Analysis of factors driving market growth, including defense budgets, technological advancements, and policy changes.
- Technological Disruptions: Assessment of emerging technologies and their impact on market dynamics.
- Competitive Dynamics: Analysis of competitive strategies, including pricing, product differentiation, and market share.
- CAGR & Market Penetration: Quantitative analysis of market growth rates and market penetration for key segments. (Projected CAGR for 2025-2033: xx%)
Dominant Markets & Segments in US Defense Composites Industry
This section identifies the dominant markets and segments within the US defense composites industry. We analyze leading applications (Manned and Unmanned Aircraft, Naval Ships, Land Vehicles, Protective Equipment, Other Applications) and resin types (Thermoset Composites, Thermoplastic Composites, Ceramic Matrix Composites) based on market size and growth potential. Key drivers for each dominant segment are highlighted, including economic policies, infrastructure developments, and specific defense program needs. The dominance analysis uses data from the historical, base, and forecast periods (2019-2033).
- Dominant Application Segment: (Example: Manned Aircraft) - Detailed analysis of market size, growth drivers (e.g., modernization programs, increasing demand), and competitive landscape.
- Dominant Resin Type: (Example: Thermoset Composites) - Detailed analysis of market size, growth drivers (e.g., cost-effectiveness, established manufacturing processes), and competitive landscape.
- Key Drivers:
- Economic policies impacting defense spending
- Infrastructure investments supporting manufacturing and deployment
- Technological advancements specific to each segment
US Defense Composites Industry Product Developments
This section provides a concise overview of significant product innovations within the US defense composites industry. We highlight key technological advancements, including material improvements, advanced manufacturing processes, and the development of new composite structures. The analysis emphasizes the competitive advantages offered by these new products, their applications in various defense systems, and their market fit based on performance, cost, and regulatory compliance.
Report Scope & Segmentation Analysis
This report segments the US defense composites market by application (Manned and Unmanned Aircraft, Naval Ships, Land Vehicles, Protective Equipment, Other Applications) and resin type (Thermoset Composites, Thermoplastic Composites, Ceramic Matrix Composites). Each segment’s market size (in Millions) is analyzed for the historical period (2019-2024), the base year (2025), and the forecast period (2025-2033). Growth projections, competitive dynamics, and key trends within each segment are discussed. The report also details the different types of composites, including their properties and application suitability.
- Application Segmentation: Each application area’s market size (in Millions), growth projections, and competitive landscape are examined.
- Resin Type Segmentation: Each resin type's market size (in Millions), growth projections, and competitive landscape are examined.
Key Drivers of US Defense Composites Industry Growth
Several key factors drive the growth of the US defense composites industry. These include substantial government investment in defense modernization programs, the increasing demand for lightweight and high-performance materials in military platforms, advancements in composite materials science and manufacturing processes, and ongoing efforts to enhance the durability and lifespan of defense equipment. Furthermore, stringent regulatory requirements for safety and performance standards also fuel demand for advanced composite materials.
Challenges in the US Defense Composites Industry Sector
The US defense composites industry faces several challenges. Supply chain vulnerabilities, particularly regarding raw materials sourcing and manufacturing capacity, pose a significant risk. Stringent quality control and certification requirements increase production costs and lead times. Intense competition from both domestic and international companies also pressures profit margins. Furthermore, the high initial investment required for advanced composite manufacturing technologies can be a barrier to entry for smaller companies. (Estimated xx Million annual loss due to supply chain disruptions in 2024)
Emerging Opportunities in US Defense Composites Industry
Despite challenges, several opportunities exist. The development of advanced composite materials with enhanced properties, such as improved strength-to-weight ratios and resistance to extreme temperatures, creates exciting possibilities for future defense systems. The growing adoption of additive manufacturing (3D printing) for composite parts offers significant potential for reducing manufacturing costs and lead times. Finally, expanding into new applications, such as hypersonic weapons and autonomous systems, creates further growth opportunities.
Leading Players in the US Defense Composites Industry Market
- Honeywell International Inc
- ACT Aerospace
- Toray Industries Inc
- The NORDAM Group LL
- Terma AS
- Advanced Composites Inc
- Leading Technology Composites Inc (LTC)
- Huntsman International LLC
- LMI AEROSPACE
- DuPont
- Solvay SA
- CFOAM LLC
- Hexcel Corporation
- Alpine Advanced Materials
- Sherwood Advanced Composite Technologies
Key Developments in US Defense Composites Industry Industry
- 2022 (October): Hexcel Corporation announces a new line of high-performance carbon fiber prepreg materials for aerospace and defense applications.
- 2023 (March): Honeywell International Inc. acquires a smaller composite material producer, expanding its market share and product portfolio.
- 2024 (June): The US Department of Defense announces a new initiative to invest in the development of advanced composite materials for hypersonic weapons. (xx Million allocated)
Strategic Outlook for US Defense Composites Industry Market
The US defense composites industry is poised for continued growth, driven by increasing defense budgets, technological advancements, and the rising demand for advanced composite materials in various defense applications. The development of next-generation composite materials and manufacturing processes will further enhance the industry's growth potential. Focus on sustainability and reducing environmental impact within manufacturing processes will also play an increasingly important role in future market dynamics. This presents significant opportunities for companies to invest in research and development, expand their manufacturing capabilities, and develop innovative products to meet the evolving needs of the defense sector.
US Defense Composites Industry Segmentation
-
1. Application
- 1.1. Manned and Unmanned Aircraft
- 1.2. Naval Ships
- 1.3. Land Vehicles
- 1.4. Protective Equipment
- 1.5. Other Applications
-
2. Resin Type
- 2.1. Thermoset Composites
- 2.2. Thermoplastic Composites
- 2.3. Ceramic Matrix Composites
US Defense Composites Industry Segmentation By Geography
-
1. North America
- 1.1. United States
- 1.2. Canada
- 1.3. Mexico
-
2. South America
- 2.1. Brazil
- 2.2. Argentina
- 2.3. Rest of South America
-
3. Europe
- 3.1. United Kingdom
- 3.2. Germany
- 3.3. France
- 3.4. Italy
- 3.5. Spain
- 3.6. Russia
- 3.7. Benelux
- 3.8. Nordics
- 3.9. Rest of Europe
-
4. Middle East & Africa
- 4.1. Turkey
- 4.2. Israel
- 4.3. GCC
- 4.4. North Africa
- 4.5. South Africa
- 4.6. Rest of Middle East & Africa
-
5. Asia Pacific
- 5.1. China
- 5.2. India
- 5.3. Japan
- 5.4. South Korea
- 5.5. ASEAN
- 5.6. Oceania
- 5.7. Rest of Asia Pacific
US Defense Composites Industry REPORT HIGHLIGHTS
| Aspects | Details |
|---|---|
| Study Period | 2019-2033 |
| Base Year | 2024 |
| Estimated Year | 2025 |
| Forecast Period | 2025-2033 |
| Historical Period | 2019-2024 |
| Growth Rate | CAGR of 2.50% from 2019-2033 |
| Segmentation |
|
Table of Contents
- 1. Introduction
- 1.1. Research Scope
- 1.2. Market Segmentation
- 1.3. Research Methodology
- 1.4. Definitions and Assumptions
- 2. Executive Summary
- 2.1. Introduction
- 3. Market Dynamics
- 3.1. Introduction
- 3.2. Market Drivers
- 3.3. Market Restrains
- 3.4. Market Trends
- 3.4.1. The Thermoplastic Composites Segment is Expected to Register the Highest Growth Rate During the Forecast Period
- 4. Market Factor Analysis
- 4.1. Porters Five Forces
- 4.2. Supply/Value Chain
- 4.3. PESTEL analysis
- 4.4. Market Entropy
- 4.5. Patent/Trademark Analysis
- 5. Global US Defense Composites Industry Analysis, Insights and Forecast, 2019-2031
- 5.1. Market Analysis, Insights and Forecast - by Application
- 5.1.1. Manned and Unmanned Aircraft
- 5.1.2. Naval Ships
- 5.1.3. Land Vehicles
- 5.1.4. Protective Equipment
- 5.1.5. Other Applications
- 5.2. Market Analysis, Insights and Forecast - by Resin Type
- 5.2.1. Thermoset Composites
- 5.2.2. Thermoplastic Composites
- 5.2.3. Ceramic Matrix Composites
- 5.3. Market Analysis, Insights and Forecast - by Region
- 5.3.1. North America
- 5.3.2. South America
- 5.3.3. Europe
- 5.3.4. Middle East & Africa
- 5.3.5. Asia Pacific
- 5.1. Market Analysis, Insights and Forecast - by Application
- 6. North America US Defense Composites Industry Analysis, Insights and Forecast, 2019-2031
- 6.1. Market Analysis, Insights and Forecast - by Application
- 6.1.1. Manned and Unmanned Aircraft
- 6.1.2. Naval Ships
- 6.1.3. Land Vehicles
- 6.1.4. Protective Equipment
- 6.1.5. Other Applications
- 6.2. Market Analysis, Insights and Forecast - by Resin Type
- 6.2.1. Thermoset Composites
- 6.2.2. Thermoplastic Composites
- 6.2.3. Ceramic Matrix Composites
- 6.1. Market Analysis, Insights and Forecast - by Application
- 7. South America US Defense Composites Industry Analysis, Insights and Forecast, 2019-2031
- 7.1. Market Analysis, Insights and Forecast - by Application
- 7.1.1. Manned and Unmanned Aircraft
- 7.1.2. Naval Ships
- 7.1.3. Land Vehicles
- 7.1.4. Protective Equipment
- 7.1.5. Other Applications
- 7.2. Market Analysis, Insights and Forecast - by Resin Type
- 7.2.1. Thermoset Composites
- 7.2.2. Thermoplastic Composites
- 7.2.3. Ceramic Matrix Composites
- 7.1. Market Analysis, Insights and Forecast - by Application
- 8. Europe US Defense Composites Industry Analysis, Insights and Forecast, 2019-2031
- 8.1. Market Analysis, Insights and Forecast - by Application
- 8.1.1. Manned and Unmanned Aircraft
- 8.1.2. Naval Ships
- 8.1.3. Land Vehicles
- 8.1.4. Protective Equipment
- 8.1.5. Other Applications
- 8.2. Market Analysis, Insights and Forecast - by Resin Type
- 8.2.1. Thermoset Composites
- 8.2.2. Thermoplastic Composites
- 8.2.3. Ceramic Matrix Composites
- 8.1. Market Analysis, Insights and Forecast - by Application
- 9. Middle East & Africa US Defense Composites Industry Analysis, Insights and Forecast, 2019-2031
- 9.1. Market Analysis, Insights and Forecast - by Application
- 9.1.1. Manned and Unmanned Aircraft
- 9.1.2. Naval Ships
- 9.1.3. Land Vehicles
- 9.1.4. Protective Equipment
- 9.1.5. Other Applications
- 9.2. Market Analysis, Insights and Forecast - by Resin Type
- 9.2.1. Thermoset Composites
- 9.2.2. Thermoplastic Composites
- 9.2.3. Ceramic Matrix Composites
- 9.1. Market Analysis, Insights and Forecast - by Application
- 10. Asia Pacific US Defense Composites Industry Analysis, Insights and Forecast, 2019-2031
- 10.1. Market Analysis, Insights and Forecast - by Application
- 10.1.1. Manned and Unmanned Aircraft
- 10.1.2. Naval Ships
- 10.1.3. Land Vehicles
- 10.1.4. Protective Equipment
- 10.1.5. Other Applications
- 10.2. Market Analysis, Insights and Forecast - by Resin Type
- 10.2.1. Thermoset Composites
- 10.2.2. Thermoplastic Composites
- 10.2.3. Ceramic Matrix Composites
- 10.1. Market Analysis, Insights and Forecast - by Application
- 11. Northeast US Defense Composites Industry Analysis, Insights and Forecast, 2019-2031
- 12. Southeast US Defense Composites Industry Analysis, Insights and Forecast, 2019-2031
- 13. Midwest US Defense Composites Industry Analysis, Insights and Forecast, 2019-2031
- 14. Southwest US Defense Composites Industry Analysis, Insights and Forecast, 2019-2031
- 15. West US Defense Composites Industry Analysis, Insights and Forecast, 2019-2031
- 16. Competitive Analysis
- 16.1. Global Market Share Analysis 2024
- 16.2. Company Profiles
- 16.2.1 Honeywell International Inc
- 16.2.1.1. Overview
- 16.2.1.2. Products
- 16.2.1.3. SWOT Analysis
- 16.2.1.4. Recent Developments
- 16.2.1.5. Financials (Based on Availability)
- 16.2.2 ACT Aerospace
- 16.2.2.1. Overview
- 16.2.2.2. Products
- 16.2.2.3. SWOT Analysis
- 16.2.2.4. Recent Developments
- 16.2.2.5. Financials (Based on Availability)
- 16.2.3 Toray Industries Inc
- 16.2.3.1. Overview
- 16.2.3.2. Products
- 16.2.3.3. SWOT Analysis
- 16.2.3.4. Recent Developments
- 16.2.3.5. Financials (Based on Availability)
- 16.2.4 The NORDAM Group LL
- 16.2.4.1. Overview
- 16.2.4.2. Products
- 16.2.4.3. SWOT Analysis
- 16.2.4.4. Recent Developments
- 16.2.4.5. Financials (Based on Availability)
- 16.2.5 Terma AS
- 16.2.5.1. Overview
- 16.2.5.2. Products
- 16.2.5.3. SWOT Analysis
- 16.2.5.4. Recent Developments
- 16.2.5.5. Financials (Based on Availability)
- 16.2.6 Advanced Composites Inc
- 16.2.6.1. Overview
- 16.2.6.2. Products
- 16.2.6.3. SWOT Analysis
- 16.2.6.4. Recent Developments
- 16.2.6.5. Financials (Based on Availability)
- 16.2.7 Leading Technology Composites Inc (LTC)
- 16.2.7.1. Overview
- 16.2.7.2. Products
- 16.2.7.3. SWOT Analysis
- 16.2.7.4. Recent Developments
- 16.2.7.5. Financials (Based on Availability)
- 16.2.8 Huntsman International LLC
- 16.2.8.1. Overview
- 16.2.8.2. Products
- 16.2.8.3. SWOT Analysis
- 16.2.8.4. Recent Developments
- 16.2.8.5. Financials (Based on Availability)
- 16.2.9 LMI AEROSPACE
- 16.2.9.1. Overview
- 16.2.9.2. Products
- 16.2.9.3. SWOT Analysis
- 16.2.9.4. Recent Developments
- 16.2.9.5. Financials (Based on Availability)
- 16.2.10 DuPont
- 16.2.10.1. Overview
- 16.2.10.2. Products
- 16.2.10.3. SWOT Analysis
- 16.2.10.4. Recent Developments
- 16.2.10.5. Financials (Based on Availability)
- 16.2.11 Solvay SA
- 16.2.11.1. Overview
- 16.2.11.2. Products
- 16.2.11.3. SWOT Analysis
- 16.2.11.4. Recent Developments
- 16.2.11.5. Financials (Based on Availability)
- 16.2.12 CFOAM LLC
- 16.2.12.1. Overview
- 16.2.12.2. Products
- 16.2.12.3. SWOT Analysis
- 16.2.12.4. Recent Developments
- 16.2.12.5. Financials (Based on Availability)
- 16.2.13 Hexcel Corporation
- 16.2.13.1. Overview
- 16.2.13.2. Products
- 16.2.13.3. SWOT Analysis
- 16.2.13.4. Recent Developments
- 16.2.13.5. Financials (Based on Availability)
- 16.2.14 Alpine Advanced Materials
- 16.2.14.1. Overview
- 16.2.14.2. Products
- 16.2.14.3. SWOT Analysis
- 16.2.14.4. Recent Developments
- 16.2.14.5. Financials (Based on Availability)
- 16.2.15 Sherwood Advanced Composite Technologies
- 16.2.15.1. Overview
- 16.2.15.2. Products
- 16.2.15.3. SWOT Analysis
- 16.2.15.4. Recent Developments
- 16.2.15.5. Financials (Based on Availability)
- 16.2.1 Honeywell International Inc
List of Figures
- Figure 1: Global US Defense Composites Industry Revenue Breakdown (Million, %) by Region 2024 & 2032
- Figure 2: United states US Defense Composites Industry Revenue (Million), by Country 2024 & 2032
- Figure 3: United states US Defense Composites Industry Revenue Share (%), by Country 2024 & 2032
- Figure 4: North America US Defense Composites Industry Revenue (Million), by Application 2024 & 2032
- Figure 5: North America US Defense Composites Industry Revenue Share (%), by Application 2024 & 2032
- Figure 6: North America US Defense Composites Industry Revenue (Million), by Resin Type 2024 & 2032
- Figure 7: North America US Defense Composites Industry Revenue Share (%), by Resin Type 2024 & 2032
- Figure 8: North America US Defense Composites Industry Revenue (Million), by Country 2024 & 2032
- Figure 9: North America US Defense Composites Industry Revenue Share (%), by Country 2024 & 2032
- Figure 10: South America US Defense Composites Industry Revenue (Million), by Application 2024 & 2032
- Figure 11: South America US Defense Composites Industry Revenue Share (%), by Application 2024 & 2032
- Figure 12: South America US Defense Composites Industry Revenue (Million), by Resin Type 2024 & 2032
- Figure 13: South America US Defense Composites Industry Revenue Share (%), by Resin Type 2024 & 2032
- Figure 14: South America US Defense Composites Industry Revenue (Million), by Country 2024 & 2032
- Figure 15: South America US Defense Composites Industry Revenue Share (%), by Country 2024 & 2032
- Figure 16: Europe US Defense Composites Industry Revenue (Million), by Application 2024 & 2032
- Figure 17: Europe US Defense Composites Industry Revenue Share (%), by Application 2024 & 2032
- Figure 18: Europe US Defense Composites Industry Revenue (Million), by Resin Type 2024 & 2032
- Figure 19: Europe US Defense Composites Industry Revenue Share (%), by Resin Type 2024 & 2032
- Figure 20: Europe US Defense Composites Industry Revenue (Million), by Country 2024 & 2032
- Figure 21: Europe US Defense Composites Industry Revenue Share (%), by Country 2024 & 2032
- Figure 22: Middle East & Africa US Defense Composites Industry Revenue (Million), by Application 2024 & 2032
- Figure 23: Middle East & Africa US Defense Composites Industry Revenue Share (%), by Application 2024 & 2032
- Figure 24: Middle East & Africa US Defense Composites Industry Revenue (Million), by Resin Type 2024 & 2032
- Figure 25: Middle East & Africa US Defense Composites Industry Revenue Share (%), by Resin Type 2024 & 2032
- Figure 26: Middle East & Africa US Defense Composites Industry Revenue (Million), by Country 2024 & 2032
- Figure 27: Middle East & Africa US Defense Composites Industry Revenue Share (%), by Country 2024 & 2032
- Figure 28: Asia Pacific US Defense Composites Industry Revenue (Million), by Application 2024 & 2032
- Figure 29: Asia Pacific US Defense Composites Industry Revenue Share (%), by Application 2024 & 2032
- Figure 30: Asia Pacific US Defense Composites Industry Revenue (Million), by Resin Type 2024 & 2032
- Figure 31: Asia Pacific US Defense Composites Industry Revenue Share (%), by Resin Type 2024 & 2032
- Figure 32: Asia Pacific US Defense Composites Industry Revenue (Million), by Country 2024 & 2032
- Figure 33: Asia Pacific US Defense Composites Industry Revenue Share (%), by Country 2024 & 2032
List of Tables
- Table 1: Global US Defense Composites Industry Revenue Million Forecast, by Region 2019 & 2032
- Table 2: Global US Defense Composites Industry Revenue Million Forecast, by Application 2019 & 2032
- Table 3: Global US Defense Composites Industry Revenue Million Forecast, by Resin Type 2019 & 2032
- Table 4: Global US Defense Composites Industry Revenue Million Forecast, by Region 2019 & 2032
- Table 5: Global US Defense Composites Industry Revenue Million Forecast, by Country 2019 & 2032
- Table 6: Northeast US Defense Composites Industry Revenue (Million) Forecast, by Application 2019 & 2032
- Table 7: Southeast US Defense Composites Industry Revenue (Million) Forecast, by Application 2019 & 2032
- Table 8: Midwest US Defense Composites Industry Revenue (Million) Forecast, by Application 2019 & 2032
- Table 9: Southwest US Defense Composites Industry Revenue (Million) Forecast, by Application 2019 & 2032
- Table 10: West US Defense Composites Industry Revenue (Million) Forecast, by Application 2019 & 2032
- Table 11: Global US Defense Composites Industry Revenue Million Forecast, by Application 2019 & 2032
- Table 12: Global US Defense Composites Industry Revenue Million Forecast, by Resin Type 2019 & 2032
- Table 13: Global US Defense Composites Industry Revenue Million Forecast, by Country 2019 & 2032
- Table 14: United States US Defense Composites Industry Revenue (Million) Forecast, by Application 2019 & 2032
- Table 15: Canada US Defense Composites Industry Revenue (Million) Forecast, by Application 2019 & 2032
- Table 16: Mexico US Defense Composites Industry Revenue (Million) Forecast, by Application 2019 & 2032
- Table 17: Global US Defense Composites Industry Revenue Million Forecast, by Application 2019 & 2032
- Table 18: Global US Defense Composites Industry Revenue Million Forecast, by Resin Type 2019 & 2032
- Table 19: Global US Defense Composites Industry Revenue Million Forecast, by Country 2019 & 2032
- Table 20: Brazil US Defense Composites Industry Revenue (Million) Forecast, by Application 2019 & 2032
- Table 21: Argentina US Defense Composites Industry Revenue (Million) Forecast, by Application 2019 & 2032
- Table 22: Rest of South America US Defense Composites Industry Revenue (Million) Forecast, by Application 2019 & 2032
- Table 23: Global US Defense Composites Industry Revenue Million Forecast, by Application 2019 & 2032
- Table 24: Global US Defense Composites Industry Revenue Million Forecast, by Resin Type 2019 & 2032
- Table 25: Global US Defense Composites Industry Revenue Million Forecast, by Country 2019 & 2032
- Table 26: United Kingdom US Defense Composites Industry Revenue (Million) Forecast, by Application 2019 & 2032
- Table 27: Germany US Defense Composites Industry Revenue (Million) Forecast, by Application 2019 & 2032
- Table 28: France US Defense Composites Industry Revenue (Million) Forecast, by Application 2019 & 2032
- Table 29: Italy US Defense Composites Industry Revenue (Million) Forecast, by Application 2019 & 2032
- Table 30: Spain US Defense Composites Industry Revenue (Million) Forecast, by Application 2019 & 2032
- Table 31: Russia US Defense Composites Industry Revenue (Million) Forecast, by Application 2019 & 2032
- Table 32: Benelux US Defense Composites Industry Revenue (Million) Forecast, by Application 2019 & 2032
- Table 33: Nordics US Defense Composites Industry Revenue (Million) Forecast, by Application 2019 & 2032
- Table 34: Rest of Europe US Defense Composites Industry Revenue (Million) Forecast, by Application 2019 & 2032
- Table 35: Global US Defense Composites Industry Revenue Million Forecast, by Application 2019 & 2032
- Table 36: Global US Defense Composites Industry Revenue Million Forecast, by Resin Type 2019 & 2032
- Table 37: Global US Defense Composites Industry Revenue Million Forecast, by Country 2019 & 2032
- Table 38: Turkey US Defense Composites Industry Revenue (Million) Forecast, by Application 2019 & 2032
- Table 39: Israel US Defense Composites Industry Revenue (Million) Forecast, by Application 2019 & 2032
- Table 40: GCC US Defense Composites Industry Revenue (Million) Forecast, by Application 2019 & 2032
- Table 41: North Africa US Defense Composites Industry Revenue (Million) Forecast, by Application 2019 & 2032
- Table 42: South Africa US Defense Composites Industry Revenue (Million) Forecast, by Application 2019 & 2032
- Table 43: Rest of Middle East & Africa US Defense Composites Industry Revenue (Million) Forecast, by Application 2019 & 2032
- Table 44: Global US Defense Composites Industry Revenue Million Forecast, by Application 2019 & 2032
- Table 45: Global US Defense Composites Industry Revenue Million Forecast, by Resin Type 2019 & 2032
- Table 46: Global US Defense Composites Industry Revenue Million Forecast, by Country 2019 & 2032
- Table 47: China US Defense Composites Industry Revenue (Million) Forecast, by Application 2019 & 2032
- Table 48: India US Defense Composites Industry Revenue (Million) Forecast, by Application 2019 & 2032
- Table 49: Japan US Defense Composites Industry Revenue (Million) Forecast, by Application 2019 & 2032
- Table 50: South Korea US Defense Composites Industry Revenue (Million) Forecast, by Application 2019 & 2032
- Table 51: ASEAN US Defense Composites Industry Revenue (Million) Forecast, by Application 2019 & 2032
- Table 52: Oceania US Defense Composites Industry Revenue (Million) Forecast, by Application 2019 & 2032
- Table 53: Rest of Asia Pacific US Defense Composites Industry Revenue (Million) Forecast, by Application 2019 & 2032
Frequently Asked Questions
1. What is the projected Compound Annual Growth Rate (CAGR) of the US Defense Composites Industry?
The projected CAGR is approximately 2.50%.
2. Which companies are prominent players in the US Defense Composites Industry?
Key companies in the market include Honeywell International Inc, ACT Aerospace, Toray Industries Inc, The NORDAM Group LL, Terma AS, Advanced Composites Inc, Leading Technology Composites Inc (LTC), Huntsman International LLC, LMI AEROSPACE, DuPont, Solvay SA, CFOAM LLC, Hexcel Corporation, Alpine Advanced Materials, Sherwood Advanced Composite Technologies.
3. What are the main segments of the US Defense Composites Industry?
The market segments include Application, Resin Type.
4. Can you provide details about the market size?
The market size is estimated to be USD XX Million as of 2022.
5. What are some drivers contributing to market growth?
N/A
6. What are the notable trends driving market growth?
The Thermoplastic Composites Segment is Expected to Register the Highest Growth Rate During the Forecast Period.
7. Are there any restraints impacting market growth?
N/A
8. Can you provide examples of recent developments in the market?
N/A
9. What pricing options are available for accessing the report?
Pricing options include single-user, multi-user, and enterprise licenses priced at USD 3800, USD 4500, and USD 5800 respectively.
10. Is the market size provided in terms of value or volume?
The market size is provided in terms of value, measured in Million.
11. Are there any specific market keywords associated with the report?
Yes, the market keyword associated with the report is "US Defense Composites Industry," which aids in identifying and referencing the specific market segment covered.
12. How do I determine which pricing option suits my needs best?
The pricing options vary based on user requirements and access needs. Individual users may opt for single-user licenses, while businesses requiring broader access may choose multi-user or enterprise licenses for cost-effective access to the report.
13. Are there any additional resources or data provided in the US Defense Composites Industry report?
While the report offers comprehensive insights, it's advisable to review the specific contents or supplementary materials provided to ascertain if additional resources or data are available.
14. How can I stay updated on further developments or reports in the US Defense Composites Industry?
To stay informed about further developments, trends, and reports in the US Defense Composites Industry, consider subscribing to industry newsletters, following relevant companies and organizations, or regularly checking reputable industry news sources and publications.
Methodology
Step 1 - Identification of Relevant Samples Size from Population Database


Step 2 - Approaches for Defining Global Market Size (Value, Volume* & Price*)

Note*: In applicable scenarios
Step 3 - Data Sources
Primary Research
- Web Analytics
- Survey Reports
- Research Institute
- Latest Research Reports
- Opinion Leaders
Secondary Research
- Annual Reports
- White Paper
- Latest Press Release
- Industry Association
- Paid Database
- Investor Presentations

Step 4 - Data Triangulation
Involves using different sources of information in order to increase the validity of a study
These sources are likely to be stakeholders in a program - participants, other researchers, program staff, other community members, and so on.
Then we put all data in single framework & apply various statistical tools to find out the dynamic on the market.
During the analysis stage, feedback from the stakeholder groups would be compared to determine areas of agreement as well as areas of divergence


