
Key Insights
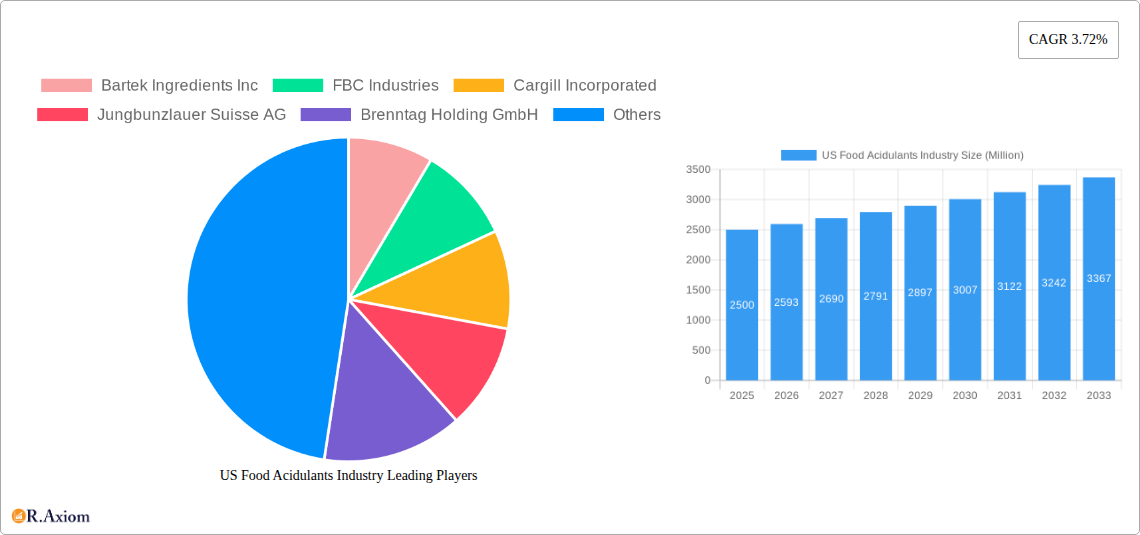
The US food acidulants market, valued at approximately $2.5 billion in 2025, is projected to experience steady growth, driven by increasing demand for processed foods and beverages. A Compound Annual Growth Rate (CAGR) of 3.72% from 2025 to 2033 indicates a market size exceeding $3.5 billion by 2033. Key drivers include the rising popularity of convenience foods, growing health consciousness leading to the use of natural acidulants, and increasing demand for enhanced flavor profiles in various food applications. The market is segmented by acid type (citric acid, lactic acid, acetic acid, and others) and application (beverages, dairy, bakery, meat & poultry, confectionery, and others). Citric acid currently holds the largest market share due to its widespread use as a flavor enhancer and preservative across numerous food categories. Beverages and dairy products represent significant application segments, reflecting the considerable use of acidulants in these sectors. However, evolving consumer preferences toward cleaner labels and reduced reliance on synthetic additives present a challenge for the market. This is further complicated by fluctuating raw material prices, impacting overall profitability for manufacturers. Nevertheless, the ongoing trend of food processing and increasing product diversification across the aforementioned segments are expected to bolster market growth in the forecast period. The competitive landscape includes major players such as Bartek Ingredients Inc, Cargill Incorporated, and Tate & Lyle PLC, who are actively engaged in product innovation and strategic partnerships to maintain market share and adapt to changing consumer demands.
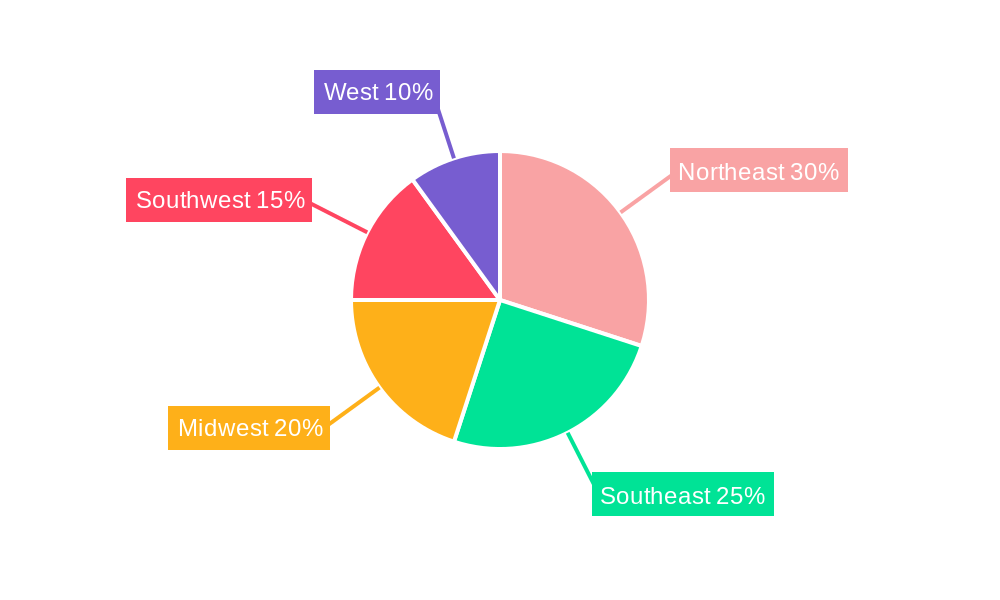
The regional distribution within the US shows significant concentration in the Northeast, Southeast, and West Coast regions, reflecting higher population density and a greater prevalence of food processing facilities. These regions are predicted to experience robust growth, influenced by factors such as rising disposable incomes, changing dietary habits, and expanding retail infrastructure. The Midwest and Southwest regions, although showing lower market penetration currently, are expected to exhibit gradual growth, driven by increasing urbanization and industrial development in these areas. Furthermore, manufacturers are focusing on developing sustainable and cost-effective production methods to mitigate environmental concerns and enhance operational efficiency, further influencing the market dynamics.
US Food Acidulants Industry: 2019-2033 Market Analysis & Forecast Report
This comprehensive report provides a detailed analysis of the US food acidulants industry, offering actionable insights for stakeholders across the value chain. Covering the period 2019-2033, with 2025 as the base year, this report meticulously examines market trends, competitive dynamics, and future growth potential. The study incorporates detailed segmentation by type (Citric Acid, Lactic Acid, Acetic Acid, Others) and application (Beverages, Dairy, Bakery, Meat & Poultry, Confectionery, Others), providing a granular understanding of market performance.
US Food Acidulants Industry Market Concentration & Innovation
The US food acidulants market exhibits a moderately concentrated structure, with several key players controlling a significant portion of the market share. While precise market share data for each company requires in-depth primary research, estimates suggest that the top five players collectively hold approximately xx% of the market, with the remaining share distributed among numerous smaller players. This indicates a relatively oligopolistic market environment.
Innovation in the food acidulants sector is driven by consumer demand for clean-label products, increasing health consciousness, and the need for improved functionality and extended shelf life in food products. Regulatory frameworks, particularly those concerning food safety and labeling, exert a considerable influence on innovation, forcing manufacturers to adapt and develop compliant products. The presence of substitute ingredients, such as natural alternatives to synthetic acidulants, presents a competitive challenge, forcing companies to invest in research and development to maintain their market positions. Mergers and acquisitions (M&A) activities further shape the market landscape, fostering consolidation and expansion. Over the past five years, the total value of M&A deals in this sector is estimated at $xx Million, reflecting a strategy of consolidation and expansion among key players.
- Key Innovation Drivers: Clean label, health & wellness trends, improved functionality, extended shelf life, regulatory compliance.
- Competitive Pressures: Substitute ingredients, cost pressures, evolving consumer preferences.
- M&A Activity: Consolidation trends observed, with an estimated $xx Million in deals in the last five years.
US Food Acidulants Industry Industry Trends & Insights
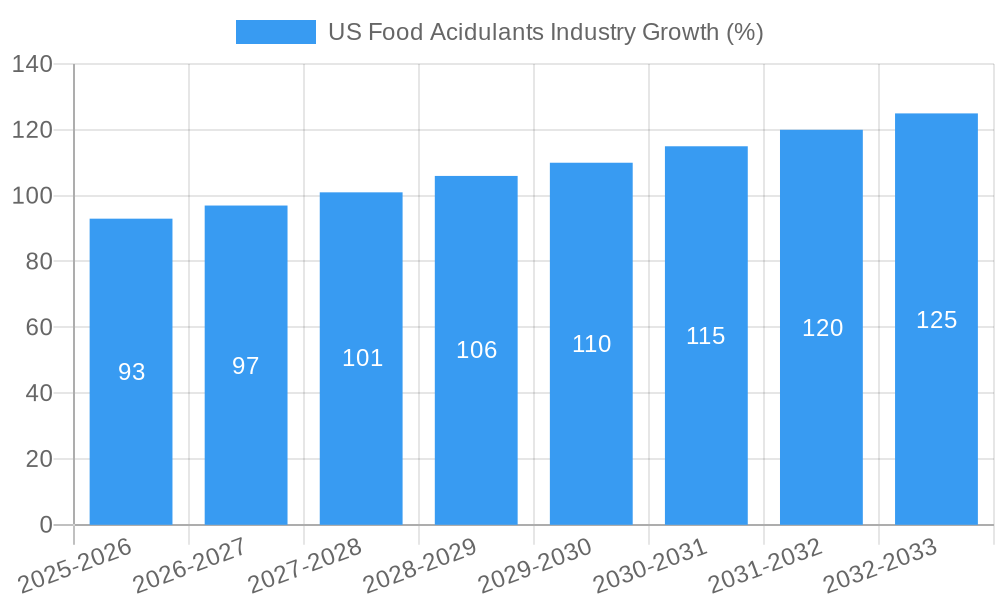
The US food acidulants market is projected to experience robust growth throughout the forecast period (2025-2033), driven by several key factors. The increasing demand for processed foods, particularly in the bakery, beverage, and dairy sectors, is a significant contributor to market expansion. Technological advancements, such as the development of more efficient and sustainable production methods, are further boosting market growth. Changing consumer preferences, with a growing preference for natural and organic food products, are influencing the development and demand for food acidulants derived from natural sources. This has prompted several companies to focus on producing and marketing acidulants using natural processes to meet the demand for healthier products. The competitive landscape is characterized by intense competition among established players, driving innovation and cost optimization strategies.
The compound annual growth rate (CAGR) for the US food acidulants market is projected to be xx% during the forecast period (2025-2033). Market penetration rates show increasing adoption of food acidulants across various food and beverage applications. The shift in consumer eating habits and demand for functional foods is expected to drive market penetration. Several factors contribute to this, including an expanding population, rising disposable incomes, and changes in dietary habits.
Dominant Markets & Segments in US Food Acidulants Industry
The US food acidulants market is dominated by the Citric Acid segment, which accounts for the largest share of the market due to its widespread applications in beverages, confectionery, and other food and beverage segments. The Beverages application segment demonstrates the highest growth potential, fueled by the rising demand for carbonated soft drinks, juices, and other ready-to-drink beverages. The geographic dominance remains largely concentrated in the East Coast and Midwest regions owing to significant concentration of food and beverage manufacturing facilities and a large consumer base.
- Key Drivers for Citric Acid Dominance: Widespread applications, cost-effectiveness, functional properties.
- Key Drivers for Beverage Application Dominance: High consumption of soft drinks, juices, and other beverages.
- Geographic Dominance: East Coast & Midwest regions due to high concentration of food processing plants and large consumer base.
US Food Acidulants Industry Product Developments
Recent product innovations in the US food acidulants industry focus on enhancing the functionality and improving the clean label appeal of acidulants. This includes developing acidulants with improved stability, solubility, and flavor profiles, while simultaneously minimizing the use of artificial additives. Several manufacturers are investing in creating acidulants derived from natural sources like fruits and vegetables to cater to the growing demand for natural ingredients in food products. These innovations have expanded applications for acidulants in niche markets, providing competitive advantages.
Report Scope & Segmentation Analysis
This report provides a comprehensive segmentation analysis of the US food acidulants market, encompassing both type and application segments.
By Type: Citric acid, lactic acid, acetic acid, and other acidulants (e.g., malic, fumaric, tartaric). Each segment's growth projections, market size, and competitive dynamics are analyzed. The Citric acid segment is projected to maintain its dominance, showing a xx% CAGR during the forecast period. Lactic and Acetic acids are also expected to show substantial growth, driven by rising demand in specific applications.
By Application: Beverages, dairy, bakery, meat & poultry, confectionery, and other food applications. Each segment's market size, growth rate, and competitive analysis are detailed. The beverages segment dominates and is projected to witness a xx% CAGR due to the increasing demand for processed and ready-to-drink beverages.
Key Drivers of US Food Acidulants Industry Growth
Several factors contribute to the growth of the US food acidulants industry. The increasing demand for processed foods is a major driver, with consumers gravitating towards convenience and ready-to-eat options. Technological advancements in acidulant production, leading to greater efficiency and cost reduction, are another significant factor. Furthermore, favorable regulatory frameworks that support the use of acidulants in food processing contribute to market expansion.
Challenges in the US Food Acidulants Industry Sector
The US food acidulants industry faces certain challenges. Fluctuations in raw material prices can impact production costs and profitability. Stringent regulatory requirements related to food safety and labeling necessitate compliance measures, increasing operational expenses for manufacturers. Intense competition among existing players and the emergence of new entrants put pressure on pricing and margins. Supply chain disruptions can create unforeseen challenges.
Emerging Opportunities in US Food Acidulants Industry
Emerging opportunities lie in catering to the growing demand for clean-label and natural food acidulants. The development of acidulants with enhanced functionality and improved shelf-life properties presents significant potential. Expanding into niche markets and applications, such as functional foods and dietary supplements, offers further growth prospects. Exploration of sustainable production methods and eco-friendly packaging solutions can provide a competitive edge.
Leading Players in the US Food Acidulants Industry Market
- Bartek Ingredients Inc
- FBC Industries
- Cargill Incorporated
- Jungbunzlauer Suisse AG
- Brenntag Holding GmbH
- Tate & Lyle PLC
- Corbion NV
- Archer Daniels Midland Company
- List Not Exhaustive
Key Developments in US Food Acidulants Industry Industry
- 2022 Q3: Cargill Incorporated announced the expansion of its citric acid production facility.
- 2023 Q1: Tate & Lyle PLC launched a new range of clean-label acidulants.
- 2024 Q2: Brenntag Holding GmbH secured a new distribution agreement for a natural acidulant.
- Further developments will be included in the final report.
Strategic Outlook for US Food Acidulants Industry Market
The US food acidulants market presents a promising outlook, driven by several factors including rising consumer demand for processed foods, growing preference for clean-label ingredients, and ongoing innovation in acidulant production. The market is poised for continued growth, with significant opportunities for companies that can effectively adapt to evolving consumer preferences and regulatory changes while capitalizing on technological advancements in the industry. The focus on sustainability and the development of novel applications will play an increasingly significant role in shaping the future of this sector.
US Food Acidulants Industry Segmentation
-
1. Type
- 1.1. Citric Acid
- 1.2. Lactic Acid
- 1.3. Acetic Acid
- 1.4. Others
-
2. Application
- 2.1. Beverages
- 2.2. Dairy
- 2.3. Bakery
- 2.4. Meat & Poultry
- 2.5. Confectionery
- 2.6. Others
US Food Acidulants Industry Segmentation By Geography
-
1. North America
- 1.1. United States
- 1.2. Canada
- 1.3. Mexico
-
2. South America
- 2.1. Brazil
- 2.2. Argentina
- 2.3. Rest of South America
-
3. Europe
- 3.1. United Kingdom
- 3.2. Germany
- 3.3. France
- 3.4. Italy
- 3.5. Spain
- 3.6. Russia
- 3.7. Benelux
- 3.8. Nordics
- 3.9. Rest of Europe
-
4. Middle East & Africa
- 4.1. Turkey
- 4.2. Israel
- 4.3. GCC
- 4.4. North Africa
- 4.5. South Africa
- 4.6. Rest of Middle East & Africa
-
5. Asia Pacific
- 5.1. China
- 5.2. India
- 5.3. Japan
- 5.4. South Korea
- 5.5. ASEAN
- 5.6. Oceania
- 5.7. Rest of Asia Pacific
US Food Acidulants Industry REPORT HIGHLIGHTS
| Aspects | Details |
|---|---|
| Study Period | 2019-2033 |
| Base Year | 2024 |
| Estimated Year | 2025 |
| Forecast Period | 2025-2033 |
| Historical Period | 2019-2024 |
| Growth Rate | CAGR of 3.72% from 2019-2033 |
| Segmentation |
|
Table of Contents
- 1. Introduction
- 1.1. Research Scope
- 1.2. Market Segmentation
- 1.3. Research Methodology
- 1.4. Definitions and Assumptions
- 2. Executive Summary
- 2.1. Introduction
- 3. Market Dynamics
- 3.1. Introduction
- 3.2. Market Drivers
- 3.2.1. Increasing Demand for Low-Fat and Low-Calorie Food; Increasing Product Innovation
- 3.3. Market Restrains
- 3.3.1. ; Threat of New Entrants; Bargaining Power of Buyers/Consumers; Bargaining Power of Suppliers; Threat of Substitute Products; Degree Of Competition
- 3.4. Market Trends
- 3.4.1. Citric Acid holds the Largest Market
- 4. Market Factor Analysis
- 4.1. Porters Five Forces
- 4.2. Supply/Value Chain
- 4.3. PESTEL analysis
- 4.4. Market Entropy
- 4.5. Patent/Trademark Analysis
- 5. Global US Food Acidulants Industry Analysis, Insights and Forecast, 2019-2031
- 5.1. Market Analysis, Insights and Forecast - by Type
- 5.1.1. Citric Acid
- 5.1.2. Lactic Acid
- 5.1.3. Acetic Acid
- 5.1.4. Others
- 5.2. Market Analysis, Insights and Forecast - by Application
- 5.2.1. Beverages
- 5.2.2. Dairy
- 5.2.3. Bakery
- 5.2.4. Meat & Poultry
- 5.2.5. Confectionery
- 5.2.6. Others
- 5.3. Market Analysis, Insights and Forecast - by Region
- 5.3.1. North America
- 5.3.2. South America
- 5.3.3. Europe
- 5.3.4. Middle East & Africa
- 5.3.5. Asia Pacific
- 5.1. Market Analysis, Insights and Forecast - by Type
- 6. North America US Food Acidulants Industry Analysis, Insights and Forecast, 2019-2031
- 6.1. Market Analysis, Insights and Forecast - by Type
- 6.1.1. Citric Acid
- 6.1.2. Lactic Acid
- 6.1.3. Acetic Acid
- 6.1.4. Others
- 6.2. Market Analysis, Insights and Forecast - by Application
- 6.2.1. Beverages
- 6.2.2. Dairy
- 6.2.3. Bakery
- 6.2.4. Meat & Poultry
- 6.2.5. Confectionery
- 6.2.6. Others
- 6.1. Market Analysis, Insights and Forecast - by Type
- 7. South America US Food Acidulants Industry Analysis, Insights and Forecast, 2019-2031
- 7.1. Market Analysis, Insights and Forecast - by Type
- 7.1.1. Citric Acid
- 7.1.2. Lactic Acid
- 7.1.3. Acetic Acid
- 7.1.4. Others
- 7.2. Market Analysis, Insights and Forecast - by Application
- 7.2.1. Beverages
- 7.2.2. Dairy
- 7.2.3. Bakery
- 7.2.4. Meat & Poultry
- 7.2.5. Confectionery
- 7.2.6. Others
- 7.1. Market Analysis, Insights and Forecast - by Type
- 8. Europe US Food Acidulants Industry Analysis, Insights and Forecast, 2019-2031
- 8.1. Market Analysis, Insights and Forecast - by Type
- 8.1.1. Citric Acid
- 8.1.2. Lactic Acid
- 8.1.3. Acetic Acid
- 8.1.4. Others
- 8.2. Market Analysis, Insights and Forecast - by Application
- 8.2.1. Beverages
- 8.2.2. Dairy
- 8.2.3. Bakery
- 8.2.4. Meat & Poultry
- 8.2.5. Confectionery
- 8.2.6. Others
- 8.1. Market Analysis, Insights and Forecast - by Type
- 9. Middle East & Africa US Food Acidulants Industry Analysis, Insights and Forecast, 2019-2031
- 9.1. Market Analysis, Insights and Forecast - by Type
- 9.1.1. Citric Acid
- 9.1.2. Lactic Acid
- 9.1.3. Acetic Acid
- 9.1.4. Others
- 9.2. Market Analysis, Insights and Forecast - by Application
- 9.2.1. Beverages
- 9.2.2. Dairy
- 9.2.3. Bakery
- 9.2.4. Meat & Poultry
- 9.2.5. Confectionery
- 9.2.6. Others
- 9.1. Market Analysis, Insights and Forecast - by Type
- 10. Asia Pacific US Food Acidulants Industry Analysis, Insights and Forecast, 2019-2031
- 10.1. Market Analysis, Insights and Forecast - by Type
- 10.1.1. Citric Acid
- 10.1.2. Lactic Acid
- 10.1.3. Acetic Acid
- 10.1.4. Others
- 10.2. Market Analysis, Insights and Forecast - by Application
- 10.2.1. Beverages
- 10.2.2. Dairy
- 10.2.3. Bakery
- 10.2.4. Meat & Poultry
- 10.2.5. Confectionery
- 10.2.6. Others
- 10.1. Market Analysis, Insights and Forecast - by Type
- 11. Northeast US Food Acidulants Industry Analysis, Insights and Forecast, 2019-2031
- 12. Southeast US Food Acidulants Industry Analysis, Insights and Forecast, 2019-2031
- 13. Midwest US Food Acidulants Industry Analysis, Insights and Forecast, 2019-2031
- 14. Southwest US Food Acidulants Industry Analysis, Insights and Forecast, 2019-2031
- 15. West US Food Acidulants Industry Analysis, Insights and Forecast, 2019-2031
- 16. Competitive Analysis
- 16.1. Global Market Share Analysis 2024
- 16.2. Company Profiles
- 16.2.1 Bartek Ingredients Inc
- 16.2.1.1. Overview
- 16.2.1.2. Products
- 16.2.1.3. SWOT Analysis
- 16.2.1.4. Recent Developments
- 16.2.1.5. Financials (Based on Availability)
- 16.2.2 FBC Industries
- 16.2.2.1. Overview
- 16.2.2.2. Products
- 16.2.2.3. SWOT Analysis
- 16.2.2.4. Recent Developments
- 16.2.2.5. Financials (Based on Availability)
- 16.2.3 Cargill Incorporated
- 16.2.3.1. Overview
- 16.2.3.2. Products
- 16.2.3.3. SWOT Analysis
- 16.2.3.4. Recent Developments
- 16.2.3.5. Financials (Based on Availability)
- 16.2.4 Jungbunzlauer Suisse AG
- 16.2.4.1. Overview
- 16.2.4.2. Products
- 16.2.4.3. SWOT Analysis
- 16.2.4.4. Recent Developments
- 16.2.4.5. Financials (Based on Availability)
- 16.2.5 Brenntag Holding GmbH
- 16.2.5.1. Overview
- 16.2.5.2. Products
- 16.2.5.3. SWOT Analysis
- 16.2.5.4. Recent Developments
- 16.2.5.5. Financials (Based on Availability)
- 16.2.6 Tate & Lyle PLC
- 16.2.6.1. Overview
- 16.2.6.2. Products
- 16.2.6.3. SWOT Analysis
- 16.2.6.4. Recent Developments
- 16.2.6.5. Financials (Based on Availability)
- 16.2.7 Corbion NV
- 16.2.7.1. Overview
- 16.2.7.2. Products
- 16.2.7.3. SWOT Analysis
- 16.2.7.4. Recent Developments
- 16.2.7.5. Financials (Based on Availability)
- 16.2.8 Archer Daniels Midland Company*List Not Exhaustive
- 16.2.8.1. Overview
- 16.2.8.2. Products
- 16.2.8.3. SWOT Analysis
- 16.2.8.4. Recent Developments
- 16.2.8.5. Financials (Based on Availability)
- 16.2.1 Bartek Ingredients Inc
List of Figures
- Figure 1: Global US Food Acidulants Industry Revenue Breakdown (Million, %) by Region 2024 & 2032
- Figure 2: United states US Food Acidulants Industry Revenue (Million), by Country 2024 & 2032
- Figure 3: United states US Food Acidulants Industry Revenue Share (%), by Country 2024 & 2032
- Figure 4: North America US Food Acidulants Industry Revenue (Million), by Type 2024 & 2032
- Figure 5: North America US Food Acidulants Industry Revenue Share (%), by Type 2024 & 2032
- Figure 6: North America US Food Acidulants Industry Revenue (Million), by Application 2024 & 2032
- Figure 7: North America US Food Acidulants Industry Revenue Share (%), by Application 2024 & 2032
- Figure 8: North America US Food Acidulants Industry Revenue (Million), by Country 2024 & 2032
- Figure 9: North America US Food Acidulants Industry Revenue Share (%), by Country 2024 & 2032
- Figure 10: South America US Food Acidulants Industry Revenue (Million), by Type 2024 & 2032
- Figure 11: South America US Food Acidulants Industry Revenue Share (%), by Type 2024 & 2032
- Figure 12: South America US Food Acidulants Industry Revenue (Million), by Application 2024 & 2032
- Figure 13: South America US Food Acidulants Industry Revenue Share (%), by Application 2024 & 2032
- Figure 14: South America US Food Acidulants Industry Revenue (Million), by Country 2024 & 2032
- Figure 15: South America US Food Acidulants Industry Revenue Share (%), by Country 2024 & 2032
- Figure 16: Europe US Food Acidulants Industry Revenue (Million), by Type 2024 & 2032
- Figure 17: Europe US Food Acidulants Industry Revenue Share (%), by Type 2024 & 2032
- Figure 18: Europe US Food Acidulants Industry Revenue (Million), by Application 2024 & 2032
- Figure 19: Europe US Food Acidulants Industry Revenue Share (%), by Application 2024 & 2032
- Figure 20: Europe US Food Acidulants Industry Revenue (Million), by Country 2024 & 2032
- Figure 21: Europe US Food Acidulants Industry Revenue Share (%), by Country 2024 & 2032
- Figure 22: Middle East & Africa US Food Acidulants Industry Revenue (Million), by Type 2024 & 2032
- Figure 23: Middle East & Africa US Food Acidulants Industry Revenue Share (%), by Type 2024 & 2032
- Figure 24: Middle East & Africa US Food Acidulants Industry Revenue (Million), by Application 2024 & 2032
- Figure 25: Middle East & Africa US Food Acidulants Industry Revenue Share (%), by Application 2024 & 2032
- Figure 26: Middle East & Africa US Food Acidulants Industry Revenue (Million), by Country 2024 & 2032
- Figure 27: Middle East & Africa US Food Acidulants Industry Revenue Share (%), by Country 2024 & 2032
- Figure 28: Asia Pacific US Food Acidulants Industry Revenue (Million), by Type 2024 & 2032
- Figure 29: Asia Pacific US Food Acidulants Industry Revenue Share (%), by Type 2024 & 2032
- Figure 30: Asia Pacific US Food Acidulants Industry Revenue (Million), by Application 2024 & 2032
- Figure 31: Asia Pacific US Food Acidulants Industry Revenue Share (%), by Application 2024 & 2032
- Figure 32: Asia Pacific US Food Acidulants Industry Revenue (Million), by Country 2024 & 2032
- Figure 33: Asia Pacific US Food Acidulants Industry Revenue Share (%), by Country 2024 & 2032
List of Tables
- Table 1: Global US Food Acidulants Industry Revenue Million Forecast, by Region 2019 & 2032
- Table 2: Global US Food Acidulants Industry Revenue Million Forecast, by Type 2019 & 2032
- Table 3: Global US Food Acidulants Industry Revenue Million Forecast, by Application 2019 & 2032
- Table 4: Global US Food Acidulants Industry Revenue Million Forecast, by Region 2019 & 2032
- Table 5: Global US Food Acidulants Industry Revenue Million Forecast, by Country 2019 & 2032
- Table 6: Northeast US Food Acidulants Industry Revenue (Million) Forecast, by Application 2019 & 2032
- Table 7: Southeast US Food Acidulants Industry Revenue (Million) Forecast, by Application 2019 & 2032
- Table 8: Midwest US Food Acidulants Industry Revenue (Million) Forecast, by Application 2019 & 2032
- Table 9: Southwest US Food Acidulants Industry Revenue (Million) Forecast, by Application 2019 & 2032
- Table 10: West US Food Acidulants Industry Revenue (Million) Forecast, by Application 2019 & 2032
- Table 11: Global US Food Acidulants Industry Revenue Million Forecast, by Type 2019 & 2032
- Table 12: Global US Food Acidulants Industry Revenue Million Forecast, by Application 2019 & 2032
- Table 13: Global US Food Acidulants Industry Revenue Million Forecast, by Country 2019 & 2032
- Table 14: United States US Food Acidulants Industry Revenue (Million) Forecast, by Application 2019 & 2032
- Table 15: Canada US Food Acidulants Industry Revenue (Million) Forecast, by Application 2019 & 2032
- Table 16: Mexico US Food Acidulants Industry Revenue (Million) Forecast, by Application 2019 & 2032
- Table 17: Global US Food Acidulants Industry Revenue Million Forecast, by Type 2019 & 2032
- Table 18: Global US Food Acidulants Industry Revenue Million Forecast, by Application 2019 & 2032
- Table 19: Global US Food Acidulants Industry Revenue Million Forecast, by Country 2019 & 2032
- Table 20: Brazil US Food Acidulants Industry Revenue (Million) Forecast, by Application 2019 & 2032
- Table 21: Argentina US Food Acidulants Industry Revenue (Million) Forecast, by Application 2019 & 2032
- Table 22: Rest of South America US Food Acidulants Industry Revenue (Million) Forecast, by Application 2019 & 2032
- Table 23: Global US Food Acidulants Industry Revenue Million Forecast, by Type 2019 & 2032
- Table 24: Global US Food Acidulants Industry Revenue Million Forecast, by Application 2019 & 2032
- Table 25: Global US Food Acidulants Industry Revenue Million Forecast, by Country 2019 & 2032
- Table 26: United Kingdom US Food Acidulants Industry Revenue (Million) Forecast, by Application 2019 & 2032
- Table 27: Germany US Food Acidulants Industry Revenue (Million) Forecast, by Application 2019 & 2032
- Table 28: France US Food Acidulants Industry Revenue (Million) Forecast, by Application 2019 & 2032
- Table 29: Italy US Food Acidulants Industry Revenue (Million) Forecast, by Application 2019 & 2032
- Table 30: Spain US Food Acidulants Industry Revenue (Million) Forecast, by Application 2019 & 2032
- Table 31: Russia US Food Acidulants Industry Revenue (Million) Forecast, by Application 2019 & 2032
- Table 32: Benelux US Food Acidulants Industry Revenue (Million) Forecast, by Application 2019 & 2032
- Table 33: Nordics US Food Acidulants Industry Revenue (Million) Forecast, by Application 2019 & 2032
- Table 34: Rest of Europe US Food Acidulants Industry Revenue (Million) Forecast, by Application 2019 & 2032
- Table 35: Global US Food Acidulants Industry Revenue Million Forecast, by Type 2019 & 2032
- Table 36: Global US Food Acidulants Industry Revenue Million Forecast, by Application 2019 & 2032
- Table 37: Global US Food Acidulants Industry Revenue Million Forecast, by Country 2019 & 2032
- Table 38: Turkey US Food Acidulants Industry Revenue (Million) Forecast, by Application 2019 & 2032
- Table 39: Israel US Food Acidulants Industry Revenue (Million) Forecast, by Application 2019 & 2032
- Table 40: GCC US Food Acidulants Industry Revenue (Million) Forecast, by Application 2019 & 2032
- Table 41: North Africa US Food Acidulants Industry Revenue (Million) Forecast, by Application 2019 & 2032
- Table 42: South Africa US Food Acidulants Industry Revenue (Million) Forecast, by Application 2019 & 2032
- Table 43: Rest of Middle East & Africa US Food Acidulants Industry Revenue (Million) Forecast, by Application 2019 & 2032
- Table 44: Global US Food Acidulants Industry Revenue Million Forecast, by Type 2019 & 2032
- Table 45: Global US Food Acidulants Industry Revenue Million Forecast, by Application 2019 & 2032
- Table 46: Global US Food Acidulants Industry Revenue Million Forecast, by Country 2019 & 2032
- Table 47: China US Food Acidulants Industry Revenue (Million) Forecast, by Application 2019 & 2032
- Table 48: India US Food Acidulants Industry Revenue (Million) Forecast, by Application 2019 & 2032
- Table 49: Japan US Food Acidulants Industry Revenue (Million) Forecast, by Application 2019 & 2032
- Table 50: South Korea US Food Acidulants Industry Revenue (Million) Forecast, by Application 2019 & 2032
- Table 51: ASEAN US Food Acidulants Industry Revenue (Million) Forecast, by Application 2019 & 2032
- Table 52: Oceania US Food Acidulants Industry Revenue (Million) Forecast, by Application 2019 & 2032
- Table 53: Rest of Asia Pacific US Food Acidulants Industry Revenue (Million) Forecast, by Application 2019 & 2032
Frequently Asked Questions
1. What is the projected Compound Annual Growth Rate (CAGR) of the US Food Acidulants Industry?
The projected CAGR is approximately 3.72%.
2. Which companies are prominent players in the US Food Acidulants Industry?
Key companies in the market include Bartek Ingredients Inc, FBC Industries, Cargill Incorporated, Jungbunzlauer Suisse AG, Brenntag Holding GmbH, Tate & Lyle PLC, Corbion NV, Archer Daniels Midland Company*List Not Exhaustive.
3. What are the main segments of the US Food Acidulants Industry?
The market segments include Type, Application.
4. Can you provide details about the market size?
The market size is estimated to be USD XX Million as of 2022.
5. What are some drivers contributing to market growth?
Increasing Demand for Low-Fat and Low-Calorie Food; Increasing Product Innovation.
6. What are the notable trends driving market growth?
Citric Acid holds the Largest Market.
7. Are there any restraints impacting market growth?
; Threat of New Entrants; Bargaining Power of Buyers/Consumers; Bargaining Power of Suppliers; Threat of Substitute Products; Degree Of Competition.
8. Can you provide examples of recent developments in the market?
N/A
9. What pricing options are available for accessing the report?
Pricing options include single-user, multi-user, and enterprise licenses priced at USD 3800, USD 4500, and USD 5800 respectively.
10. Is the market size provided in terms of value or volume?
The market size is provided in terms of value, measured in Million.
11. Are there any specific market keywords associated with the report?
Yes, the market keyword associated with the report is "US Food Acidulants Industry," which aids in identifying and referencing the specific market segment covered.
12. How do I determine which pricing option suits my needs best?
The pricing options vary based on user requirements and access needs. Individual users may opt for single-user licenses, while businesses requiring broader access may choose multi-user or enterprise licenses for cost-effective access to the report.
13. Are there any additional resources or data provided in the US Food Acidulants Industry report?
While the report offers comprehensive insights, it's advisable to review the specific contents or supplementary materials provided to ascertain if additional resources or data are available.
14. How can I stay updated on further developments or reports in the US Food Acidulants Industry?
To stay informed about further developments, trends, and reports in the US Food Acidulants Industry, consider subscribing to industry newsletters, following relevant companies and organizations, or regularly checking reputable industry news sources and publications.
Methodology
Step 1 - Identification of Relevant Samples Size from Population Database


Step 2 - Approaches for Defining Global Market Size (Value, Volume* & Price*)

Note*: In applicable scenarios
Step 3 - Data Sources
Primary Research
- Web Analytics
- Survey Reports
- Research Institute
- Latest Research Reports
- Opinion Leaders
Secondary Research
- Annual Reports
- White Paper
- Latest Press Release
- Industry Association
- Paid Database
- Investor Presentations

Step 4 - Data Triangulation
Involves using different sources of information in order to increase the validity of a study
These sources are likely to be stakeholders in a program - participants, other researchers, program staff, other community members, and so on.
Then we put all data in single framework & apply various statistical tools to find out the dynamic on the market.
During the analysis stage, feedback from the stakeholder groups would be compared to determine areas of agreement as well as areas of divergence


