
Key Insights
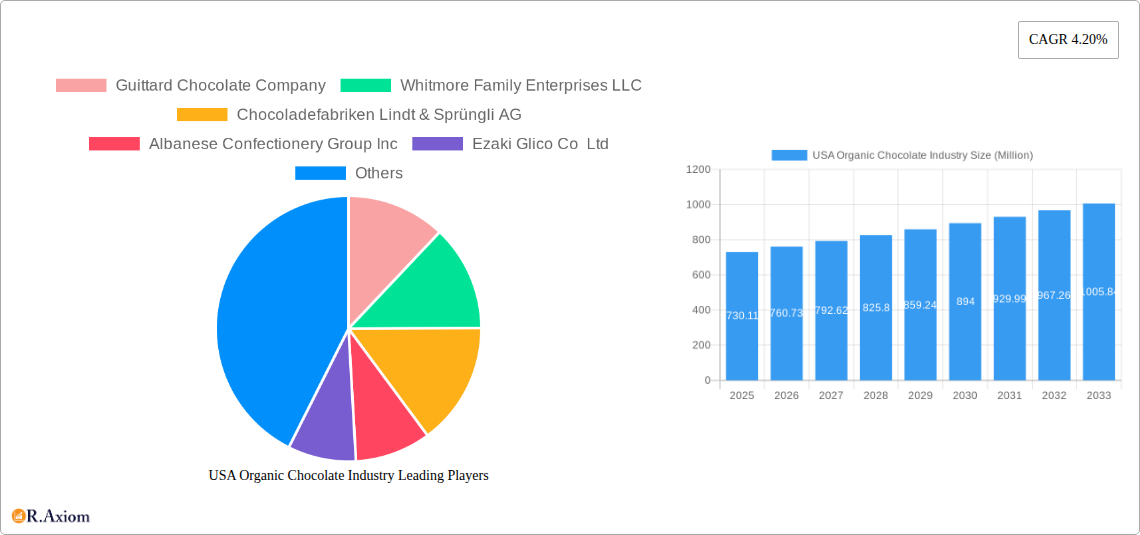
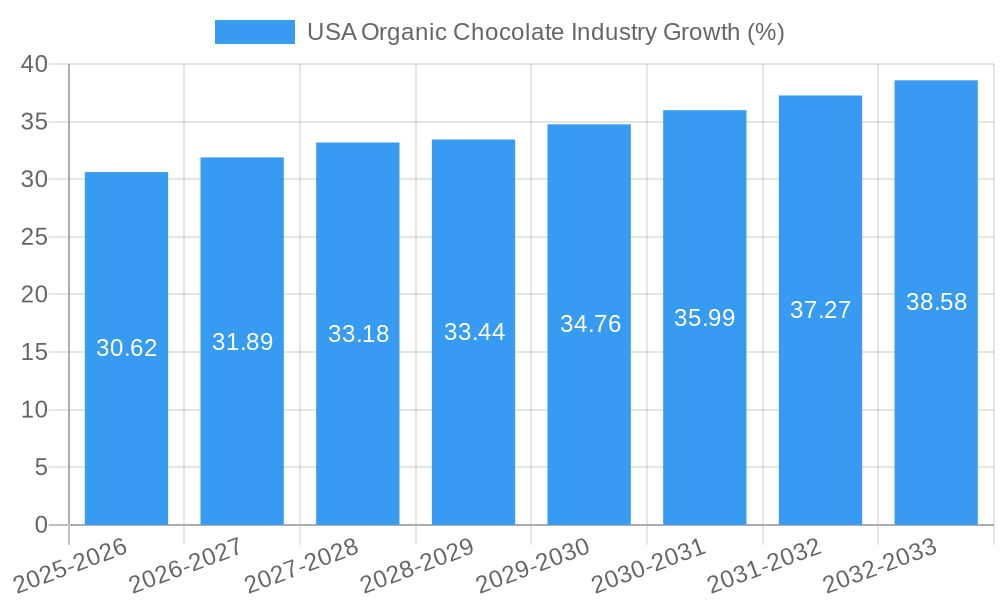
The US organic chocolate market, valued at $730.11 million in 2025, is projected to experience robust growth, driven by increasing consumer demand for healthier and ethically sourced confectionery. The compound annual growth rate (CAGR) of 4.20% from 2025 to 2033 indicates a steadily expanding market. This growth is fueled by several key factors. Rising consumer awareness of the health benefits associated with organic products, including antioxidants and reduced sugar content, is a major driver. Furthermore, growing concerns about sustainability and ethical sourcing practices within the chocolate industry are pushing consumers towards organic options. The market segmentation reveals strong performance across various distribution channels, with supermarkets/hypermarkets, online retail stores, and convenience stores all playing significant roles. Dark chocolate continues to be a popular variant, reflecting consumer preferences for intense flavor profiles and potential health benefits. Key players like Hershey, Mondelez, and Lindt, alongside smaller, specialized organic brands, are actively shaping the market landscape through product innovation and targeted marketing. Competition is expected to remain intense, with companies focusing on expanding their product lines, enhancing distribution networks, and emphasizing sustainability initiatives to attract environmentally conscious consumers.
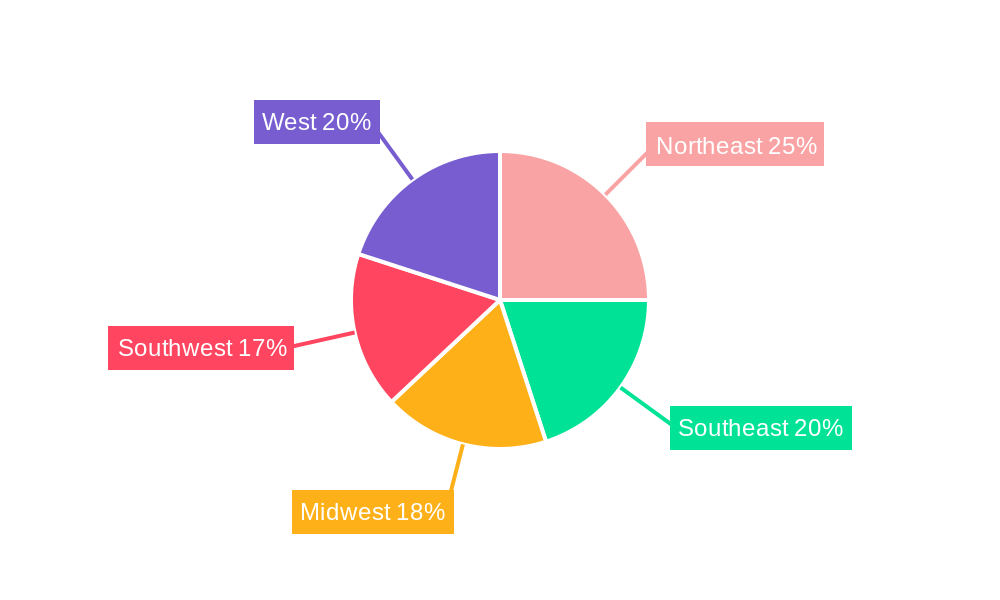
The projected market growth necessitates strategic planning for companies operating within this sector. Analyzing regional trends within the US – Northeast, Southeast, Midwest, Southwest, and West – is crucial for optimizing distribution and marketing strategies. Future growth will hinge on continued innovation, the effective communication of sustainability efforts, and the successful marketing of organic chocolate's unique health and ethical attributes. The continued expansion of online retail channels also presents substantial opportunities for reaching broader consumer segments. Maintaining a competitive edge requires continuous adaptation to evolving consumer preferences and a commitment to ethical and sustainable sourcing practices. This commitment, coupled with product diversification and targeted marketing, will be key to achieving success within this expanding market.
USA Organic Chocolate Industry: A Comprehensive Market Report (2019-2033)
This in-depth report provides a comprehensive analysis of the USA organic chocolate industry, encompassing market size, segmentation, key players, growth drivers, challenges, and future opportunities. The report covers the period 2019-2033, with a focus on the base year 2025 and a forecast period of 2025-2033. It's an invaluable resource for industry stakeholders, investors, and businesses seeking to understand and capitalize on this dynamic market. The total market size in 2025 is estimated at $XX Million.
USA Organic Chocolate Industry Market Concentration & Innovation
The USA organic chocolate market exhibits a moderately concentrated structure, with a few large multinational players holding significant market share. However, a growing number of smaller, niche organic chocolate producers are also emerging, driven by increasing consumer demand for premium, ethically sourced products. Market share data for 2024 reveals that Mondelēz International Inc. and The Hershey Company hold the largest shares, estimated at xx% and xx%, respectively. Smaller players like Vosges Haut-Chocolat LLC and Mast Brothers & Co. hold niche segments.
Innovation is a key driver, with companies focusing on:
- Product diversification: Expanding beyond traditional dark, milk, and white chocolate varieties to incorporate unique flavors, textures, and ingredients.
- Sustainable sourcing: Highlighting ethical and environmentally responsible sourcing practices to attract conscious consumers.
- Premiumization: Offering high-quality, artisan chocolates at a premium price point.
- Technological advancements: Implementing efficient manufacturing processes and innovative packaging solutions.
Regulatory frameworks, including organic certification standards and food safety regulations, significantly influence industry operations. The presence of substitutes, such as other confectionery items and healthy snacks, necessitates continuous innovation to maintain competitiveness. M&A activity is relatively moderate, with deal values in recent years ranging from $XX Million to $XX Million, reflecting consolidation within the market. Examples include recent strategic partnerships focused on distribution and supply chain optimization.
USA Organic Chocolate Industry Industry Trends & Insights
The USA organic chocolate market is experiencing robust growth, driven by several key factors. The rising consumer preference for healthier and ethically sourced foods is a significant driver, boosting demand for organic chocolate. This trend is further amplified by growing awareness of the environmental and social impacts of conventional chocolate production. The market has experienced a CAGR of xx% during the historical period (2019-2024), and this positive growth trajectory is expected to continue through 2033. Market penetration of organic chocolate within the overall chocolate confectionery market is currently estimated at approximately xx%, with significant growth potential. Technological disruptions are influencing production efficiency and sustainability, while changing consumer preferences toward novel flavors and product formats challenge established players. Intense competitive dynamics, particularly amongst the larger players, are shaping pricing strategies and product development efforts.
Dominant Markets & Segments in USA Organic Chocolate Industry
The organic chocolate market in the USA is geographically diverse, with no single region dominating. However, urban areas with higher disposable incomes and health-conscious populations tend to exhibit higher consumption rates.
- Confectionery Variant: Milk chocolate currently holds the largest market share due to its broad appeal, followed by dark chocolate and white chocolate. The growth of dark chocolate is driven by its health halo.
- Distribution Channel: Supermarket/hypermarkets remain the primary distribution channel, although online retail stores are rapidly gaining traction, driven by increasing e-commerce penetration. Convenience stores contribute to a smaller yet significant segment.
Key drivers for segment dominance:
- Supermarkets/Hypermarkets: Extensive reach, established supply chains, and consumer familiarity.
- Online Retail Stores: Convenience, wider product selection, and targeted marketing campaigns.
- Milk Chocolate: Wide appeal, affordability, and established consumer preference.
USA Organic Chocolate Industry Product Developments
Recent product innovations include the expansion of organic chocolate into new formats, such as bars with added nuts, fruits, and spices. Companies are also focusing on unique flavor profiles and limited-edition offerings to cater to evolving consumer preferences. Technological advancements in processing and packaging are enhancing product quality and sustainability. The focus on clean label ingredients and transparent sourcing information emphasizes the growing importance of health and ethical considerations in the market.
Report Scope & Segmentation Analysis
This report comprehensively segments the USA organic chocolate market based on confectionery variant (dark, milk, white chocolate), and distribution channel (convenience store, online retail store, supermarket/hypermarket, others). Each segment's growth projection, market size, and competitive dynamics are analyzed. For example, the supermarket/hypermarket channel exhibits consistent growth driven by its extensive distribution network and established relationships with major players. The online retail segment shows impressive growth due to e-commerce expansion. Within confectionery variants, milk chocolate maintains a leading market share, while dark chocolate demonstrates increasing growth driven by health trends.
Key Drivers of USA Organic Chocolate Industry Growth
Several factors propel the growth of the USA organic chocolate industry. The growing awareness of the health benefits of consuming organic products significantly increases consumer demand. The rising disposable incomes enable consumers to afford premium-priced organic chocolate. Stringent government regulations promoting organic farming practices and sustainable production methods indirectly boost market growth. Furthermore, increasing consumer concern about the environmental and social impact of conventional chocolate production encourages the preference for ethically sourced, sustainable organic chocolate.
Challenges in the USA Organic Chocolate Industry Sector
The USA organic chocolate industry faces challenges including increased production costs compared to conventional chocolate, which affects pricing and market competitiveness. Fluctuations in raw material prices (cocoa beans, sugar, etc.) create uncertainty in production planning and profitability. Intense competition from both established players and emerging smaller organic chocolate brands requires constant innovation and strategic positioning to maintain market share. Maintaining a stable and reliable supply chain for organic cocoa beans, while adhering to stringent organic certification standards, remains a significant logistical challenge.
Emerging Opportunities in USA Organic Chocolate Industry
The USA organic chocolate market presents significant opportunities. Expansion into new product categories like organic chocolate-infused beverages or functional foods presents considerable market potential. Focus on specialized dietary needs like vegan, gluten-free, and allergen-free organic chocolate caters to growing consumer segments. Leveraging digital marketing strategies to reach health-conscious consumers and promoting direct-to-consumer online sales channels can enhance market reach and visibility. The adoption of innovative packaging solutions that emphasize sustainability and reduce environmental impact creates a strong market advantage.
Leading Players in the USA Organic Chocolate Industry Market
- Guittard Chocolate Company
- Whitmore Family Enterprises LLC
- Chocoladefabriken Lindt & Sprüngli AG
- Albanese Confectionery Group Inc
- Ezaki Glico Co Ltd
- Vosges Haut-Chocolat LLC
- Salmon River Foods Inc
- Ferrero International SA
- TCHO Ventures Inc
- Mars Incorporated
- Yıldız Holding A.Ş.
- Barry Callebaut AG
- Mast Brothers & Co
- Mondelēz International Inc
- The Hershey Company
Key Developments in USA Organic Chocolate Industry Industry
- September 2022: Mondelēz International Inc. expanded its Green & Black premium organic chocolate brand with the launch of a new range, Smooth, in North America. This move strengthens their position in the growing premium organic segment.
- October 2022: Lindt & Sprungli USA launched its first-ever 3D virtual store. This innovative approach enhances the brand experience and expands reach to a wider online audience.
- November 2022: Yıldız Holding AS' brand GODIVA launched "Holiday Collection Packs" of premium chocolates. This seasonal product launch aims to tap into the holiday gifting market.
Strategic Outlook for USA Organic Chocolate Industry Market
The USA organic chocolate market is poised for continued growth, driven by increasing health consciousness, a preference for ethical sourcing, and ongoing innovation in product offerings. Future opportunities lie in expanding into niche segments, exploring new flavor profiles and formats, and leveraging technological advancements to enhance sustainability and efficiency throughout the supply chain. Companies that prioritize product quality, ethical sourcing, and consumer engagement are best positioned to succeed in this dynamic market.
USA Organic Chocolate Industry Segmentation
-
1. Confectionery Variant
- 1.1. Dark Chocolate
- 1.2. Milk and White Chocolate
-
2. Distribution Channel
- 2.1. Convenience Store
- 2.2. Online Retail Store
- 2.3. Supermarket/Hypermarket
- 2.4. Others
USA Organic Chocolate Industry Segmentation By Geography
-
1. North America
- 1.1. United States
- 1.2. Canada
- 1.3. Mexico
-
2. South America
- 2.1. Brazil
- 2.2. Argentina
- 2.3. Rest of South America
-
3. Europe
- 3.1. United Kingdom
- 3.2. Germany
- 3.3. France
- 3.4. Italy
- 3.5. Spain
- 3.6. Russia
- 3.7. Benelux
- 3.8. Nordics
- 3.9. Rest of Europe
-
4. Middle East & Africa
- 4.1. Turkey
- 4.2. Israel
- 4.3. GCC
- 4.4. North Africa
- 4.5. South Africa
- 4.6. Rest of Middle East & Africa
-
5. Asia Pacific
- 5.1. China
- 5.2. India
- 5.3. Japan
- 5.4. South Korea
- 5.5. ASEAN
- 5.6. Oceania
- 5.7. Rest of Asia Pacific
USA Organic Chocolate Industry REPORT HIGHLIGHTS
| Aspects | Details |
|---|---|
| Study Period | 2019-2033 |
| Base Year | 2024 |
| Estimated Year | 2025 |
| Forecast Period | 2025-2033 |
| Historical Period | 2019-2024 |
| Growth Rate | CAGR of 4.20% from 2019-2033 |
| Segmentation |
|
Table of Contents
- 1. Introduction
- 1.1. Research Scope
- 1.2. Market Segmentation
- 1.3. Research Methodology
- 1.4. Definitions and Assumptions
- 2. Executive Summary
- 2.1. Introduction
- 3. Market Dynamics
- 3.1. Introduction
- 3.2. Market Drivers
- 3.2.1. Escalating Demand for Processed Poultry Products; Favorable Government Initiatives to Boost Production
- 3.3. Market Restrains
- 3.3.1. Rising Vegan Trend among Young Consumers; Deeper Penetration of Red Meat Across Saudi Arabia
- 3.4. Market Trends
- 3.4.1. OTHER KEY INDUSTRY TRENDS COVERED IN THE REPORT
- 4. Market Factor Analysis
- 4.1. Porters Five Forces
- 4.2. Supply/Value Chain
- 4.3. PESTEL analysis
- 4.4. Market Entropy
- 4.5. Patent/Trademark Analysis
- 5. Global USA Organic Chocolate Industry Analysis, Insights and Forecast, 2019-2031
- 5.1. Market Analysis, Insights and Forecast - by Confectionery Variant
- 5.1.1. Dark Chocolate
- 5.1.2. Milk and White Chocolate
- 5.2. Market Analysis, Insights and Forecast - by Distribution Channel
- 5.2.1. Convenience Store
- 5.2.2. Online Retail Store
- 5.2.3. Supermarket/Hypermarket
- 5.2.4. Others
- 5.3. Market Analysis, Insights and Forecast - by Region
- 5.3.1. North America
- 5.3.2. South America
- 5.3.3. Europe
- 5.3.4. Middle East & Africa
- 5.3.5. Asia Pacific
- 5.1. Market Analysis, Insights and Forecast - by Confectionery Variant
- 6. North America USA Organic Chocolate Industry Analysis, Insights and Forecast, 2019-2031
- 6.1. Market Analysis, Insights and Forecast - by Confectionery Variant
- 6.1.1. Dark Chocolate
- 6.1.2. Milk and White Chocolate
- 6.2. Market Analysis, Insights and Forecast - by Distribution Channel
- 6.2.1. Convenience Store
- 6.2.2. Online Retail Store
- 6.2.3. Supermarket/Hypermarket
- 6.2.4. Others
- 6.1. Market Analysis, Insights and Forecast - by Confectionery Variant
- 7. South America USA Organic Chocolate Industry Analysis, Insights and Forecast, 2019-2031
- 7.1. Market Analysis, Insights and Forecast - by Confectionery Variant
- 7.1.1. Dark Chocolate
- 7.1.2. Milk and White Chocolate
- 7.2. Market Analysis, Insights and Forecast - by Distribution Channel
- 7.2.1. Convenience Store
- 7.2.2. Online Retail Store
- 7.2.3. Supermarket/Hypermarket
- 7.2.4. Others
- 7.1. Market Analysis, Insights and Forecast - by Confectionery Variant
- 8. Europe USA Organic Chocolate Industry Analysis, Insights and Forecast, 2019-2031
- 8.1. Market Analysis, Insights and Forecast - by Confectionery Variant
- 8.1.1. Dark Chocolate
- 8.1.2. Milk and White Chocolate
- 8.2. Market Analysis, Insights and Forecast - by Distribution Channel
- 8.2.1. Convenience Store
- 8.2.2. Online Retail Store
- 8.2.3. Supermarket/Hypermarket
- 8.2.4. Others
- 8.1. Market Analysis, Insights and Forecast - by Confectionery Variant
- 9. Middle East & Africa USA Organic Chocolate Industry Analysis, Insights and Forecast, 2019-2031
- 9.1. Market Analysis, Insights and Forecast - by Confectionery Variant
- 9.1.1. Dark Chocolate
- 9.1.2. Milk and White Chocolate
- 9.2. Market Analysis, Insights and Forecast - by Distribution Channel
- 9.2.1. Convenience Store
- 9.2.2. Online Retail Store
- 9.2.3. Supermarket/Hypermarket
- 9.2.4. Others
- 9.1. Market Analysis, Insights and Forecast - by Confectionery Variant
- 10. Asia Pacific USA Organic Chocolate Industry Analysis, Insights and Forecast, 2019-2031
- 10.1. Market Analysis, Insights and Forecast - by Confectionery Variant
- 10.1.1. Dark Chocolate
- 10.1.2. Milk and White Chocolate
- 10.2. Market Analysis, Insights and Forecast - by Distribution Channel
- 10.2.1. Convenience Store
- 10.2.2. Online Retail Store
- 10.2.3. Supermarket/Hypermarket
- 10.2.4. Others
- 10.1. Market Analysis, Insights and Forecast - by Confectionery Variant
- 11. Northeast USA Organic Chocolate Industry Analysis, Insights and Forecast, 2019-2031
- 12. Southeast USA Organic Chocolate Industry Analysis, Insights and Forecast, 2019-2031
- 13. Midwest USA Organic Chocolate Industry Analysis, Insights and Forecast, 2019-2031
- 14. Southwest USA Organic Chocolate Industry Analysis, Insights and Forecast, 2019-2031
- 15. West USA Organic Chocolate Industry Analysis, Insights and Forecast, 2019-2031
- 16. Competitive Analysis
- 16.1. Global Market Share Analysis 2024
- 16.2. Company Profiles
- 16.2.1 Guittard Chocolate Company
- 16.2.1.1. Overview
- 16.2.1.2. Products
- 16.2.1.3. SWOT Analysis
- 16.2.1.4. Recent Developments
- 16.2.1.5. Financials (Based on Availability)
- 16.2.2 Whitmore Family Enterprises LLC
- 16.2.2.1. Overview
- 16.2.2.2. Products
- 16.2.2.3. SWOT Analysis
- 16.2.2.4. Recent Developments
- 16.2.2.5. Financials (Based on Availability)
- 16.2.3 Chocoladefabriken Lindt & Sprüngli AG
- 16.2.3.1. Overview
- 16.2.3.2. Products
- 16.2.3.3. SWOT Analysis
- 16.2.3.4. Recent Developments
- 16.2.3.5. Financials (Based on Availability)
- 16.2.4 Albanese Confectionery Group Inc
- 16.2.4.1. Overview
- 16.2.4.2. Products
- 16.2.4.3. SWOT Analysis
- 16.2.4.4. Recent Developments
- 16.2.4.5. Financials (Based on Availability)
- 16.2.5 Ezaki Glico Co Ltd
- 16.2.5.1. Overview
- 16.2.5.2. Products
- 16.2.5.3. SWOT Analysis
- 16.2.5.4. Recent Developments
- 16.2.5.5. Financials (Based on Availability)
- 16.2.6 Vosges Haut-Chocolat LLC
- 16.2.6.1. Overview
- 16.2.6.2. Products
- 16.2.6.3. SWOT Analysis
- 16.2.6.4. Recent Developments
- 16.2.6.5. Financials (Based on Availability)
- 16.2.7 Salmon River Foods Inc
- 16.2.7.1. Overview
- 16.2.7.2. Products
- 16.2.7.3. SWOT Analysis
- 16.2.7.4. Recent Developments
- 16.2.7.5. Financials (Based on Availability)
- 16.2.8 Ferrero International SA
- 16.2.8.1. Overview
- 16.2.8.2. Products
- 16.2.8.3. SWOT Analysis
- 16.2.8.4. Recent Developments
- 16.2.8.5. Financials (Based on Availability)
- 16.2.9 TCHO Ventures Inc
- 16.2.9.1. Overview
- 16.2.9.2. Products
- 16.2.9.3. SWOT Analysis
- 16.2.9.4. Recent Developments
- 16.2.9.5. Financials (Based on Availability)
- 16.2.10 Mars Incorporated
- 16.2.10.1. Overview
- 16.2.10.2. Products
- 16.2.10.3. SWOT Analysis
- 16.2.10.4. Recent Developments
- 16.2.10.5. Financials (Based on Availability)
- 16.2.11 Yıldız Holding A
- 16.2.11.1. Overview
- 16.2.11.2. Products
- 16.2.11.3. SWOT Analysis
- 16.2.11.4. Recent Developments
- 16.2.11.5. Financials (Based on Availability)
- 16.2.12 Barry Callebaut AG
- 16.2.12.1. Overview
- 16.2.12.2. Products
- 16.2.12.3. SWOT Analysis
- 16.2.12.4. Recent Developments
- 16.2.12.5. Financials (Based on Availability)
- 16.2.13 Mast Brothers & Co
- 16.2.13.1. Overview
- 16.2.13.2. Products
- 16.2.13.3. SWOT Analysis
- 16.2.13.4. Recent Developments
- 16.2.13.5. Financials (Based on Availability)
- 16.2.14 Mondelēz International Inc
- 16.2.14.1. Overview
- 16.2.14.2. Products
- 16.2.14.3. SWOT Analysis
- 16.2.14.4. Recent Developments
- 16.2.14.5. Financials (Based on Availability)
- 16.2.15 The Hershey Company
- 16.2.15.1. Overview
- 16.2.15.2. Products
- 16.2.15.3. SWOT Analysis
- 16.2.15.4. Recent Developments
- 16.2.15.5. Financials (Based on Availability)
- 16.2.1 Guittard Chocolate Company
List of Figures
- Figure 1: Global USA Organic Chocolate Industry Revenue Breakdown (Million, %) by Region 2024 & 2032
- Figure 2: Global USA Organic Chocolate Industry Volume Breakdown (Tons, %) by Region 2024 & 2032
- Figure 3: United states USA Organic Chocolate Industry Revenue (Million), by Country 2024 & 2032
- Figure 4: United states USA Organic Chocolate Industry Volume (Tons), by Country 2024 & 2032
- Figure 5: United states USA Organic Chocolate Industry Revenue Share (%), by Country 2024 & 2032
- Figure 6: United states USA Organic Chocolate Industry Volume Share (%), by Country 2024 & 2032
- Figure 7: North America USA Organic Chocolate Industry Revenue (Million), by Confectionery Variant 2024 & 2032
- Figure 8: North America USA Organic Chocolate Industry Volume (Tons), by Confectionery Variant 2024 & 2032
- Figure 9: North America USA Organic Chocolate Industry Revenue Share (%), by Confectionery Variant 2024 & 2032
- Figure 10: North America USA Organic Chocolate Industry Volume Share (%), by Confectionery Variant 2024 & 2032
- Figure 11: North America USA Organic Chocolate Industry Revenue (Million), by Distribution Channel 2024 & 2032
- Figure 12: North America USA Organic Chocolate Industry Volume (Tons), by Distribution Channel 2024 & 2032
- Figure 13: North America USA Organic Chocolate Industry Revenue Share (%), by Distribution Channel 2024 & 2032
- Figure 14: North America USA Organic Chocolate Industry Volume Share (%), by Distribution Channel 2024 & 2032
- Figure 15: North America USA Organic Chocolate Industry Revenue (Million), by Country 2024 & 2032
- Figure 16: North America USA Organic Chocolate Industry Volume (Tons), by Country 2024 & 2032
- Figure 17: North America USA Organic Chocolate Industry Revenue Share (%), by Country 2024 & 2032
- Figure 18: North America USA Organic Chocolate Industry Volume Share (%), by Country 2024 & 2032
- Figure 19: South America USA Organic Chocolate Industry Revenue (Million), by Confectionery Variant 2024 & 2032
- Figure 20: South America USA Organic Chocolate Industry Volume (Tons), by Confectionery Variant 2024 & 2032
- Figure 21: South America USA Organic Chocolate Industry Revenue Share (%), by Confectionery Variant 2024 & 2032
- Figure 22: South America USA Organic Chocolate Industry Volume Share (%), by Confectionery Variant 2024 & 2032
- Figure 23: South America USA Organic Chocolate Industry Revenue (Million), by Distribution Channel 2024 & 2032
- Figure 24: South America USA Organic Chocolate Industry Volume (Tons), by Distribution Channel 2024 & 2032
- Figure 25: South America USA Organic Chocolate Industry Revenue Share (%), by Distribution Channel 2024 & 2032
- Figure 26: South America USA Organic Chocolate Industry Volume Share (%), by Distribution Channel 2024 & 2032
- Figure 27: South America USA Organic Chocolate Industry Revenue (Million), by Country 2024 & 2032
- Figure 28: South America USA Organic Chocolate Industry Volume (Tons), by Country 2024 & 2032
- Figure 29: South America USA Organic Chocolate Industry Revenue Share (%), by Country 2024 & 2032
- Figure 30: South America USA Organic Chocolate Industry Volume Share (%), by Country 2024 & 2032
- Figure 31: Europe USA Organic Chocolate Industry Revenue (Million), by Confectionery Variant 2024 & 2032
- Figure 32: Europe USA Organic Chocolate Industry Volume (Tons), by Confectionery Variant 2024 & 2032
- Figure 33: Europe USA Organic Chocolate Industry Revenue Share (%), by Confectionery Variant 2024 & 2032
- Figure 34: Europe USA Organic Chocolate Industry Volume Share (%), by Confectionery Variant 2024 & 2032
- Figure 35: Europe USA Organic Chocolate Industry Revenue (Million), by Distribution Channel 2024 & 2032
- Figure 36: Europe USA Organic Chocolate Industry Volume (Tons), by Distribution Channel 2024 & 2032
- Figure 37: Europe USA Organic Chocolate Industry Revenue Share (%), by Distribution Channel 2024 & 2032
- Figure 38: Europe USA Organic Chocolate Industry Volume Share (%), by Distribution Channel 2024 & 2032
- Figure 39: Europe USA Organic Chocolate Industry Revenue (Million), by Country 2024 & 2032
- Figure 40: Europe USA Organic Chocolate Industry Volume (Tons), by Country 2024 & 2032
- Figure 41: Europe USA Organic Chocolate Industry Revenue Share (%), by Country 2024 & 2032
- Figure 42: Europe USA Organic Chocolate Industry Volume Share (%), by Country 2024 & 2032
- Figure 43: Middle East & Africa USA Organic Chocolate Industry Revenue (Million), by Confectionery Variant 2024 & 2032
- Figure 44: Middle East & Africa USA Organic Chocolate Industry Volume (Tons), by Confectionery Variant 2024 & 2032
- Figure 45: Middle East & Africa USA Organic Chocolate Industry Revenue Share (%), by Confectionery Variant 2024 & 2032
- Figure 46: Middle East & Africa USA Organic Chocolate Industry Volume Share (%), by Confectionery Variant 2024 & 2032
- Figure 47: Middle East & Africa USA Organic Chocolate Industry Revenue (Million), by Distribution Channel 2024 & 2032
- Figure 48: Middle East & Africa USA Organic Chocolate Industry Volume (Tons), by Distribution Channel 2024 & 2032
- Figure 49: Middle East & Africa USA Organic Chocolate Industry Revenue Share (%), by Distribution Channel 2024 & 2032
- Figure 50: Middle East & Africa USA Organic Chocolate Industry Volume Share (%), by Distribution Channel 2024 & 2032
- Figure 51: Middle East & Africa USA Organic Chocolate Industry Revenue (Million), by Country 2024 & 2032
- Figure 52: Middle East & Africa USA Organic Chocolate Industry Volume (Tons), by Country 2024 & 2032
- Figure 53: Middle East & Africa USA Organic Chocolate Industry Revenue Share (%), by Country 2024 & 2032
- Figure 54: Middle East & Africa USA Organic Chocolate Industry Volume Share (%), by Country 2024 & 2032
- Figure 55: Asia Pacific USA Organic Chocolate Industry Revenue (Million), by Confectionery Variant 2024 & 2032
- Figure 56: Asia Pacific USA Organic Chocolate Industry Volume (Tons), by Confectionery Variant 2024 & 2032
- Figure 57: Asia Pacific USA Organic Chocolate Industry Revenue Share (%), by Confectionery Variant 2024 & 2032
- Figure 58: Asia Pacific USA Organic Chocolate Industry Volume Share (%), by Confectionery Variant 2024 & 2032
- Figure 59: Asia Pacific USA Organic Chocolate Industry Revenue (Million), by Distribution Channel 2024 & 2032
- Figure 60: Asia Pacific USA Organic Chocolate Industry Volume (Tons), by Distribution Channel 2024 & 2032
- Figure 61: Asia Pacific USA Organic Chocolate Industry Revenue Share (%), by Distribution Channel 2024 & 2032
- Figure 62: Asia Pacific USA Organic Chocolate Industry Volume Share (%), by Distribution Channel 2024 & 2032
- Figure 63: Asia Pacific USA Organic Chocolate Industry Revenue (Million), by Country 2024 & 2032
- Figure 64: Asia Pacific USA Organic Chocolate Industry Volume (Tons), by Country 2024 & 2032
- Figure 65: Asia Pacific USA Organic Chocolate Industry Revenue Share (%), by Country 2024 & 2032
- Figure 66: Asia Pacific USA Organic Chocolate Industry Volume Share (%), by Country 2024 & 2032
List of Tables
- Table 1: Global USA Organic Chocolate Industry Revenue Million Forecast, by Region 2019 & 2032
- Table 2: Global USA Organic Chocolate Industry Volume Tons Forecast, by Region 2019 & 2032
- Table 3: Global USA Organic Chocolate Industry Revenue Million Forecast, by Confectionery Variant 2019 & 2032
- Table 4: Global USA Organic Chocolate Industry Volume Tons Forecast, by Confectionery Variant 2019 & 2032
- Table 5: Global USA Organic Chocolate Industry Revenue Million Forecast, by Distribution Channel 2019 & 2032
- Table 6: Global USA Organic Chocolate Industry Volume Tons Forecast, by Distribution Channel 2019 & 2032
- Table 7: Global USA Organic Chocolate Industry Revenue Million Forecast, by Region 2019 & 2032
- Table 8: Global USA Organic Chocolate Industry Volume Tons Forecast, by Region 2019 & 2032
- Table 9: Global USA Organic Chocolate Industry Revenue Million Forecast, by Country 2019 & 2032
- Table 10: Global USA Organic Chocolate Industry Volume Tons Forecast, by Country 2019 & 2032
- Table 11: Northeast USA Organic Chocolate Industry Revenue (Million) Forecast, by Application 2019 & 2032
- Table 12: Northeast USA Organic Chocolate Industry Volume (Tons) Forecast, by Application 2019 & 2032
- Table 13: Southeast USA Organic Chocolate Industry Revenue (Million) Forecast, by Application 2019 & 2032
- Table 14: Southeast USA Organic Chocolate Industry Volume (Tons) Forecast, by Application 2019 & 2032
- Table 15: Midwest USA Organic Chocolate Industry Revenue (Million) Forecast, by Application 2019 & 2032
- Table 16: Midwest USA Organic Chocolate Industry Volume (Tons) Forecast, by Application 2019 & 2032
- Table 17: Southwest USA Organic Chocolate Industry Revenue (Million) Forecast, by Application 2019 & 2032
- Table 18: Southwest USA Organic Chocolate Industry Volume (Tons) Forecast, by Application 2019 & 2032
- Table 19: West USA Organic Chocolate Industry Revenue (Million) Forecast, by Application 2019 & 2032
- Table 20: West USA Organic Chocolate Industry Volume (Tons) Forecast, by Application 2019 & 2032
- Table 21: Global USA Organic Chocolate Industry Revenue Million Forecast, by Confectionery Variant 2019 & 2032
- Table 22: Global USA Organic Chocolate Industry Volume Tons Forecast, by Confectionery Variant 2019 & 2032
- Table 23: Global USA Organic Chocolate Industry Revenue Million Forecast, by Distribution Channel 2019 & 2032
- Table 24: Global USA Organic Chocolate Industry Volume Tons Forecast, by Distribution Channel 2019 & 2032
- Table 25: Global USA Organic Chocolate Industry Revenue Million Forecast, by Country 2019 & 2032
- Table 26: Global USA Organic Chocolate Industry Volume Tons Forecast, by Country 2019 & 2032
- Table 27: United States USA Organic Chocolate Industry Revenue (Million) Forecast, by Application 2019 & 2032
- Table 28: United States USA Organic Chocolate Industry Volume (Tons) Forecast, by Application 2019 & 2032
- Table 29: Canada USA Organic Chocolate Industry Revenue (Million) Forecast, by Application 2019 & 2032
- Table 30: Canada USA Organic Chocolate Industry Volume (Tons) Forecast, by Application 2019 & 2032
- Table 31: Mexico USA Organic Chocolate Industry Revenue (Million) Forecast, by Application 2019 & 2032
- Table 32: Mexico USA Organic Chocolate Industry Volume (Tons) Forecast, by Application 2019 & 2032
- Table 33: Global USA Organic Chocolate Industry Revenue Million Forecast, by Confectionery Variant 2019 & 2032
- Table 34: Global USA Organic Chocolate Industry Volume Tons Forecast, by Confectionery Variant 2019 & 2032
- Table 35: Global USA Organic Chocolate Industry Revenue Million Forecast, by Distribution Channel 2019 & 2032
- Table 36: Global USA Organic Chocolate Industry Volume Tons Forecast, by Distribution Channel 2019 & 2032
- Table 37: Global USA Organic Chocolate Industry Revenue Million Forecast, by Country 2019 & 2032
- Table 38: Global USA Organic Chocolate Industry Volume Tons Forecast, by Country 2019 & 2032
- Table 39: Brazil USA Organic Chocolate Industry Revenue (Million) Forecast, by Application 2019 & 2032
- Table 40: Brazil USA Organic Chocolate Industry Volume (Tons) Forecast, by Application 2019 & 2032
- Table 41: Argentina USA Organic Chocolate Industry Revenue (Million) Forecast, by Application 2019 & 2032
- Table 42: Argentina USA Organic Chocolate Industry Volume (Tons) Forecast, by Application 2019 & 2032
- Table 43: Rest of South America USA Organic Chocolate Industry Revenue (Million) Forecast, by Application 2019 & 2032
- Table 44: Rest of South America USA Organic Chocolate Industry Volume (Tons) Forecast, by Application 2019 & 2032
- Table 45: Global USA Organic Chocolate Industry Revenue Million Forecast, by Confectionery Variant 2019 & 2032
- Table 46: Global USA Organic Chocolate Industry Volume Tons Forecast, by Confectionery Variant 2019 & 2032
- Table 47: Global USA Organic Chocolate Industry Revenue Million Forecast, by Distribution Channel 2019 & 2032
- Table 48: Global USA Organic Chocolate Industry Volume Tons Forecast, by Distribution Channel 2019 & 2032
- Table 49: Global USA Organic Chocolate Industry Revenue Million Forecast, by Country 2019 & 2032
- Table 50: Global USA Organic Chocolate Industry Volume Tons Forecast, by Country 2019 & 2032
- Table 51: United Kingdom USA Organic Chocolate Industry Revenue (Million) Forecast, by Application 2019 & 2032
- Table 52: United Kingdom USA Organic Chocolate Industry Volume (Tons) Forecast, by Application 2019 & 2032
- Table 53: Germany USA Organic Chocolate Industry Revenue (Million) Forecast, by Application 2019 & 2032
- Table 54: Germany USA Organic Chocolate Industry Volume (Tons) Forecast, by Application 2019 & 2032
- Table 55: France USA Organic Chocolate Industry Revenue (Million) Forecast, by Application 2019 & 2032
- Table 56: France USA Organic Chocolate Industry Volume (Tons) Forecast, by Application 2019 & 2032
- Table 57: Italy USA Organic Chocolate Industry Revenue (Million) Forecast, by Application 2019 & 2032
- Table 58: Italy USA Organic Chocolate Industry Volume (Tons) Forecast, by Application 2019 & 2032
- Table 59: Spain USA Organic Chocolate Industry Revenue (Million) Forecast, by Application 2019 & 2032
- Table 60: Spain USA Organic Chocolate Industry Volume (Tons) Forecast, by Application 2019 & 2032
- Table 61: Russia USA Organic Chocolate Industry Revenue (Million) Forecast, by Application 2019 & 2032
- Table 62: Russia USA Organic Chocolate Industry Volume (Tons) Forecast, by Application 2019 & 2032
- Table 63: Benelux USA Organic Chocolate Industry Revenue (Million) Forecast, by Application 2019 & 2032
- Table 64: Benelux USA Organic Chocolate Industry Volume (Tons) Forecast, by Application 2019 & 2032
- Table 65: Nordics USA Organic Chocolate Industry Revenue (Million) Forecast, by Application 2019 & 2032
- Table 66: Nordics USA Organic Chocolate Industry Volume (Tons) Forecast, by Application 2019 & 2032
- Table 67: Rest of Europe USA Organic Chocolate Industry Revenue (Million) Forecast, by Application 2019 & 2032
- Table 68: Rest of Europe USA Organic Chocolate Industry Volume (Tons) Forecast, by Application 2019 & 2032
- Table 69: Global USA Organic Chocolate Industry Revenue Million Forecast, by Confectionery Variant 2019 & 2032
- Table 70: Global USA Organic Chocolate Industry Volume Tons Forecast, by Confectionery Variant 2019 & 2032
- Table 71: Global USA Organic Chocolate Industry Revenue Million Forecast, by Distribution Channel 2019 & 2032
- Table 72: Global USA Organic Chocolate Industry Volume Tons Forecast, by Distribution Channel 2019 & 2032
- Table 73: Global USA Organic Chocolate Industry Revenue Million Forecast, by Country 2019 & 2032
- Table 74: Global USA Organic Chocolate Industry Volume Tons Forecast, by Country 2019 & 2032
- Table 75: Turkey USA Organic Chocolate Industry Revenue (Million) Forecast, by Application 2019 & 2032
- Table 76: Turkey USA Organic Chocolate Industry Volume (Tons) Forecast, by Application 2019 & 2032
- Table 77: Israel USA Organic Chocolate Industry Revenue (Million) Forecast, by Application 2019 & 2032
- Table 78: Israel USA Organic Chocolate Industry Volume (Tons) Forecast, by Application 2019 & 2032
- Table 79: GCC USA Organic Chocolate Industry Revenue (Million) Forecast, by Application 2019 & 2032
- Table 80: GCC USA Organic Chocolate Industry Volume (Tons) Forecast, by Application 2019 & 2032
- Table 81: North Africa USA Organic Chocolate Industry Revenue (Million) Forecast, by Application 2019 & 2032
- Table 82: North Africa USA Organic Chocolate Industry Volume (Tons) Forecast, by Application 2019 & 2032
- Table 83: South Africa USA Organic Chocolate Industry Revenue (Million) Forecast, by Application 2019 & 2032
- Table 84: South Africa USA Organic Chocolate Industry Volume (Tons) Forecast, by Application 2019 & 2032
- Table 85: Rest of Middle East & Africa USA Organic Chocolate Industry Revenue (Million) Forecast, by Application 2019 & 2032
- Table 86: Rest of Middle East & Africa USA Organic Chocolate Industry Volume (Tons) Forecast, by Application 2019 & 2032
- Table 87: Global USA Organic Chocolate Industry Revenue Million Forecast, by Confectionery Variant 2019 & 2032
- Table 88: Global USA Organic Chocolate Industry Volume Tons Forecast, by Confectionery Variant 2019 & 2032
- Table 89: Global USA Organic Chocolate Industry Revenue Million Forecast, by Distribution Channel 2019 & 2032
- Table 90: Global USA Organic Chocolate Industry Volume Tons Forecast, by Distribution Channel 2019 & 2032
- Table 91: Global USA Organic Chocolate Industry Revenue Million Forecast, by Country 2019 & 2032
- Table 92: Global USA Organic Chocolate Industry Volume Tons Forecast, by Country 2019 & 2032
- Table 93: China USA Organic Chocolate Industry Revenue (Million) Forecast, by Application 2019 & 2032
- Table 94: China USA Organic Chocolate Industry Volume (Tons) Forecast, by Application 2019 & 2032
- Table 95: India USA Organic Chocolate Industry Revenue (Million) Forecast, by Application 2019 & 2032
- Table 96: India USA Organic Chocolate Industry Volume (Tons) Forecast, by Application 2019 & 2032
- Table 97: Japan USA Organic Chocolate Industry Revenue (Million) Forecast, by Application 2019 & 2032
- Table 98: Japan USA Organic Chocolate Industry Volume (Tons) Forecast, by Application 2019 & 2032
- Table 99: South Korea USA Organic Chocolate Industry Revenue (Million) Forecast, by Application 2019 & 2032
- Table 100: South Korea USA Organic Chocolate Industry Volume (Tons) Forecast, by Application 2019 & 2032
- Table 101: ASEAN USA Organic Chocolate Industry Revenue (Million) Forecast, by Application 2019 & 2032
- Table 102: ASEAN USA Organic Chocolate Industry Volume (Tons) Forecast, by Application 2019 & 2032
- Table 103: Oceania USA Organic Chocolate Industry Revenue (Million) Forecast, by Application 2019 & 2032
- Table 104: Oceania USA Organic Chocolate Industry Volume (Tons) Forecast, by Application 2019 & 2032
- Table 105: Rest of Asia Pacific USA Organic Chocolate Industry Revenue (Million) Forecast, by Application 2019 & 2032
- Table 106: Rest of Asia Pacific USA Organic Chocolate Industry Volume (Tons) Forecast, by Application 2019 & 2032
Frequently Asked Questions
1. What is the projected Compound Annual Growth Rate (CAGR) of the USA Organic Chocolate Industry?
The projected CAGR is approximately 4.20%.
2. Which companies are prominent players in the USA Organic Chocolate Industry?
Key companies in the market include Guittard Chocolate Company, Whitmore Family Enterprises LLC, Chocoladefabriken Lindt & Sprüngli AG, Albanese Confectionery Group Inc, Ezaki Glico Co Ltd, Vosges Haut-Chocolat LLC, Salmon River Foods Inc, Ferrero International SA, TCHO Ventures Inc, Mars Incorporated, Yıldız Holding A, Barry Callebaut AG, Mast Brothers & Co, Mondelēz International Inc, The Hershey Company.
3. What are the main segments of the USA Organic Chocolate Industry?
The market segments include Confectionery Variant, Distribution Channel.
4. Can you provide details about the market size?
The market size is estimated to be USD 730.11 Million as of 2022.
5. What are some drivers contributing to market growth?
Escalating Demand for Processed Poultry Products; Favorable Government Initiatives to Boost Production.
6. What are the notable trends driving market growth?
OTHER KEY INDUSTRY TRENDS COVERED IN THE REPORT.
7. Are there any restraints impacting market growth?
Rising Vegan Trend among Young Consumers; Deeper Penetration of Red Meat Across Saudi Arabia.
8. Can you provide examples of recent developments in the market?
November 2022: Yıldız Holding AS' brand GODIVA launched "Holiday Collection Packs" of premium chocolates. The chocolate packs include Milk Chocolate Praline Heart, Midnight Swirl, and White Chocolate Raspberry Star.October 2022: Lindt & Sprungli USA launched its first-ever 3D virtual store. Lindt's new online storefront allows consumers across the country to engage in the enchanting brand experience of a Lindt Chocolate store from the comfort of their homes or even on the go.September 2022: Mondelēz International Inc. expanded its Green & Black premium organic chocolate brand with the launch of a new range, Smooth, in North America.
9. What pricing options are available for accessing the report?
Pricing options include single-user, multi-user, and enterprise licenses priced at USD 3800, USD 4500, and USD 5800 respectively.
10. Is the market size provided in terms of value or volume?
The market size is provided in terms of value, measured in Million and volume, measured in Tons.
11. Are there any specific market keywords associated with the report?
Yes, the market keyword associated with the report is "USA Organic Chocolate Industry," which aids in identifying and referencing the specific market segment covered.
12. How do I determine which pricing option suits my needs best?
The pricing options vary based on user requirements and access needs. Individual users may opt for single-user licenses, while businesses requiring broader access may choose multi-user or enterprise licenses for cost-effective access to the report.
13. Are there any additional resources or data provided in the USA Organic Chocolate Industry report?
While the report offers comprehensive insights, it's advisable to review the specific contents or supplementary materials provided to ascertain if additional resources or data are available.
14. How can I stay updated on further developments or reports in the USA Organic Chocolate Industry?
To stay informed about further developments, trends, and reports in the USA Organic Chocolate Industry, consider subscribing to industry newsletters, following relevant companies and organizations, or regularly checking reputable industry news sources and publications.
Methodology
Step 1 - Identification of Relevant Samples Size from Population Database


Step 2 - Approaches for Defining Global Market Size (Value, Volume* & Price*)

Note*: In applicable scenarios
Step 3 - Data Sources
Primary Research
- Web Analytics
- Survey Reports
- Research Institute
- Latest Research Reports
- Opinion Leaders
Secondary Research
- Annual Reports
- White Paper
- Latest Press Release
- Industry Association
- Paid Database
- Investor Presentations

Step 4 - Data Triangulation
Involves using different sources of information in order to increase the validity of a study
These sources are likely to be stakeholders in a program - participants, other researchers, program staff, other community members, and so on.
Then we put all data in single framework & apply various statistical tools to find out the dynamic on the market.
During the analysis stage, feedback from the stakeholder groups would be compared to determine areas of agreement as well as areas of divergence


