
Key Insights
The UXO (Unexploded Ordnance) detection market is experiencing robust growth, driven by increasing global military expenditure, a rising focus on land remediation for infrastructure development, and heightened awareness of environmental risks associated with unexploded munitions. The market's Compound Annual Growth Rate (CAGR) exceeding 2.50% indicates a consistently expanding demand for sophisticated detection technologies. This growth is fueled by advancements in sensor technology, including the development of more sensitive and accurate ground-penetrating radar (GPR), magnetometers, and metal detectors. Furthermore, the integration of artificial intelligence (AI) and machine learning (ML) is enhancing the speed and accuracy of UXO detection, leading to improved efficiency and reduced costs for remediation efforts. Hardware-based solutions currently dominate the market, but software solutions incorporating advanced data analysis and visualization are gaining traction, improving the interpretation of detection data and informing efficient remediation strategies. Key players in the market are continually innovating to address the challenges of diverse soil conditions, environmental factors, and the complex nature of UXO detection. The market's geographical distribution reflects the concentration of both historical ordnance and ongoing conflict zones, with North America and Europe holding significant market shares. The Asia-Pacific region is witnessing substantial growth, driven by infrastructure development initiatives and land reclamation projects.
The market segmentation reveals a strong emphasis on both hardware and software solutions. Hardware solutions comprise the larger segment due to the reliance on physical detection equipment, while software is rapidly evolving to integrate and analyze data, improving the overall efficiency and precision of the process. The competitive landscape consists of both established players and emerging technology companies, driving innovation and expanding the market’s capabilities. The continued need for effective and efficient UXO detection solutions, coupled with advancements in technology and increased government and private sector investment in land remediation, suggests a positive outlook for this market in the coming decade. Future growth will depend on factors such as technological breakthroughs, regulatory frameworks supporting land remediation, and global geopolitical stability.
UXO Detection Industry Market Report: 2019-2033
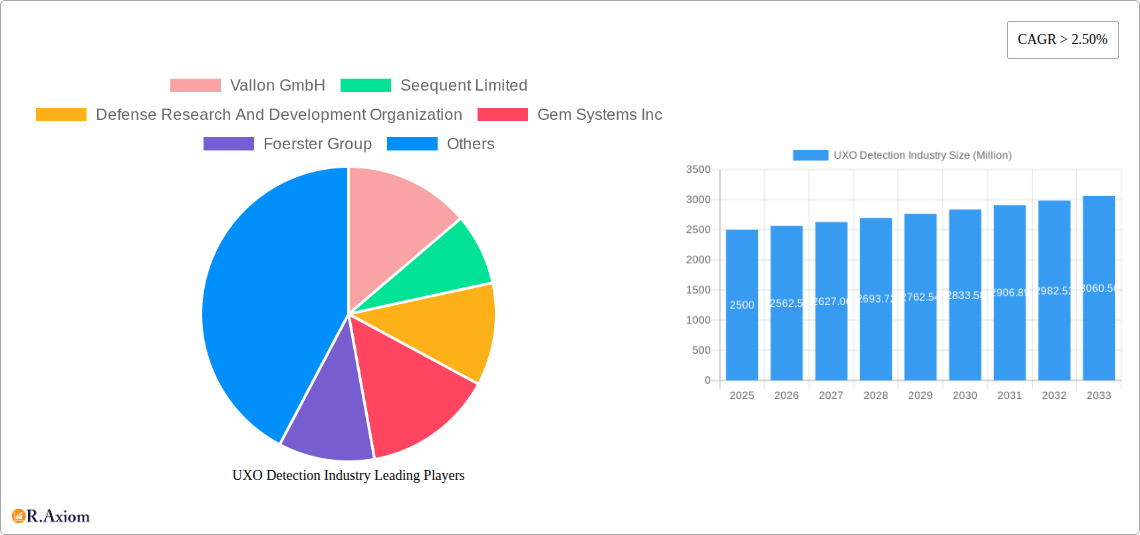
This comprehensive report provides a detailed analysis of the UXO Detection Industry, covering market size, growth drivers, challenges, opportunities, and key players. The study period spans from 2019 to 2033, with 2025 serving as both the base and estimated year. The forecast period is 2025-2033, and the historical period covers 2019-2024. The report offers actionable insights for industry stakeholders, investors, and businesses operating within this dynamic sector. The global market size is estimated at $XX Million in 2025 and is projected to reach $XX Million by 2033.
UXO Detection Industry Market Concentration & Innovation
The UXO detection market exhibits a moderately concentrated structure, with a few major players holding significant market share. While precise market share data for individual companies remains confidential, estimates suggest that Vallon GmbH, Seequent Limited, and Defense Research and Development Organization are among the leading companies, collectively accounting for an estimated XX% of the global market in 2025. Smaller companies such as Gem Systems Inc, Foerster Group, Schonstedt Instrument Company, OPEC Systems Pty Ltd, Dynasafe AB, and MRS Management Limited contribute to the remaining market share.
Innovation is a key driver, fueled by advancements in sensor technology, data analytics, and AI-powered solutions. Regulatory frameworks, particularly concerning environmental remediation and safety standards, significantly influence market growth. The industry is also witnessing increased M&A activity, with deal values exceeding $XX Million in the last five years. This consolidation is driven by the desire to expand product portfolios, enhance technological capabilities, and access new markets. Product substitutes, such as traditional manual detection methods, still exist but are facing declining market share due to the efficiency and accuracy of modern UXO detection technologies. End-user trends show a preference for integrated systems combining hardware and software, offering streamlined data processing and analysis.
- Market Concentration: Moderately concentrated, with top players holding XX% of the market.
- Innovation Drivers: Sensor technology, data analytics, AI.
- Regulatory Frameworks: Significant impact on market growth and product development.
- M&A Activity: Deal values exceeding $XX Million in the last five years.
- End-User Trends: Preference for integrated hardware and software solutions.
UXO Detection Industry Industry Trends & Insights
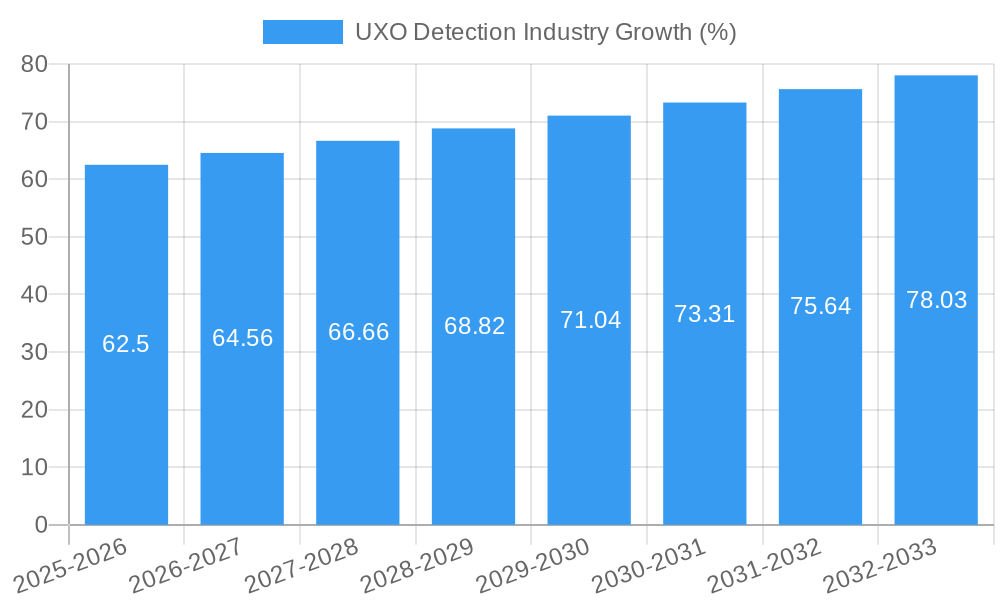
The UXO detection industry is experiencing robust growth, driven by increasing global demand for land remediation, infrastructure development, and post-conflict cleanup efforts. The market is projected to register a Compound Annual Growth Rate (CAGR) of XX% during the forecast period (2025-2033). Technological disruptions, particularly in the realm of advanced sensors and AI-driven analysis, are significantly improving detection accuracy and efficiency, leading to increased market penetration. Consumer preferences are shifting towards integrated, user-friendly systems that require minimal training and offer real-time data analysis. Competitive dynamics are shaped by ongoing technological advancements, strategic partnerships, and expansion into new geographical markets. The market penetration of advanced UXO detection technologies is currently at XX% and is anticipated to reach XX% by 2033. This growth is fueled by factors such as heightened awareness of environmental contamination, stringent government regulations, and increasing investment in infrastructure projects.
Dominant Markets & Segments in UXO Detection Industry
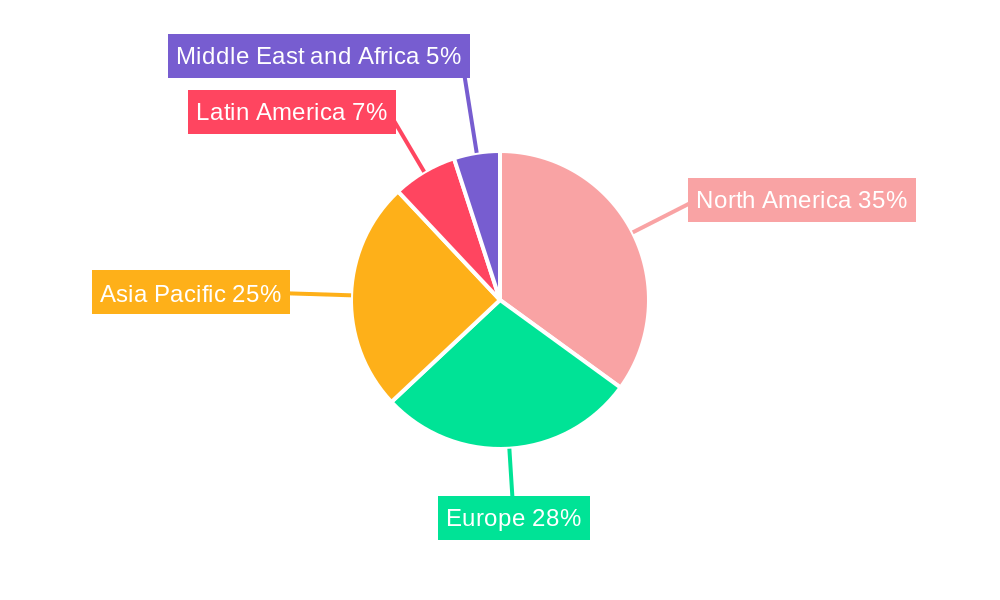
North America currently holds the largest market share in the UXO detection industry, driven by extensive land remediation needs and robust government spending on defense and environmental cleanup initiatives. Within the system type segmentation, the hardware segment holds a larger market share than the software segment, primarily due to the fundamental requirement for physical detection devices.
- Key Drivers in North America:
- Strong government regulations for environmental remediation.
- High defense spending and military activities.
- Extensive historical contamination requiring cleanup.
- Hardware Segment Dominance: Driven by the essential need for physical detection equipment. Growth is projected to be XX% during the forecast period.
- Software Segment Growth: Software solutions are experiencing growth, driven by increasing demand for data analysis and management capabilities. This segment is expected to show a CAGR of XX% during the forecast period.
UXO Detection Industry Product Developments
Recent product innovations focus on enhancing detection accuracy, reducing operational costs, and improving user-friendliness. The integration of advanced sensors, such as ground-penetrating radar (GPR) and magnetometers, with AI-powered data analysis algorithms has resulted in more efficient and precise UXO detection. These advancements address the need for faster and more reliable detection, leading to increased market adoption and competitive advantages for manufacturers offering these sophisticated solutions. Lightweight, portable systems are gaining popularity, expanding the accessibility and application of UXO detection technology.
Report Scope & Segmentation Analysis
This report segments the UXO detection market based on system type: Hardware and Software.
Hardware: This segment encompasses various detection devices, including metal detectors, ground-penetrating radar (GPR), magnetometers, and other specialized equipment. The hardware segment is expected to witness significant growth, driven by technological advancements and increasing demand for efficient and reliable detection systems. The market size for hardware is estimated to be $XX Million in 2025.
Software: This segment includes data acquisition, processing, and analysis software for UXO detection. The software segment is characterized by rapid growth, fueled by the need for efficient data management, advanced analytical capabilities, and integration with various hardware systems. The market size for software is estimated to be $XX Million in 2025.
Key Drivers of UXO Detection Industry Growth
Several factors drive the growth of the UXO detection industry. These include increasing government regulations mandating environmental remediation, the rising need for infrastructure development in contaminated areas, and advancements in sensor technologies leading to more accurate and efficient detection. Furthermore, the growing awareness of the risks associated with unexploded ordnance and the rising demand for land reclamation projects also propel market growth.
Challenges in the UXO Detection Industry Sector
The UXO detection industry faces challenges such as the high cost of equipment, the need for skilled personnel, and the complex regulatory landscape in different regions. Supply chain disruptions and the competitive landscape with several players vying for market share also pose significant challenges. These factors can impact the overall market growth and adoption of new technologies. The cumulative effect of these challenges is estimated to reduce the market growth by approximately XX% during the forecast period.
Emerging Opportunities in UXO Detection Industry
Emerging opportunities lie in the development of more advanced and autonomous systems leveraging AI and machine learning for enhanced accuracy and efficiency. The expansion into new geographical markets with significant UXO contamination and the increasing integration of UXO detection technologies into broader environmental monitoring solutions also represent substantial opportunities for growth.
Leading Players in the UXO Detection Industry Market
- Vallon GmbH
- Seequent Limited
- Defense Research and Development Organization
- Gem Systems Inc
- Foerster Group
- Schonstedt Instrument Company
- OPEC Systems Pty Ltd
- Dynasafe AB
- MRS Management Limited
- *List Not Exhaustive
Key Developments in UXO Detection Industry Industry
- 2022-03: Vallon GmbH launched a new AI-powered data analysis software.
- 2023-06: Seequent Limited acquired a smaller UXO detection company, expanding its market reach.
- 2024-10: A new regulatory framework for UXO detection was implemented in several European countries.
- Further significant developments will be detailed within the full report.
Strategic Outlook for UXO Detection Industry Market
The UXO detection market is poised for significant growth in the coming years, driven by continued technological innovation, increasing government funding, and rising awareness of the environmental and societal impacts of unexploded ordnance. Emerging technologies and expanding applications in various sectors present substantial opportunities for market expansion and innovation. The market is expected to remain dynamic with new players emerging and established companies continuously improving their product offerings to stay ahead of the curve.
UXO Detection Industry Segmentation
-
1. System Type
- 1.1. Hardware
- 1.2. Software
UXO Detection Industry Segmentation By Geography
-
1. North America
- 1.1. United States
- 1.2. Canada
-
2. Europe
- 2.1. Germany
- 2.2. United Kingdom
- 2.3. France
- 2.4. Rest of Europe
-
3. Asia Pacific
- 3.1. India
- 3.2. China
- 3.3. Japan
- 3.4. South Korea
- 3.5. Rest of Asia Pacific
-
4. Latin America
- 4.1. Mexico
- 4.2. Brazil
- 4.3. Rest Of Latin America
-
5. Middle East and Africa
- 5.1. Saudi Arabia
- 5.2. Israel
- 5.3. Rest Of Middle East and Africa
UXO Detection Industry REPORT HIGHLIGHTS
| Aspects | Details |
|---|---|
| Study Period | 2019-2033 |
| Base Year | 2024 |
| Estimated Year | 2025 |
| Forecast Period | 2025-2033 |
| Historical Period | 2019-2024 |
| Growth Rate | CAGR of > 2.50% from 2019-2033 |
| Segmentation |
|
Table of Contents
- 1. Introduction
- 1.1. Research Scope
- 1.2. Market Segmentation
- 1.3. Research Methodology
- 1.4. Definitions and Assumptions
- 2. Executive Summary
- 2.1. Introduction
- 3. Market Dynamics
- 3.1. Introduction
- 3.2. Market Drivers
- 3.3. Market Restrains
- 3.4. Market Trends
- 3.4.1. Hardware Segment To Exhibit The Highest Growth Rate
- 4. Market Factor Analysis
- 4.1. Porters Five Forces
- 4.2. Supply/Value Chain
- 4.3. PESTEL analysis
- 4.4. Market Entropy
- 4.5. Patent/Trademark Analysis
- 5. Global UXO Detection Industry Analysis, Insights and Forecast, 2019-2031
- 5.1. Market Analysis, Insights and Forecast - by System Type
- 5.1.1. Hardware
- 5.1.2. Software
- 5.2. Market Analysis, Insights and Forecast - by Region
- 5.2.1. North America
- 5.2.2. Europe
- 5.2.3. Asia Pacific
- 5.2.4. Latin America
- 5.2.5. Middle East and Africa
- 5.1. Market Analysis, Insights and Forecast - by System Type
- 6. North America UXO Detection Industry Analysis, Insights and Forecast, 2019-2031
- 6.1. Market Analysis, Insights and Forecast - by System Type
- 6.1.1. Hardware
- 6.1.2. Software
- 6.1. Market Analysis, Insights and Forecast - by System Type
- 7. Europe UXO Detection Industry Analysis, Insights and Forecast, 2019-2031
- 7.1. Market Analysis, Insights and Forecast - by System Type
- 7.1.1. Hardware
- 7.1.2. Software
- 7.1. Market Analysis, Insights and Forecast - by System Type
- 8. Asia Pacific UXO Detection Industry Analysis, Insights and Forecast, 2019-2031
- 8.1. Market Analysis, Insights and Forecast - by System Type
- 8.1.1. Hardware
- 8.1.2. Software
- 8.1. Market Analysis, Insights and Forecast - by System Type
- 9. Latin America UXO Detection Industry Analysis, Insights and Forecast, 2019-2031
- 9.1. Market Analysis, Insights and Forecast - by System Type
- 9.1.1. Hardware
- 9.1.2. Software
- 9.1. Market Analysis, Insights and Forecast - by System Type
- 10. Middle East and Africa UXO Detection Industry Analysis, Insights and Forecast, 2019-2031
- 10.1. Market Analysis, Insights and Forecast - by System Type
- 10.1.1. Hardware
- 10.1.2. Software
- 10.1. Market Analysis, Insights and Forecast - by System Type
- 11. North America UXO Detection Industry Analysis, Insights and Forecast, 2019-2031
- 11.1. Market Analysis, Insights and Forecast - By Country/Sub-region
- 11.1.1 United States
- 11.1.2 Canada
- 12. Europe UXO Detection Industry Analysis, Insights and Forecast, 2019-2031
- 12.1. Market Analysis, Insights and Forecast - By Country/Sub-region
- 12.1.1 Germany
- 12.1.2 United Kingdom
- 12.1.3 France
- 12.1.4 Rest of Europe
- 13. Asia Pacific UXO Detection Industry Analysis, Insights and Forecast, 2019-2031
- 13.1. Market Analysis, Insights and Forecast - By Country/Sub-region
- 13.1.1 India
- 13.1.2 China
- 13.1.3 Japan
- 13.1.4 South Korea
- 13.1.5 Rest of Asia Pacific
- 14. Latin America UXO Detection Industry Analysis, Insights and Forecast, 2019-2031
- 14.1. Market Analysis, Insights and Forecast - By Country/Sub-region
- 14.1.1 Mexico
- 14.1.2 Brazil
- 14.1.3 Rest Of Latin America
- 15. Middle East and Africa UXO Detection Industry Analysis, Insights and Forecast, 2019-2031
- 15.1. Market Analysis, Insights and Forecast - By Country/Sub-region
- 15.1.1 Saudi Arabia
- 15.1.2 Israel
- 15.1.3 Rest Of Middle East and Africa
- 16. Competitive Analysis
- 16.1. Global Market Share Analysis 2024
- 16.2. Company Profiles
- 16.2.1 Vallon GmbH
- 16.2.1.1. Overview
- 16.2.1.2. Products
- 16.2.1.3. SWOT Analysis
- 16.2.1.4. Recent Developments
- 16.2.1.5. Financials (Based on Availability)
- 16.2.2 Seequent Limited
- 16.2.2.1. Overview
- 16.2.2.2. Products
- 16.2.2.3. SWOT Analysis
- 16.2.2.4. Recent Developments
- 16.2.2.5. Financials (Based on Availability)
- 16.2.3 Defense Research And Development Organization
- 16.2.3.1. Overview
- 16.2.3.2. Products
- 16.2.3.3. SWOT Analysis
- 16.2.3.4. Recent Developments
- 16.2.3.5. Financials (Based on Availability)
- 16.2.4 Gem Systems Inc
- 16.2.4.1. Overview
- 16.2.4.2. Products
- 16.2.4.3. SWOT Analysis
- 16.2.4.4. Recent Developments
- 16.2.4.5. Financials (Based on Availability)
- 16.2.5 Foerster Group
- 16.2.5.1. Overview
- 16.2.5.2. Products
- 16.2.5.3. SWOT Analysis
- 16.2.5.4. Recent Developments
- 16.2.5.5. Financials (Based on Availability)
- 16.2.6 Schonstedt Instrument Company
- 16.2.6.1. Overview
- 16.2.6.2. Products
- 16.2.6.3. SWOT Analysis
- 16.2.6.4. Recent Developments
- 16.2.6.5. Financials (Based on Availability)
- 16.2.7 OPEC Systems Pty Ltd
- 16.2.7.1. Overview
- 16.2.7.2. Products
- 16.2.7.3. SWOT Analysis
- 16.2.7.4. Recent Developments
- 16.2.7.5. Financials (Based on Availability)
- 16.2.8 Dynasafe AB
- 16.2.8.1. Overview
- 16.2.8.2. Products
- 16.2.8.3. SWOT Analysis
- 16.2.8.4. Recent Developments
- 16.2.8.5. Financials (Based on Availability)
- 16.2.9 MRS Management Limited*List Not Exhaustive
- 16.2.9.1. Overview
- 16.2.9.2. Products
- 16.2.9.3. SWOT Analysis
- 16.2.9.4. Recent Developments
- 16.2.9.5. Financials (Based on Availability)
- 16.2.1 Vallon GmbH
List of Figures
- Figure 1: Global UXO Detection Industry Revenue Breakdown (Million, %) by Region 2024 & 2032
- Figure 2: North America UXO Detection Industry Revenue (Million), by Country 2024 & 2032
- Figure 3: North America UXO Detection Industry Revenue Share (%), by Country 2024 & 2032
- Figure 4: Europe UXO Detection Industry Revenue (Million), by Country 2024 & 2032
- Figure 5: Europe UXO Detection Industry Revenue Share (%), by Country 2024 & 2032
- Figure 6: Asia Pacific UXO Detection Industry Revenue (Million), by Country 2024 & 2032
- Figure 7: Asia Pacific UXO Detection Industry Revenue Share (%), by Country 2024 & 2032
- Figure 8: Latin America UXO Detection Industry Revenue (Million), by Country 2024 & 2032
- Figure 9: Latin America UXO Detection Industry Revenue Share (%), by Country 2024 & 2032
- Figure 10: Middle East and Africa UXO Detection Industry Revenue (Million), by Country 2024 & 2032
- Figure 11: Middle East and Africa UXO Detection Industry Revenue Share (%), by Country 2024 & 2032
- Figure 12: North America UXO Detection Industry Revenue (Million), by System Type 2024 & 2032
- Figure 13: North America UXO Detection Industry Revenue Share (%), by System Type 2024 & 2032
- Figure 14: North America UXO Detection Industry Revenue (Million), by Country 2024 & 2032
- Figure 15: North America UXO Detection Industry Revenue Share (%), by Country 2024 & 2032
- Figure 16: Europe UXO Detection Industry Revenue (Million), by System Type 2024 & 2032
- Figure 17: Europe UXO Detection Industry Revenue Share (%), by System Type 2024 & 2032
- Figure 18: Europe UXO Detection Industry Revenue (Million), by Country 2024 & 2032
- Figure 19: Europe UXO Detection Industry Revenue Share (%), by Country 2024 & 2032
- Figure 20: Asia Pacific UXO Detection Industry Revenue (Million), by System Type 2024 & 2032
- Figure 21: Asia Pacific UXO Detection Industry Revenue Share (%), by System Type 2024 & 2032
- Figure 22: Asia Pacific UXO Detection Industry Revenue (Million), by Country 2024 & 2032
- Figure 23: Asia Pacific UXO Detection Industry Revenue Share (%), by Country 2024 & 2032
- Figure 24: Latin America UXO Detection Industry Revenue (Million), by System Type 2024 & 2032
- Figure 25: Latin America UXO Detection Industry Revenue Share (%), by System Type 2024 & 2032
- Figure 26: Latin America UXO Detection Industry Revenue (Million), by Country 2024 & 2032
- Figure 27: Latin America UXO Detection Industry Revenue Share (%), by Country 2024 & 2032
- Figure 28: Middle East and Africa UXO Detection Industry Revenue (Million), by System Type 2024 & 2032
- Figure 29: Middle East and Africa UXO Detection Industry Revenue Share (%), by System Type 2024 & 2032
- Figure 30: Middle East and Africa UXO Detection Industry Revenue (Million), by Country 2024 & 2032
- Figure 31: Middle East and Africa UXO Detection Industry Revenue Share (%), by Country 2024 & 2032
List of Tables
- Table 1: Global UXO Detection Industry Revenue Million Forecast, by Region 2019 & 2032
- Table 2: Global UXO Detection Industry Revenue Million Forecast, by System Type 2019 & 2032
- Table 3: Global UXO Detection Industry Revenue Million Forecast, by Region 2019 & 2032
- Table 4: Global UXO Detection Industry Revenue Million Forecast, by Country 2019 & 2032
- Table 5: United States UXO Detection Industry Revenue (Million) Forecast, by Application 2019 & 2032
- Table 6: Canada UXO Detection Industry Revenue (Million) Forecast, by Application 2019 & 2032
- Table 7: Global UXO Detection Industry Revenue Million Forecast, by Country 2019 & 2032
- Table 8: Germany UXO Detection Industry Revenue (Million) Forecast, by Application 2019 & 2032
- Table 9: United Kingdom UXO Detection Industry Revenue (Million) Forecast, by Application 2019 & 2032
- Table 10: France UXO Detection Industry Revenue (Million) Forecast, by Application 2019 & 2032
- Table 11: Rest of Europe UXO Detection Industry Revenue (Million) Forecast, by Application 2019 & 2032
- Table 12: Global UXO Detection Industry Revenue Million Forecast, by Country 2019 & 2032
- Table 13: India UXO Detection Industry Revenue (Million) Forecast, by Application 2019 & 2032
- Table 14: China UXO Detection Industry Revenue (Million) Forecast, by Application 2019 & 2032
- Table 15: Japan UXO Detection Industry Revenue (Million) Forecast, by Application 2019 & 2032
- Table 16: South Korea UXO Detection Industry Revenue (Million) Forecast, by Application 2019 & 2032
- Table 17: Rest of Asia Pacific UXO Detection Industry Revenue (Million) Forecast, by Application 2019 & 2032
- Table 18: Global UXO Detection Industry Revenue Million Forecast, by Country 2019 & 2032
- Table 19: Mexico UXO Detection Industry Revenue (Million) Forecast, by Application 2019 & 2032
- Table 20: Brazil UXO Detection Industry Revenue (Million) Forecast, by Application 2019 & 2032
- Table 21: Rest Of Latin America UXO Detection Industry Revenue (Million) Forecast, by Application 2019 & 2032
- Table 22: Global UXO Detection Industry Revenue Million Forecast, by Country 2019 & 2032
- Table 23: Saudi Arabia UXO Detection Industry Revenue (Million) Forecast, by Application 2019 & 2032
- Table 24: Israel UXO Detection Industry Revenue (Million) Forecast, by Application 2019 & 2032
- Table 25: Rest Of Middle East and Africa UXO Detection Industry Revenue (Million) Forecast, by Application 2019 & 2032
- Table 26: Global UXO Detection Industry Revenue Million Forecast, by System Type 2019 & 2032
- Table 27: Global UXO Detection Industry Revenue Million Forecast, by Country 2019 & 2032
- Table 28: United States UXO Detection Industry Revenue (Million) Forecast, by Application 2019 & 2032
- Table 29: Canada UXO Detection Industry Revenue (Million) Forecast, by Application 2019 & 2032
- Table 30: Global UXO Detection Industry Revenue Million Forecast, by System Type 2019 & 2032
- Table 31: Global UXO Detection Industry Revenue Million Forecast, by Country 2019 & 2032
- Table 32: Germany UXO Detection Industry Revenue (Million) Forecast, by Application 2019 & 2032
- Table 33: United Kingdom UXO Detection Industry Revenue (Million) Forecast, by Application 2019 & 2032
- Table 34: France UXO Detection Industry Revenue (Million) Forecast, by Application 2019 & 2032
- Table 35: Rest of Europe UXO Detection Industry Revenue (Million) Forecast, by Application 2019 & 2032
- Table 36: Global UXO Detection Industry Revenue Million Forecast, by System Type 2019 & 2032
- Table 37: Global UXO Detection Industry Revenue Million Forecast, by Country 2019 & 2032
- Table 38: India UXO Detection Industry Revenue (Million) Forecast, by Application 2019 & 2032
- Table 39: China UXO Detection Industry Revenue (Million) Forecast, by Application 2019 & 2032
- Table 40: Japan UXO Detection Industry Revenue (Million) Forecast, by Application 2019 & 2032
- Table 41: South Korea UXO Detection Industry Revenue (Million) Forecast, by Application 2019 & 2032
- Table 42: Rest of Asia Pacific UXO Detection Industry Revenue (Million) Forecast, by Application 2019 & 2032
- Table 43: Global UXO Detection Industry Revenue Million Forecast, by System Type 2019 & 2032
- Table 44: Global UXO Detection Industry Revenue Million Forecast, by Country 2019 & 2032
- Table 45: Mexico UXO Detection Industry Revenue (Million) Forecast, by Application 2019 & 2032
- Table 46: Brazil UXO Detection Industry Revenue (Million) Forecast, by Application 2019 & 2032
- Table 47: Rest Of Latin America UXO Detection Industry Revenue (Million) Forecast, by Application 2019 & 2032
- Table 48: Global UXO Detection Industry Revenue Million Forecast, by System Type 2019 & 2032
- Table 49: Global UXO Detection Industry Revenue Million Forecast, by Country 2019 & 2032
- Table 50: Saudi Arabia UXO Detection Industry Revenue (Million) Forecast, by Application 2019 & 2032
- Table 51: Israel UXO Detection Industry Revenue (Million) Forecast, by Application 2019 & 2032
- Table 52: Rest Of Middle East and Africa UXO Detection Industry Revenue (Million) Forecast, by Application 2019 & 2032
Frequently Asked Questions
1. What is the projected Compound Annual Growth Rate (CAGR) of the UXO Detection Industry?
The projected CAGR is approximately > 2.50%.
2. Which companies are prominent players in the UXO Detection Industry?
Key companies in the market include Vallon GmbH, Seequent Limited, Defense Research And Development Organization, Gem Systems Inc, Foerster Group, Schonstedt Instrument Company, OPEC Systems Pty Ltd, Dynasafe AB, MRS Management Limited*List Not Exhaustive.
3. What are the main segments of the UXO Detection Industry?
The market segments include System Type.
4. Can you provide details about the market size?
The market size is estimated to be USD XX Million as of 2022.
5. What are some drivers contributing to market growth?
N/A
6. What are the notable trends driving market growth?
Hardware Segment To Exhibit The Highest Growth Rate.
7. Are there any restraints impacting market growth?
N/A
8. Can you provide examples of recent developments in the market?
N/A
9. What pricing options are available for accessing the report?
Pricing options include single-user, multi-user, and enterprise licenses priced at USD 4750, USD 5250, and USD 8750 respectively.
10. Is the market size provided in terms of value or volume?
The market size is provided in terms of value, measured in Million.
11. Are there any specific market keywords associated with the report?
Yes, the market keyword associated with the report is "UXO Detection Industry," which aids in identifying and referencing the specific market segment covered.
12. How do I determine which pricing option suits my needs best?
The pricing options vary based on user requirements and access needs. Individual users may opt for single-user licenses, while businesses requiring broader access may choose multi-user or enterprise licenses for cost-effective access to the report.
13. Are there any additional resources or data provided in the UXO Detection Industry report?
While the report offers comprehensive insights, it's advisable to review the specific contents or supplementary materials provided to ascertain if additional resources or data are available.
14. How can I stay updated on further developments or reports in the UXO Detection Industry?
To stay informed about further developments, trends, and reports in the UXO Detection Industry, consider subscribing to industry newsletters, following relevant companies and organizations, or regularly checking reputable industry news sources and publications.
Methodology
Step 1 - Identification of Relevant Samples Size from Population Database


Step 2 - Approaches for Defining Global Market Size (Value, Volume* & Price*)

Note*: In applicable scenarios
Step 3 - Data Sources
Primary Research
- Web Analytics
- Survey Reports
- Research Institute
- Latest Research Reports
- Opinion Leaders
Secondary Research
- Annual Reports
- White Paper
- Latest Press Release
- Industry Association
- Paid Database
- Investor Presentations

Step 4 - Data Triangulation
Involves using different sources of information in order to increase the validity of a study
These sources are likely to be stakeholders in a program - participants, other researchers, program staff, other community members, and so on.
Then we put all data in single framework & apply various statistical tools to find out the dynamic on the market.
During the analysis stage, feedback from the stakeholder groups would be compared to determine areas of agreement as well as areas of divergence


