
Key Insights
The Video-as-a-Service (VaaS) market is experiencing robust growth, projected to reach a substantial size driven by increasing demand for collaborative communication and remote work solutions. The market's Compound Annual Growth Rate (CAGR) of 14.80% from 2019 to 2024 indicates a strong upward trajectory, expected to continue through 2033. This expansion is fueled by several key drivers: the rising adoption of cloud-based technologies, the increasing need for enhanced communication and collaboration tools across diverse industries, and the expanding global reach of high-speed internet connectivity. The surge in remote work and hybrid work models accelerated this trend, making VaaS solutions indispensable for maintaining productivity and seamless team interaction. Market segmentation reveals strong growth across various services (managed and professional), deployment models (public, private, and hybrid cloud), end-user industries (particularly BFSI, Government and Defense, and Healthcare), and platforms (application, device, and network management). The diverse device landscape, including mobility devices and enterprise computing, further contributes to market expansion.
The competitive landscape is characterized by a mix of established players and emerging innovative companies. Key players are leveraging advanced technologies like AI and machine learning to enhance functionalities, improving video quality, security, and scalability. Geographic expansion is another significant factor, with North America currently holding a dominant market share due to early adoption and technological advancements. However, Asia-Pacific is expected to witness significant growth, driven by rapid digitalization and increasing internet penetration in developing economies. Challenges such as data security concerns, integration complexities, and high initial investment costs could act as potential restraints. However, ongoing technological innovations and the increasing focus on addressing security challenges are likely to mitigate these concerns. Future market growth will depend on successful navigation of these challenges, alongside continuous innovation and market expansion into underserved regions.
VaaS Market: A Comprehensive Report (2019-2033)
This comprehensive report provides an in-depth analysis of the Video as a Service (VaaS) market, offering valuable insights for industry stakeholders, investors, and businesses seeking to navigate this rapidly evolving landscape. The report covers the period from 2019 to 2033, with a focus on the forecast period of 2025-2033 and a base year of 2025. The market is segmented by service, deployment model, end-user industry, platform, and device, providing a granular understanding of market dynamics. The report also highlights key players, industry developments, and future growth opportunities. Projected market values are in Millions.
VaaS Market Concentration & Innovation
The VaaS market exhibits a moderately concentrated landscape, with a few dominant players holding significant market share. However, the market also shows signs of increasing fragmentation due to the emergence of niche players and innovative solutions. The estimated combined market share of the top five players in 2025 is xx%. Innovation is a key driver, fueled by advancements in cloud computing, AI, and 5G technology, leading to enhanced video quality, improved collaboration features, and greater scalability. Regulatory frameworks concerning data privacy and security are shaping market practices. Product substitutes, such as traditional video conferencing systems, are facing increasing competition from the flexibility and cost-effectiveness of VaaS. End-user trends indicate a growing preference for integrated and user-friendly solutions. M&A activity is moderate, with an estimated xx Million in deal value recorded in 2024. Notable transactions included the acquisition of [Company A] by [Company B] valued at xx Million.
- Market Concentration: Top 5 players hold xx% market share in 2025.
- Innovation Drivers: Cloud computing, AI, 5G.
- M&A Activity (2024): Estimated value of xx Million.
VaaS Market Industry Trends & Insights
The VaaS market is experiencing robust growth, driven by the increasing adoption of cloud-based solutions, the rise of remote work, and the growing demand for enhanced collaboration tools across various industries. The Compound Annual Growth Rate (CAGR) is projected to be xx% during the forecast period (2025-2033). Technological disruptions such as the integration of AI and AR/VR are further enhancing the capabilities of VaaS platforms. Consumer preferences are shifting towards user-friendly interfaces, secure platforms, and seamless integration with existing workflows. Competitive dynamics are characterized by intense innovation, strategic partnerships, and acquisitions. Market penetration is expected to reach xx% by 2033. Challenges like security concerns and ensuring consistent quality of service in diverse network environments need to be addressed.
Dominant Markets & Segments in VaaS Market
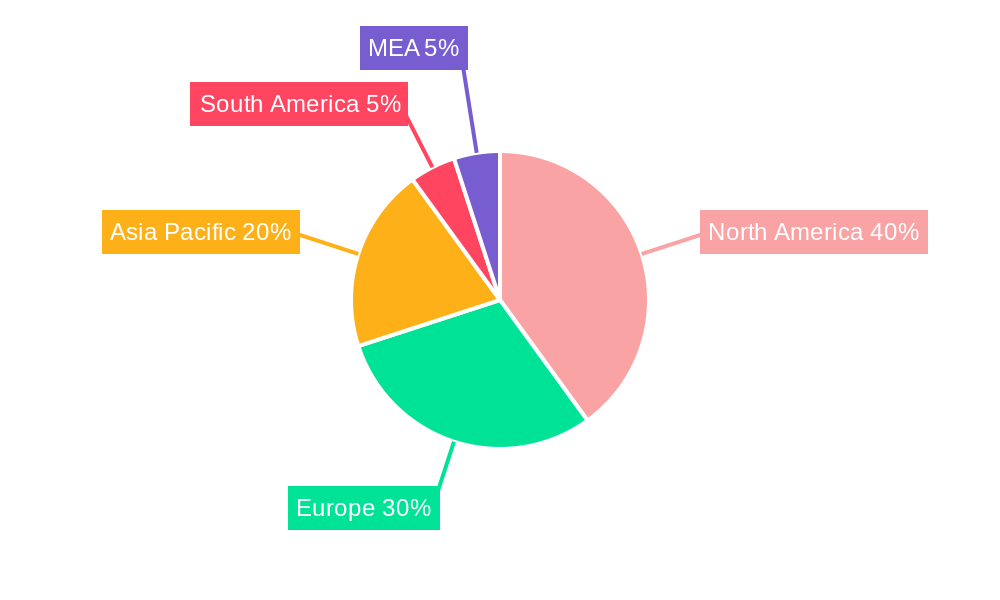
The North American region currently dominates the VaaS market, driven by strong technological advancements, high adoption rates in various sectors, and robust IT infrastructure. Within segments:
- By Service: Managed services represent the largest segment, accounting for xx% of the market in 2025, due to the cost-effectiveness and ease of management.
- By Deployment Model: The Public Cloud segment is expected to maintain its dominance due to its scalability and cost-efficiency.
- By End-user Industry: The BFSI sector is anticipated to witness substantial growth, driven by the increasing need for secure and reliable communication solutions. Other rapidly expanding sectors include Healthcare and IT & Telecom.
- By Platform: Application management is the leading platform segment, reflecting the focus on seamless integration and enhanced application functionality.
- By Device: Enterprise computing devices currently hold a larger market share, though mobility devices are rapidly gaining traction.
Key drivers for dominance vary across segments: for North America, strong technological advancements are a key factor; for Managed Services, it is cost-effectiveness. BFSI sector growth is fueled by the demand for secure communication.
VaaS Market Product Developments
Recent product innovations focus on enhancing video quality, integrating AI-powered features such as real-time transcription and translation, and improving security protocols. New applications are emerging in areas such as telehealth, remote education, and virtual events. Competitive advantages are derived from superior user experience, robust security features, and seamless integration with other business applications. Technological trends point towards the increased use of AI, VR/AR and advanced analytics for enhanced video collaboration and productivity.
Report Scope & Segmentation Analysis
The report provides a comprehensive analysis of the VaaS market segmented by:
- By Service: Managed and Professional services, with projected growth for managed services exceeding xx% in the forecast period.
- By Deployment Model: Public Cloud, Private Cloud, and Hybrid Cloud deployments, with public cloud maintaining its dominance.
- By End-user Industry: Government and Defense, BFSI, Healthcare, IT & Telecom, Media & Entertainment, Manufacturing, and Other End-user Industries; BFSI and Healthcare sectors showing high growth potential.
- By Platform: Application Management, Device Management, and Network Management, with application management leading the way.
- By Device: Mobility Devices and Enterprise Computing, with a gradual shift towards increased mobility device usage.
Each segment analysis includes market size estimates, growth projections, and competitive landscape details.
Key Drivers of VaaS Market Growth
The VaaS market is propelled by several key factors:
- Technological advancements: AI, 5G, and improved cloud infrastructure enhance video quality, reliability, and features.
- Economic factors: Cost-effectiveness of cloud-based solutions, increased adoption of remote work models.
- Regulatory changes: Government initiatives promoting digital transformation and digital infrastructure.
Challenges in the VaaS Market Sector
The VaaS market faces several challenges:
- Security concerns: Protecting sensitive data transmitted during video conferences.
- Network reliability: Ensuring consistent video quality across diverse network conditions.
- Competitive pressures: Intense competition among vendors and the emergence of new technologies. This is projected to result in a xx% reduction in average revenue per user (ARPU) by 2033.
Emerging Opportunities in VaaS Market
Several emerging opportunities are shaping the future of the VaaS market:
- Integration with IoT: Connecting video conferencing with smart devices and sensors.
- Expansion into new markets: Targeting underserved regions and industries.
- Development of specialized VaaS solutions: Creating platforms tailored to specific industry needs.
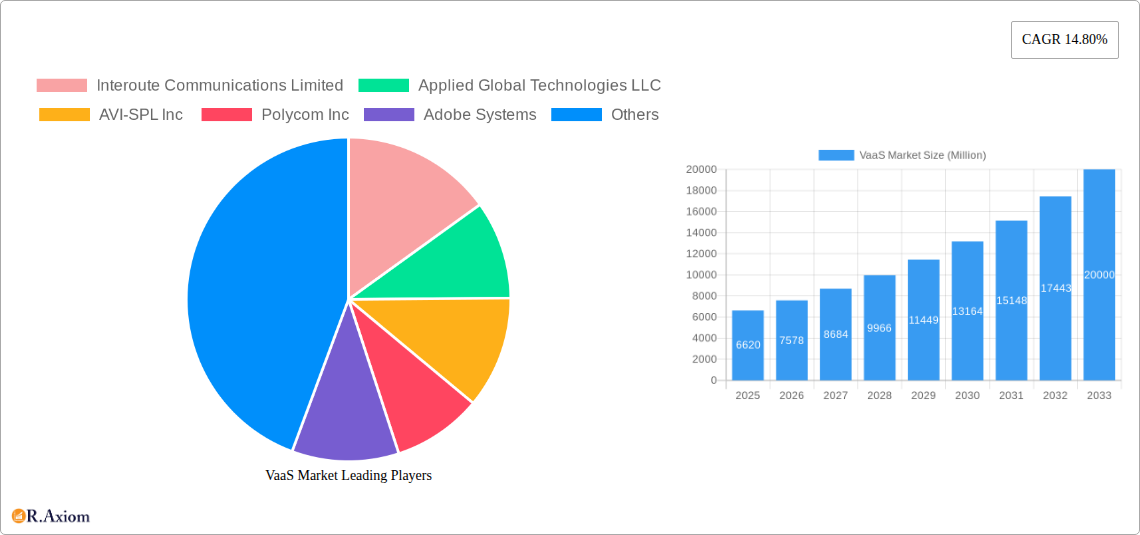
Leading Players in the VaaS Market Market
- Interoute Communications Limited
- Applied Global Technologies LLC
- AVI-SPL Inc
- Polycom Inc
- Adobe Systems (Adobe Systems)
- Cisco Systems Inc (Cisco Systems Inc)
- Avaya Inc (Avaya Inc)
- BlueJeans Network
- Huawei Technologies Co Limited (Huawei Technologies Co Limited)
- Vidyo Inc
Key Developments in VaaS Market Industry
- November 2022: Tesla integrates Zoom app into its in-car infotainment system, expanding VaaS applications to the automotive sector.
- October 2022: Cisco and Microsoft partner to integrate Microsoft Teams with Cisco devices, enhancing interoperability and user experience.
Strategic Outlook for VaaS Market Market
The VaaS market is poised for sustained growth, driven by ongoing technological advancements, the increasing adoption of remote work, and the expanding applications of video conferencing across various industries. New market segments, such as the metaverse and immersive experiences, present significant growth opportunities. Companies that can effectively address security concerns, improve network reliability, and offer seamless integration with other business tools will likely gain a competitive edge.
VaaS Market Segmentation
-
1. Platform
- 1.1. Application Management
- 1.2. Device Management
- 1.3. Network Management
-
2. Device
- 2.1. Mobility Devices
- 2.2. Enterprise Computing
-
3. Service
- 3.1. Managed
- 3.2. Professional
-
4. Deployment Model
- 4.1. Public Cloud
- 4.2. Private Cloud
- 4.3. Hybrid Cloud
-
5. End-user Industry
- 5.1. Government and Defense
- 5.2. BFSI
- 5.3. Healthcare
- 5.4. IT & Telecom
- 5.5. Media & Entertainment
- 5.6. Manufacturing
- 5.7. Other End-user Industries
VaaS Market Segmentation By Geography
- 1. North America
- 2. Europe
- 3. Asia
- 4. Latin America
- 5. Middle East and Africa
VaaS Market REPORT HIGHLIGHTS
| Aspects | Details |
|---|---|
| Study Period | 2019-2033 |
| Base Year | 2024 |
| Estimated Year | 2025 |
| Forecast Period | 2025-2033 |
| Historical Period | 2019-2024 |
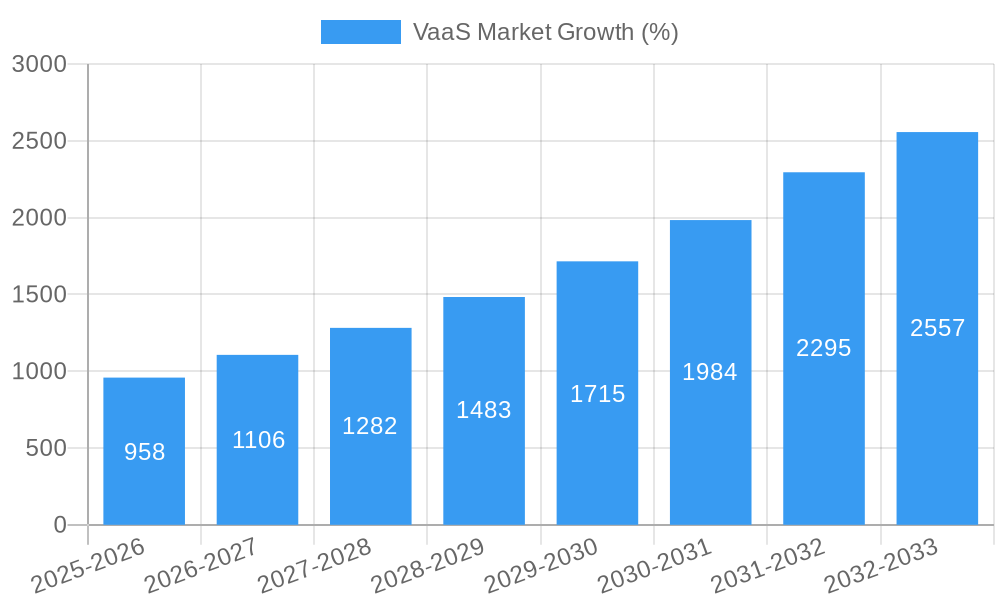
| Growth Rate | CAGR of 14.80% from 2019-2033 |
| Segmentation |
|
Table of Contents
- 1. Introduction
- 1.1. Research Scope
- 1.2. Market Segmentation
- 1.3. Research Methodology
- 1.4. Definitions and Assumptions
- 2. Executive Summary
- 2.1. Introduction
- 3. Market Dynamics
- 3.1. Introduction
- 3.2. Market Drivers
- 3.2.1. Increasing Investment on Cloud-Based Video Services; Enabling Digital Workforce
- 3.3. Market Restrains
- 3.3.1. High Cost of Video Content Creation and Validity
- 3.4. Market Trends
- 3.4.1. The Hybrid Cloud Segment is Anticipated to Drive the Market Demand
- 4. Market Factor Analysis
- 4.1. Porters Five Forces
- 4.2. Supply/Value Chain
- 4.3. PESTEL analysis
- 4.4. Market Entropy
- 4.5. Patent/Trademark Analysis
- 5. Global VaaS Market Analysis, Insights and Forecast, 2019-2031
- 5.1. Market Analysis, Insights and Forecast - by Platform
- 5.1.1. Application Management
- 5.1.2. Device Management
- 5.1.3. Network Management
- 5.2. Market Analysis, Insights and Forecast - by Device
- 5.2.1. Mobility Devices
- 5.2.2. Enterprise Computing
- 5.3. Market Analysis, Insights and Forecast - by Service
- 5.3.1. Managed
- 5.3.2. Professional
- 5.4. Market Analysis, Insights and Forecast - by Deployment Model
- 5.4.1. Public Cloud
- 5.4.2. Private Cloud
- 5.4.3. Hybrid Cloud
- 5.5. Market Analysis, Insights and Forecast - by End-user Industry
- 5.5.1. Government and Defense
- 5.5.2. BFSI
- 5.5.3. Healthcare
- 5.5.4. IT & Telecom
- 5.5.5. Media & Entertainment
- 5.5.6. Manufacturing
- 5.5.7. Other End-user Industries
- 5.6. Market Analysis, Insights and Forecast - by Region
- 5.6.1. North America
- 5.6.2. Europe
- 5.6.3. Asia
- 5.6.4. Latin America
- 5.6.5. Middle East and Africa
- 5.1. Market Analysis, Insights and Forecast - by Platform
- 6. North America VaaS Market Analysis, Insights and Forecast, 2019-2031
- 6.1. Market Analysis, Insights and Forecast - by Platform
- 6.1.1. Application Management
- 6.1.2. Device Management
- 6.1.3. Network Management
- 6.2. Market Analysis, Insights and Forecast - by Device
- 6.2.1. Mobility Devices
- 6.2.2. Enterprise Computing
- 6.3. Market Analysis, Insights and Forecast - by Service
- 6.3.1. Managed
- 6.3.2. Professional
- 6.4. Market Analysis, Insights and Forecast - by Deployment Model
- 6.4.1. Public Cloud
- 6.4.2. Private Cloud
- 6.4.3. Hybrid Cloud
- 6.5. Market Analysis, Insights and Forecast - by End-user Industry
- 6.5.1. Government and Defense
- 6.5.2. BFSI
- 6.5.3. Healthcare
- 6.5.4. IT & Telecom
- 6.5.5. Media & Entertainment
- 6.5.6. Manufacturing
- 6.5.7. Other End-user Industries
- 6.1. Market Analysis, Insights and Forecast - by Platform
- 7. Europe VaaS Market Analysis, Insights and Forecast, 2019-2031
- 7.1. Market Analysis, Insights and Forecast - by Platform
- 7.1.1. Application Management
- 7.1.2. Device Management
- 7.1.3. Network Management
- 7.2. Market Analysis, Insights and Forecast - by Device
- 7.2.1. Mobility Devices
- 7.2.2. Enterprise Computing
- 7.3. Market Analysis, Insights and Forecast - by Service
- 7.3.1. Managed
- 7.3.2. Professional
- 7.4. Market Analysis, Insights and Forecast - by Deployment Model
- 7.4.1. Public Cloud
- 7.4.2. Private Cloud
- 7.4.3. Hybrid Cloud
- 7.5. Market Analysis, Insights and Forecast - by End-user Industry
- 7.5.1. Government and Defense
- 7.5.2. BFSI
- 7.5.3. Healthcare
- 7.5.4. IT & Telecom
- 7.5.5. Media & Entertainment
- 7.5.6. Manufacturing
- 7.5.7. Other End-user Industries
- 7.1. Market Analysis, Insights and Forecast - by Platform
- 8. Asia VaaS Market Analysis, Insights and Forecast, 2019-2031
- 8.1. Market Analysis, Insights and Forecast - by Platform
- 8.1.1. Application Management
- 8.1.2. Device Management
- 8.1.3. Network Management
- 8.2. Market Analysis, Insights and Forecast - by Device
- 8.2.1. Mobility Devices
- 8.2.2. Enterprise Computing
- 8.3. Market Analysis, Insights and Forecast - by Service
- 8.3.1. Managed
- 8.3.2. Professional
- 8.4. Market Analysis, Insights and Forecast - by Deployment Model
- 8.4.1. Public Cloud
- 8.4.2. Private Cloud
- 8.4.3. Hybrid Cloud
- 8.5. Market Analysis, Insights and Forecast - by End-user Industry
- 8.5.1. Government and Defense
- 8.5.2. BFSI
- 8.5.3. Healthcare
- 8.5.4. IT & Telecom
- 8.5.5. Media & Entertainment
- 8.5.6. Manufacturing
- 8.5.7. Other End-user Industries
- 8.1. Market Analysis, Insights and Forecast - by Platform
- 9. Latin America VaaS Market Analysis, Insights and Forecast, 2019-2031
- 9.1. Market Analysis, Insights and Forecast - by Platform
- 9.1.1. Application Management
- 9.1.2. Device Management
- 9.1.3. Network Management
- 9.2. Market Analysis, Insights and Forecast - by Device
- 9.2.1. Mobility Devices
- 9.2.2. Enterprise Computing
- 9.3. Market Analysis, Insights and Forecast - by Service
- 9.3.1. Managed
- 9.3.2. Professional
- 9.4. Market Analysis, Insights and Forecast - by Deployment Model
- 9.4.1. Public Cloud
- 9.4.2. Private Cloud
- 9.4.3. Hybrid Cloud
- 9.5. Market Analysis, Insights and Forecast - by End-user Industry
- 9.5.1. Government and Defense
- 9.5.2. BFSI
- 9.5.3. Healthcare
- 9.5.4. IT & Telecom
- 9.5.5. Media & Entertainment
- 9.5.6. Manufacturing
- 9.5.7. Other End-user Industries
- 9.1. Market Analysis, Insights and Forecast - by Platform
- 10. Middle East and Africa VaaS Market Analysis, Insights and Forecast, 2019-2031
- 10.1. Market Analysis, Insights and Forecast - by Platform
- 10.1.1. Application Management
- 10.1.2. Device Management
- 10.1.3. Network Management
- 10.2. Market Analysis, Insights and Forecast - by Device
- 10.2.1. Mobility Devices
- 10.2.2. Enterprise Computing
- 10.3. Market Analysis, Insights and Forecast - by Service
- 10.3.1. Managed
- 10.3.2. Professional
- 10.4. Market Analysis, Insights and Forecast - by Deployment Model
- 10.4.1. Public Cloud
- 10.4.2. Private Cloud
- 10.4.3. Hybrid Cloud
- 10.5. Market Analysis, Insights and Forecast - by End-user Industry
- 10.5.1. Government and Defense
- 10.5.2. BFSI
- 10.5.3. Healthcare
- 10.5.4. IT & Telecom
- 10.5.5. Media & Entertainment
- 10.5.6. Manufacturing
- 10.5.7. Other End-user Industries
- 10.1. Market Analysis, Insights and Forecast - by Platform
- 11. North America VaaS Market Analysis, Insights and Forecast, 2019-2031
- 11.1. Market Analysis, Insights and Forecast - By Country/Sub-region
- 11.1.1 United States
- 11.1.2 Canada
- 11.1.3 Mexico
- 12. Europe VaaS Market Analysis, Insights and Forecast, 2019-2031
- 12.1. Market Analysis, Insights and Forecast - By Country/Sub-region
- 12.1.1 Germany
- 12.1.2 United Kingdom
- 12.1.3 France
- 12.1.4 Spain
- 12.1.5 Italy
- 12.1.6 Spain
- 12.1.7 Belgium
- 12.1.8 Netherland
- 12.1.9 Nordics
- 12.1.10 Rest of Europe
- 13. Asia Pacific VaaS Market Analysis, Insights and Forecast, 2019-2031
- 13.1. Market Analysis, Insights and Forecast - By Country/Sub-region
- 13.1.1 China
- 13.1.2 Japan
- 13.1.3 India
- 13.1.4 South Korea
- 13.1.5 Southeast Asia
- 13.1.6 Australia
- 13.1.7 Indonesia
- 13.1.8 Phillipes
- 13.1.9 Singapore
- 13.1.10 Thailandc
- 13.1.11 Rest of Asia Pacific
- 14. South America VaaS Market Analysis, Insights and Forecast, 2019-2031
- 14.1. Market Analysis, Insights and Forecast - By Country/Sub-region
- 14.1.1 Brazil
- 14.1.2 Argentina
- 14.1.3 Peru
- 14.1.4 Chile
- 14.1.5 Colombia
- 14.1.6 Ecuador
- 14.1.7 Venezuela
- 14.1.8 Rest of South America
- 15. North America VaaS Market Analysis, Insights and Forecast, 2019-2031
- 15.1. Market Analysis, Insights and Forecast - By Country/Sub-region
- 15.1.1 United States
- 15.1.2 Canada
- 15.1.3 Mexico
- 16. MEA VaaS Market Analysis, Insights and Forecast, 2019-2031
- 16.1. Market Analysis, Insights and Forecast - By Country/Sub-region
- 16.1.1 United Arab Emirates
- 16.1.2 Saudi Arabia
- 16.1.3 South Africa
- 16.1.4 Rest of Middle East and Africa
- 17. Competitive Analysis
- 17.1. Global Market Share Analysis 2024
- 17.2. Company Profiles
- 17.2.1 Interoute Communications Limited
- 17.2.1.1. Overview
- 17.2.1.2. Products
- 17.2.1.3. SWOT Analysis
- 17.2.1.4. Recent Developments
- 17.2.1.5. Financials (Based on Availability)
- 17.2.2 Applied Global Technologies LLC
- 17.2.2.1. Overview
- 17.2.2.2. Products
- 17.2.2.3. SWOT Analysis
- 17.2.2.4. Recent Developments
- 17.2.2.5. Financials (Based on Availability)
- 17.2.3 AVI-SPL Inc
- 17.2.3.1. Overview
- 17.2.3.2. Products
- 17.2.3.3. SWOT Analysis
- 17.2.3.4. Recent Developments
- 17.2.3.5. Financials (Based on Availability)
- 17.2.4 Polycom Inc
- 17.2.4.1. Overview
- 17.2.4.2. Products
- 17.2.4.3. SWOT Analysis
- 17.2.4.4. Recent Developments
- 17.2.4.5. Financials (Based on Availability)
- 17.2.5 Adobe Systems
- 17.2.5.1. Overview
- 17.2.5.2. Products
- 17.2.5.3. SWOT Analysis
- 17.2.5.4. Recent Developments
- 17.2.5.5. Financials (Based on Availability)
- 17.2.6 Cisco Systems Inc
- 17.2.6.1. Overview
- 17.2.6.2. Products
- 17.2.6.3. SWOT Analysis
- 17.2.6.4. Recent Developments
- 17.2.6.5. Financials (Based on Availability)
- 17.2.7 Avaya Inc
- 17.2.7.1. Overview
- 17.2.7.2. Products
- 17.2.7.3. SWOT Analysis
- 17.2.7.4. Recent Developments
- 17.2.7.5. Financials (Based on Availability)
- 17.2.8 BlueJeans Network
- 17.2.8.1. Overview
- 17.2.8.2. Products
- 17.2.8.3. SWOT Analysis
- 17.2.8.4. Recent Developments
- 17.2.8.5. Financials (Based on Availability)
- 17.2.9 Huawei Technologies Co Limited
- 17.2.9.1. Overview
- 17.2.9.2. Products
- 17.2.9.3. SWOT Analysis
- 17.2.9.4. Recent Developments
- 17.2.9.5. Financials (Based on Availability)
- 17.2.10 Vidyo Inc
- 17.2.10.1. Overview
- 17.2.10.2. Products
- 17.2.10.3. SWOT Analysis
- 17.2.10.4. Recent Developments
- 17.2.10.5. Financials (Based on Availability)
- 17.2.1 Interoute Communications Limited
List of Figures
- Figure 1: Global VaaS Market Revenue Breakdown (Million, %) by Region 2024 & 2032
- Figure 2: North America VaaS Market Revenue (Million), by Country 2024 & 2032
- Figure 3: North America VaaS Market Revenue Share (%), by Country 2024 & 2032
- Figure 4: Europe VaaS Market Revenue (Million), by Country 2024 & 2032
- Figure 5: Europe VaaS Market Revenue Share (%), by Country 2024 & 2032
- Figure 6: Asia Pacific VaaS Market Revenue (Million), by Country 2024 & 2032
- Figure 7: Asia Pacific VaaS Market Revenue Share (%), by Country 2024 & 2032
- Figure 8: South America VaaS Market Revenue (Million), by Country 2024 & 2032
- Figure 9: South America VaaS Market Revenue Share (%), by Country 2024 & 2032
- Figure 10: North America VaaS Market Revenue (Million), by Country 2024 & 2032
- Figure 11: North America VaaS Market Revenue Share (%), by Country 2024 & 2032
- Figure 12: MEA VaaS Market Revenue (Million), by Country 2024 & 2032
- Figure 13: MEA VaaS Market Revenue Share (%), by Country 2024 & 2032
- Figure 14: North America VaaS Market Revenue (Million), by Platform 2024 & 2032
- Figure 15: North America VaaS Market Revenue Share (%), by Platform 2024 & 2032
- Figure 16: North America VaaS Market Revenue (Million), by Device 2024 & 2032
- Figure 17: North America VaaS Market Revenue Share (%), by Device 2024 & 2032
- Figure 18: North America VaaS Market Revenue (Million), by Service 2024 & 2032
- Figure 19: North America VaaS Market Revenue Share (%), by Service 2024 & 2032
- Figure 20: North America VaaS Market Revenue (Million), by Deployment Model 2024 & 2032
- Figure 21: North America VaaS Market Revenue Share (%), by Deployment Model 2024 & 2032
- Figure 22: North America VaaS Market Revenue (Million), by End-user Industry 2024 & 2032
- Figure 23: North America VaaS Market Revenue Share (%), by End-user Industry 2024 & 2032
- Figure 24: North America VaaS Market Revenue (Million), by Country 2024 & 2032
- Figure 25: North America VaaS Market Revenue Share (%), by Country 2024 & 2032
- Figure 26: Europe VaaS Market Revenue (Million), by Platform 2024 & 2032
- Figure 27: Europe VaaS Market Revenue Share (%), by Platform 2024 & 2032
- Figure 28: Europe VaaS Market Revenue (Million), by Device 2024 & 2032
- Figure 29: Europe VaaS Market Revenue Share (%), by Device 2024 & 2032
- Figure 30: Europe VaaS Market Revenue (Million), by Service 2024 & 2032
- Figure 31: Europe VaaS Market Revenue Share (%), by Service 2024 & 2032
- Figure 32: Europe VaaS Market Revenue (Million), by Deployment Model 2024 & 2032
- Figure 33: Europe VaaS Market Revenue Share (%), by Deployment Model 2024 & 2032
- Figure 34: Europe VaaS Market Revenue (Million), by End-user Industry 2024 & 2032
- Figure 35: Europe VaaS Market Revenue Share (%), by End-user Industry 2024 & 2032
- Figure 36: Europe VaaS Market Revenue (Million), by Country 2024 & 2032
- Figure 37: Europe VaaS Market Revenue Share (%), by Country 2024 & 2032
- Figure 38: Asia VaaS Market Revenue (Million), by Platform 2024 & 2032
- Figure 39: Asia VaaS Market Revenue Share (%), by Platform 2024 & 2032
- Figure 40: Asia VaaS Market Revenue (Million), by Device 2024 & 2032
- Figure 41: Asia VaaS Market Revenue Share (%), by Device 2024 & 2032
- Figure 42: Asia VaaS Market Revenue (Million), by Service 2024 & 2032
- Figure 43: Asia VaaS Market Revenue Share (%), by Service 2024 & 2032
- Figure 44: Asia VaaS Market Revenue (Million), by Deployment Model 2024 & 2032
- Figure 45: Asia VaaS Market Revenue Share (%), by Deployment Model 2024 & 2032
- Figure 46: Asia VaaS Market Revenue (Million), by End-user Industry 2024 & 2032
- Figure 47: Asia VaaS Market Revenue Share (%), by End-user Industry 2024 & 2032
- Figure 48: Asia VaaS Market Revenue (Million), by Country 2024 & 2032
- Figure 49: Asia VaaS Market Revenue Share (%), by Country 2024 & 2032
- Figure 50: Latin America VaaS Market Revenue (Million), by Platform 2024 & 2032
- Figure 51: Latin America VaaS Market Revenue Share (%), by Platform 2024 & 2032
- Figure 52: Latin America VaaS Market Revenue (Million), by Device 2024 & 2032
- Figure 53: Latin America VaaS Market Revenue Share (%), by Device 2024 & 2032
- Figure 54: Latin America VaaS Market Revenue (Million), by Service 2024 & 2032
- Figure 55: Latin America VaaS Market Revenue Share (%), by Service 2024 & 2032
- Figure 56: Latin America VaaS Market Revenue (Million), by Deployment Model 2024 & 2032
- Figure 57: Latin America VaaS Market Revenue Share (%), by Deployment Model 2024 & 2032
- Figure 58: Latin America VaaS Market Revenue (Million), by End-user Industry 2024 & 2032
- Figure 59: Latin America VaaS Market Revenue Share (%), by End-user Industry 2024 & 2032
- Figure 60: Latin America VaaS Market Revenue (Million), by Country 2024 & 2032
- Figure 61: Latin America VaaS Market Revenue Share (%), by Country 2024 & 2032
- Figure 62: Middle East and Africa VaaS Market Revenue (Million), by Platform 2024 & 2032
- Figure 63: Middle East and Africa VaaS Market Revenue Share (%), by Platform 2024 & 2032
- Figure 64: Middle East and Africa VaaS Market Revenue (Million), by Device 2024 & 2032
- Figure 65: Middle East and Africa VaaS Market Revenue Share (%), by Device 2024 & 2032
- Figure 66: Middle East and Africa VaaS Market Revenue (Million), by Service 2024 & 2032
- Figure 67: Middle East and Africa VaaS Market Revenue Share (%), by Service 2024 & 2032
- Figure 68: Middle East and Africa VaaS Market Revenue (Million), by Deployment Model 2024 & 2032
- Figure 69: Middle East and Africa VaaS Market Revenue Share (%), by Deployment Model 2024 & 2032
- Figure 70: Middle East and Africa VaaS Market Revenue (Million), by End-user Industry 2024 & 2032
- Figure 71: Middle East and Africa VaaS Market Revenue Share (%), by End-user Industry 2024 & 2032
- Figure 72: Middle East and Africa VaaS Market Revenue (Million), by Country 2024 & 2032
- Figure 73: Middle East and Africa VaaS Market Revenue Share (%), by Country 2024 & 2032
List of Tables
- Table 1: Global VaaS Market Revenue Million Forecast, by Region 2019 & 2032
- Table 2: Global VaaS Market Revenue Million Forecast, by Platform 2019 & 2032
- Table 3: Global VaaS Market Revenue Million Forecast, by Device 2019 & 2032
- Table 4: Global VaaS Market Revenue Million Forecast, by Service 2019 & 2032
- Table 5: Global VaaS Market Revenue Million Forecast, by Deployment Model 2019 & 2032
- Table 6: Global VaaS Market Revenue Million Forecast, by End-user Industry 2019 & 2032
- Table 7: Global VaaS Market Revenue Million Forecast, by Region 2019 & 2032
- Table 8: Global VaaS Market Revenue Million Forecast, by Country 2019 & 2032
- Table 9: United States VaaS Market Revenue (Million) Forecast, by Application 2019 & 2032
- Table 10: Canada VaaS Market Revenue (Million) Forecast, by Application 2019 & 2032
- Table 11: Mexico VaaS Market Revenue (Million) Forecast, by Application 2019 & 2032
- Table 12: Global VaaS Market Revenue Million Forecast, by Country 2019 & 2032
- Table 13: Germany VaaS Market Revenue (Million) Forecast, by Application 2019 & 2032
- Table 14: United Kingdom VaaS Market Revenue (Million) Forecast, by Application 2019 & 2032
- Table 15: France VaaS Market Revenue (Million) Forecast, by Application 2019 & 2032
- Table 16: Spain VaaS Market Revenue (Million) Forecast, by Application 2019 & 2032
- Table 17: Italy VaaS Market Revenue (Million) Forecast, by Application 2019 & 2032
- Table 18: Spain VaaS Market Revenue (Million) Forecast, by Application 2019 & 2032
- Table 19: Belgium VaaS Market Revenue (Million) Forecast, by Application 2019 & 2032
- Table 20: Netherland VaaS Market Revenue (Million) Forecast, by Application 2019 & 2032
- Table 21: Nordics VaaS Market Revenue (Million) Forecast, by Application 2019 & 2032
- Table 22: Rest of Europe VaaS Market Revenue (Million) Forecast, by Application 2019 & 2032
- Table 23: Global VaaS Market Revenue Million Forecast, by Country 2019 & 2032
- Table 24: China VaaS Market Revenue (Million) Forecast, by Application 2019 & 2032
- Table 25: Japan VaaS Market Revenue (Million) Forecast, by Application 2019 & 2032
- Table 26: India VaaS Market Revenue (Million) Forecast, by Application 2019 & 2032
- Table 27: South Korea VaaS Market Revenue (Million) Forecast, by Application 2019 & 2032
- Table 28: Southeast Asia VaaS Market Revenue (Million) Forecast, by Application 2019 & 2032
- Table 29: Australia VaaS Market Revenue (Million) Forecast, by Application 2019 & 2032
- Table 30: Indonesia VaaS Market Revenue (Million) Forecast, by Application 2019 & 2032
- Table 31: Phillipes VaaS Market Revenue (Million) Forecast, by Application 2019 & 2032
- Table 32: Singapore VaaS Market Revenue (Million) Forecast, by Application 2019 & 2032
- Table 33: Thailandc VaaS Market Revenue (Million) Forecast, by Application 2019 & 2032
- Table 34: Rest of Asia Pacific VaaS Market Revenue (Million) Forecast, by Application 2019 & 2032
- Table 35: Global VaaS Market Revenue Million Forecast, by Country 2019 & 2032
- Table 36: Brazil VaaS Market Revenue (Million) Forecast, by Application 2019 & 2032
- Table 37: Argentina VaaS Market Revenue (Million) Forecast, by Application 2019 & 2032
- Table 38: Peru VaaS Market Revenue (Million) Forecast, by Application 2019 & 2032
- Table 39: Chile VaaS Market Revenue (Million) Forecast, by Application 2019 & 2032
- Table 40: Colombia VaaS Market Revenue (Million) Forecast, by Application 2019 & 2032
- Table 41: Ecuador VaaS Market Revenue (Million) Forecast, by Application 2019 & 2032
- Table 42: Venezuela VaaS Market Revenue (Million) Forecast, by Application 2019 & 2032
- Table 43: Rest of South America VaaS Market Revenue (Million) Forecast, by Application 2019 & 2032
- Table 44: Global VaaS Market Revenue Million Forecast, by Country 2019 & 2032
- Table 45: United States VaaS Market Revenue (Million) Forecast, by Application 2019 & 2032
- Table 46: Canada VaaS Market Revenue (Million) Forecast, by Application 2019 & 2032
- Table 47: Mexico VaaS Market Revenue (Million) Forecast, by Application 2019 & 2032
- Table 48: Global VaaS Market Revenue Million Forecast, by Country 2019 & 2032
- Table 49: United Arab Emirates VaaS Market Revenue (Million) Forecast, by Application 2019 & 2032
- Table 50: Saudi Arabia VaaS Market Revenue (Million) Forecast, by Application 2019 & 2032
- Table 51: South Africa VaaS Market Revenue (Million) Forecast, by Application 2019 & 2032
- Table 52: Rest of Middle East and Africa VaaS Market Revenue (Million) Forecast, by Application 2019 & 2032
- Table 53: Global VaaS Market Revenue Million Forecast, by Platform 2019 & 2032
- Table 54: Global VaaS Market Revenue Million Forecast, by Device 2019 & 2032
- Table 55: Global VaaS Market Revenue Million Forecast, by Service 2019 & 2032
- Table 56: Global VaaS Market Revenue Million Forecast, by Deployment Model 2019 & 2032
- Table 57: Global VaaS Market Revenue Million Forecast, by End-user Industry 2019 & 2032
- Table 58: Global VaaS Market Revenue Million Forecast, by Country 2019 & 2032
- Table 59: Global VaaS Market Revenue Million Forecast, by Platform 2019 & 2032
- Table 60: Global VaaS Market Revenue Million Forecast, by Device 2019 & 2032
- Table 61: Global VaaS Market Revenue Million Forecast, by Service 2019 & 2032
- Table 62: Global VaaS Market Revenue Million Forecast, by Deployment Model 2019 & 2032
- Table 63: Global VaaS Market Revenue Million Forecast, by End-user Industry 2019 & 2032
- Table 64: Global VaaS Market Revenue Million Forecast, by Country 2019 & 2032
- Table 65: Global VaaS Market Revenue Million Forecast, by Platform 2019 & 2032
- Table 66: Global VaaS Market Revenue Million Forecast, by Device 2019 & 2032
- Table 67: Global VaaS Market Revenue Million Forecast, by Service 2019 & 2032
- Table 68: Global VaaS Market Revenue Million Forecast, by Deployment Model 2019 & 2032
- Table 69: Global VaaS Market Revenue Million Forecast, by End-user Industry 2019 & 2032
- Table 70: Global VaaS Market Revenue Million Forecast, by Country 2019 & 2032
- Table 71: Global VaaS Market Revenue Million Forecast, by Platform 2019 & 2032
- Table 72: Global VaaS Market Revenue Million Forecast, by Device 2019 & 2032
- Table 73: Global VaaS Market Revenue Million Forecast, by Service 2019 & 2032
- Table 74: Global VaaS Market Revenue Million Forecast, by Deployment Model 2019 & 2032
- Table 75: Global VaaS Market Revenue Million Forecast, by End-user Industry 2019 & 2032
- Table 76: Global VaaS Market Revenue Million Forecast, by Country 2019 & 2032
- Table 77: Global VaaS Market Revenue Million Forecast, by Platform 2019 & 2032
- Table 78: Global VaaS Market Revenue Million Forecast, by Device 2019 & 2032
- Table 79: Global VaaS Market Revenue Million Forecast, by Service 2019 & 2032
- Table 80: Global VaaS Market Revenue Million Forecast, by Deployment Model 2019 & 2032
- Table 81: Global VaaS Market Revenue Million Forecast, by End-user Industry 2019 & 2032
- Table 82: Global VaaS Market Revenue Million Forecast, by Country 2019 & 2032
Frequently Asked Questions
1. What is the projected Compound Annual Growth Rate (CAGR) of the VaaS Market?
The projected CAGR is approximately 14.80%.
2. Which companies are prominent players in the VaaS Market?
Key companies in the market include Interoute Communications Limited, Applied Global Technologies LLC, AVI-SPL Inc , Polycom Inc, Adobe Systems, Cisco Systems Inc, Avaya Inc, BlueJeans Network, Huawei Technologies Co Limited, Vidyo Inc.
3. What are the main segments of the VaaS Market?
The market segments include Platform, Device, Service, Deployment Model, End-user Industry.
4. Can you provide details about the market size?
The market size is estimated to be USD 6.62 Million as of 2022.
5. What are some drivers contributing to market growth?
Increasing Investment on Cloud-Based Video Services; Enabling Digital Workforce.
6. What are the notable trends driving market growth?
The Hybrid Cloud Segment is Anticipated to Drive the Market Demand.
7. Are there any restraints impacting market growth?
High Cost of Video Content Creation and Validity.
8. Can you provide examples of recent developments in the market?
November 2022: Tesla announced that a Tesla driver could use the Zoom app to make or receive video conversations in the vehicle. The Zoom call app would be directly accessed on Tesla's central touchscreen infotainment system. The software utilizes the in-car camera mounted on the rearview mirror.
9. What pricing options are available for accessing the report?
Pricing options include single-user, multi-user, and enterprise licenses priced at USD 4750, USD 5250, and USD 8750 respectively.
10. Is the market size provided in terms of value or volume?
The market size is provided in terms of value, measured in Million.
11. Are there any specific market keywords associated with the report?
Yes, the market keyword associated with the report is "VaaS Market," which aids in identifying and referencing the specific market segment covered.
12. How do I determine which pricing option suits my needs best?
The pricing options vary based on user requirements and access needs. Individual users may opt for single-user licenses, while businesses requiring broader access may choose multi-user or enterprise licenses for cost-effective access to the report.
13. Are there any additional resources or data provided in the VaaS Market report?
While the report offers comprehensive insights, it's advisable to review the specific contents or supplementary materials provided to ascertain if additional resources or data are available.
14. How can I stay updated on further developments or reports in the VaaS Market?
To stay informed about further developments, trends, and reports in the VaaS Market, consider subscribing to industry newsletters, following relevant companies and organizations, or regularly checking reputable industry news sources and publications.
Methodology
Step 1 - Identification of Relevant Samples Size from Population Database


Step 2 - Approaches for Defining Global Market Size (Value, Volume* & Price*)

Note*: In applicable scenarios
Step 3 - Data Sources
Primary Research
- Web Analytics
- Survey Reports
- Research Institute
- Latest Research Reports
- Opinion Leaders
Secondary Research
- Annual Reports
- White Paper
- Latest Press Release
- Industry Association
- Paid Database
- Investor Presentations

Step 4 - Data Triangulation
Involves using different sources of information in order to increase the validity of a study
These sources are likely to be stakeholders in a program - participants, other researchers, program staff, other community members, and so on.
Then we put all data in single framework & apply various statistical tools to find out the dynamic on the market.
During the analysis stage, feedback from the stakeholder groups would be compared to determine areas of agreement as well as areas of divergence


