
Key Insights
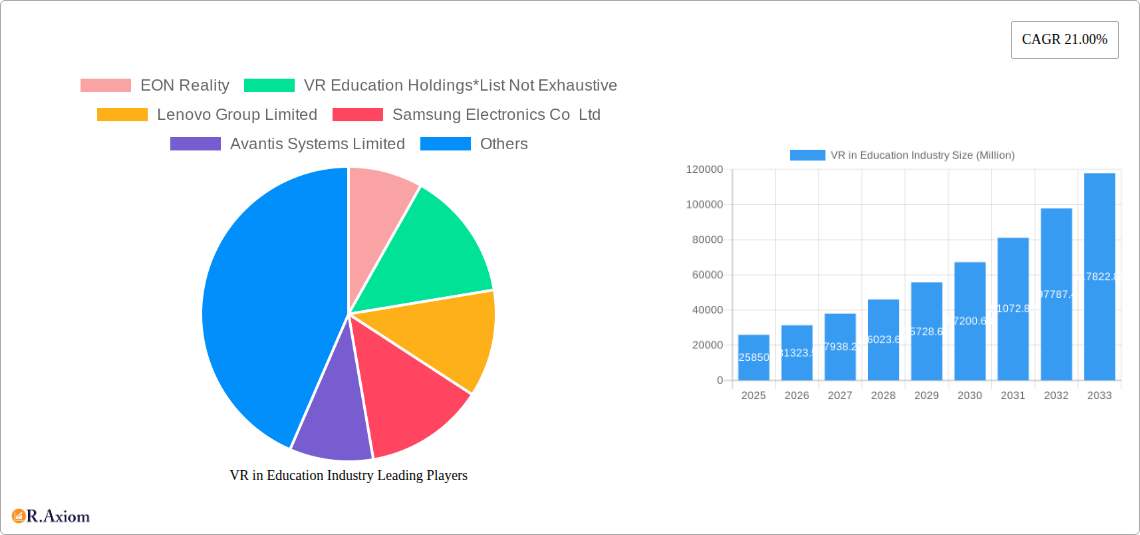
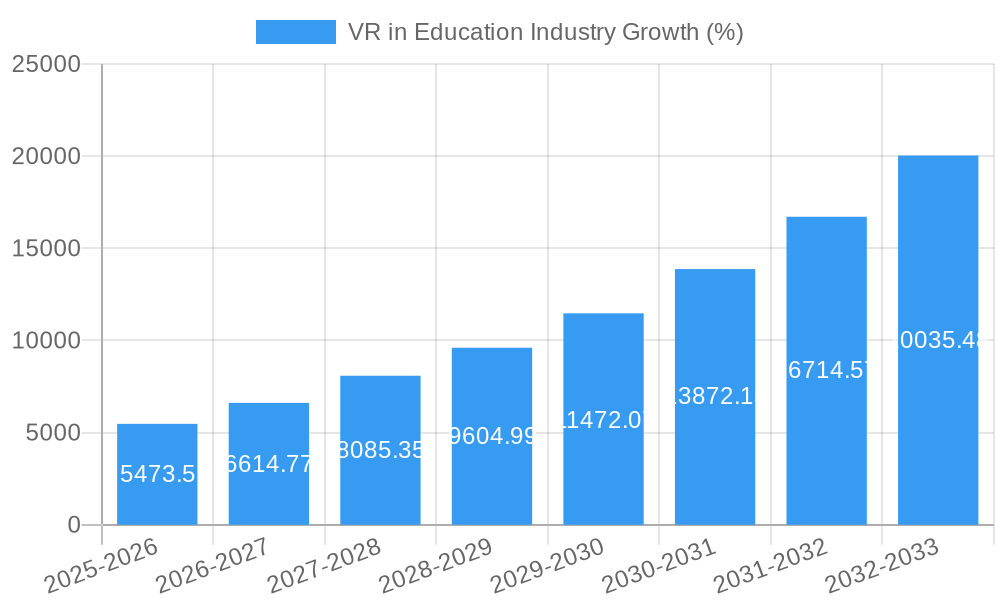
The VR in Education market is experiencing explosive growth, projected to reach \$25.85 billion in 2025 and exhibiting a remarkable Compound Annual Growth Rate (CAGR) of 21.00%. This expansion is fueled by several key drivers. Firstly, the increasing adoption of immersive technologies by educational institutions—from K-12 schools to higher education and corporate training programs—is significantly boosting market demand. Secondly, the proven effectiveness of VR in enhancing engagement, knowledge retention, and practical skill development across diverse subjects is driving investment and wider implementation. This is further supported by advancements in VR hardware and software, leading to more affordable, accessible, and user-friendly solutions. The development of specialized educational VR content and platforms, including comprehensive training and consulting services, further contributes to market growth.
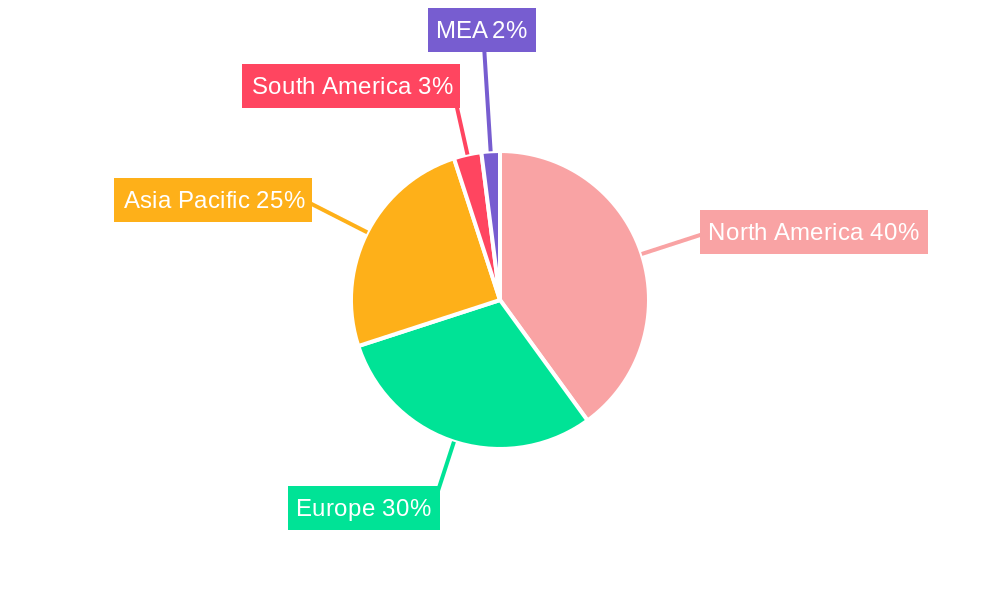
However, despite the rapid growth, the market faces certain challenges. Initial high costs associated with VR hardware and software can present a barrier to entry for smaller educational institutions, particularly in developing regions. Furthermore, the need for robust internet infrastructure and skilled educators trained in effectively integrating VR into the curriculum represents a crucial consideration. Nevertheless, ongoing technological advancements, decreasing hardware costs, and increasing government and private sector investment in educational technology are expected to alleviate these restraints and ensure continued, albeit perhaps slightly moderated, market expansion in the coming years. The market is segmented by hardware, software, and services (training & consulting, managed services), and by end-user (academic institutions, higher education, corporate training), with North America and Asia-Pacific currently representing the largest regional markets. Companies like EON Reality, VR Education Holdings, Lenovo, and Meta Platforms are leading the charge in innovation and market penetration.
VR in Education Industry: A Comprehensive Market Report (2019-2033)
This comprehensive report provides an in-depth analysis of the Virtual Reality (VR) in Education industry, projecting a market value of $XX Million by 2033. The study covers the period 2019-2033, with 2025 as the base and estimated year. The report offers actionable insights for industry stakeholders, including market sizing, segmentation analysis, competitive landscape, technological advancements, and future growth prospects. This report is crucial for investors, educational institutions, technology providers, and policymakers seeking to understand and capitalize on the transformative potential of VR in education.
VR in Education Industry Market Concentration & Innovation
The VR in Education market exhibits a moderately concentrated landscape, with key players like EON Reality, VR Education Holdings, Lenovo Group Limited, Samsung Electronics Co Ltd, Avantis Systems Limited, Virtalis Holdings Limited, and Unity Teach holding significant market share. However, the market is also witnessing the emergence of several smaller, innovative companies. Market share data for 2024 suggests that the top 5 players collectively hold approximately 40% of the market, indicating a relatively fragmented landscape ripe for further consolidation. M&A activity is on the rise, with deals valued at $XX Million in 2024 alone, driven by the desire to acquire innovative technologies and expand market reach. Innovation is primarily fueled by advancements in VR hardware (higher resolution displays, improved ergonomics), software (more intuitive interfaces, immersive learning experiences), and the development of tailored educational content. Regulatory frameworks, while still evolving, are generally supportive of VR adoption in education, focusing on data privacy and accessibility. The primary product substitutes are traditional teaching methods and augmented reality (AR) solutions, but VR’s immersive capabilities offer a unique advantage. End-user trends reveal a growing preference for interactive and engaging learning experiences, driving demand for VR solutions across all educational levels.
VR in Education Industry Industry Trends & Insights
The VR in Education market is experiencing rapid growth, with a projected Compound Annual Growth Rate (CAGR) of XX% from 2025 to 2033. This growth is driven by several factors including increasing investment in educational technology, growing demand for immersive learning experiences, advancements in VR technology, and the increasing affordability of VR hardware. Market penetration is rising steadily, particularly in higher education and corporate training segments. Technological disruptions, such as the development of more powerful and affordable VR headsets and improved haptic feedback systems, are further fueling market expansion. Consumer preferences indicate a strong demand for engaging, interactive, and personalized learning experiences, which VR uniquely provides. Competitive dynamics are characterized by a combination of established players and emerging startups, leading to innovation and improved offerings. The market is also witnessing a shift towards cloud-based VR solutions, offering scalability and cost-effectiveness for educational institutions. By 2033, market penetration is expected to reach XX%, with the majority of growth emanating from developing economies adopting VR technology at an accelerated rate.
Dominant Markets & Segments in VR in Education Industry
Leading Region/Country: North America currently dominates the market due to early adoption, strong technological infrastructure, and significant investment in EdTech. However, Asia-Pacific is projected to exhibit the fastest growth rate due to expanding digital infrastructure and increasing government support for educational technology.
Dominant Segments:
- Type: Software currently holds the largest market share, driven by the increasing availability of high-quality VR educational content. However, Hardware is expected to grow significantly driven by improving affordability and performance. Services (Training, Consulting, and Managed Services) are also gaining traction as institutions seek expertise in implementing and maintaining VR systems.
- End User: Higher Education and Corporate Training segments are currently the largest contributors to market revenue due to higher budgets and a greater willingness to adopt new technologies. However, the Academic Institutions segment is poised for significant growth as VR solutions become more accessible and affordable.
Key drivers for North America's dominance include robust funding for educational initiatives, a developed technological infrastructure, and the presence of major VR technology providers. The rapid expansion of the Asia-Pacific market is attributed to rising government investments in educational technology, increasing smartphone penetration, and a growing emphasis on digital literacy.
VR in Education Industry Product Developments
Recent product innovations focus on enhancing immersion, interaction, and accessibility. New VR headsets offer improved resolution, wider fields of view, and enhanced comfort. Software platforms are incorporating more advanced features such as haptic feedback, collaborative learning environments, and personalized learning pathways. The competitive advantage lies in creating engaging, effective, and easily accessible VR learning experiences tailored to specific educational needs. Technological trends suggest a move towards more affordable, portable, and user-friendly VR systems, along with a focus on integrating VR with other educational technologies like AR and AI. Market fit is improving as educators become more familiar with the pedagogical benefits of VR.
Report Scope & Segmentation Analysis
This report segments the VR in Education market by Type (Hardware, Software, Services), and End User (Academic Institutions, Higher Education, Corporate Training). Each segment is analyzed based on its growth projections, market size, and competitive dynamics. The Hardware segment includes VR headsets, sensors, and other related devices. The Software segment encompasses educational VR applications, platforms, and content creation tools. Services cover training, consulting, and managed services related to VR integration and support within educational institutions and businesses. The End-User segmentation reflects the diverse applications of VR in education, from K-12 classrooms to university lectures and corporate training programs. Growth projections for each segment vary, with Software and Services expected to show particularly strong growth due to the increasing demand for high-quality content and expertise in VR implementation.
Key Drivers of VR in Education Industry Growth
Several factors are driving the growth of the VR in Education industry. Technological advancements, such as the development of more affordable and user-friendly VR headsets and software, are making VR more accessible to educational institutions. Increased government funding and initiatives promoting EdTech are also stimulating market growth. Furthermore, the growing recognition of the pedagogical benefits of VR, its ability to create engaging and immersive learning experiences, is propelling wider adoption across all educational levels. Finally, the rising demand for skill development in various industries, particularly those requiring specialized training, is further enhancing the appeal of VR for corporate training purposes.
Challenges in the VR in Education Industry Sector
The VR in Education sector faces several challenges. High initial investment costs for VR hardware and software can be a barrier for many educational institutions, particularly those with limited budgets. The need for high-quality, engaging, and pedagogically sound educational VR content remains a significant hurdle. Furthermore, technical issues such as motion sickness and the lack of robust technical support can hinder the effective implementation of VR in educational settings. The lack of standardized educational VR content and the absence of well-defined pedagogical frameworks for VR integration present challenges to widespread adoption. Competition from other educational technologies and the need for skilled personnel to manage and maintain VR systems also pose constraints.
Emerging Opportunities in VR in Education Industry
The VR in Education industry presents numerous emerging opportunities. The increasing integration of VR with other technologies like AR and AI promises to create even more immersive and personalized learning experiences. The expansion of VR applications into new areas such as STEM education, vocational training, and special education offers significant growth potential. The development of cloud-based VR solutions improves accessibility and cost-effectiveness for schools and institutions. Finally, the increasing availability of affordable and user-friendly VR hardware is driving wider adoption and creating new market opportunities.
Leading Players in the VR in Education Industry Market
- EON Reality
- VR Education Holdings
- Lenovo Group Limited
- Samsung Electronics Co Ltd
- Avantis Systems Limited
- Virtalis Holdings Limited
- Unity Teach
- Microsoft Corporation
- zSpace Inc
- Nearpod Inc
- Veative Labs
- Alchemy VR Limited
- Meta Platforms Inc
- HTC Corporation
Key Developments in VR in Education Industry Industry
October 2022: Jolly Good Inc. and Juntendo University launch a demonstration project in Thailand using VR for medical education at Royal Mahidol University, focusing on infectious disease treatment. This signals a growing focus on using VR for specialized training in emerging markets.
May 2022: XR Immersive Tech Inc.'s Synthesis VR Inc. partners with VictoryXR to expand the reach of VR educational content to LBVR operators worldwide. This showcases the increasing collaboration within the industry to deliver content to a broader audience.
Strategic Outlook for VR in Education Industry Market
The VR in Education market is poised for significant growth over the next decade, driven by technological advancements, increasing demand for immersive learning experiences, and supportive regulatory environments. The continued development of high-quality educational VR content, along with increased affordability and accessibility of VR hardware, will be key to unlocking the full potential of VR in transforming the education landscape. Strategic partnerships between technology providers, educational institutions, and content creators will be critical to fostering innovation and achieving widespread adoption. The market is expected to witness increased consolidation through mergers and acquisitions as larger players seek to expand their market share and product offerings.
VR in Education Industry Segmentation
-
1. Type
- 1.1. Hardware
- 1.2. Software
- 1.3. Services
-
2. End User
-
2.1. Academic Institutions
- 2.1.1. K-12 Learning
- 2.1.2. Higher Education
-
2.2. Corporate Training
- 2.2.1. IT and Telecom
- 2.2.2. Healthcare
- 2.2.3. Retail and E-commerce
- 2.2.4. Other End users
-
2.1. Academic Institutions
VR in Education Industry Segmentation By Geography
- 1. North America
- 2. Europe
- 3. Asia Pacific
- 4. Rest of the World
VR in Education Industry REPORT HIGHLIGHTS
| Aspects | Details |
|---|---|
| Study Period | 2019-2033 |
| Base Year | 2024 |
| Estimated Year | 2025 |
| Forecast Period | 2025-2033 |
| Historical Period | 2019-2024 |
| Growth Rate | CAGR of 21.00% from 2019-2033 |
| Segmentation |
|
Table of Contents
- 1. Introduction
- 1.1. Research Scope
- 1.2. Market Segmentation
- 1.3. Research Methodology
- 1.4. Definitions and Assumptions
- 2. Executive Summary
- 2.1. Introduction
- 3. Market Dynamics
- 3.1. Introduction
- 3.2. Market Drivers
- 3.2.1. Increasing demand for interactive and personalized learning experience; Higher acceptance among stakeholders owing to higher engagement and scope for blended learning technology; VR-based technology benefits from being the first entrant in the education & corporate category; The role of education and training among corporates has transformed with the growth in digital engagement and compelling content
- 3.3. Market Restrains
- 3.3.1 Limited content and cost efficiency of consumer-grade applications; Dependence on external factors
- 3.3.2 such as bandwidth and network
- 3.3.3 for ensuring optimal experience
- 3.4. Market Trends
- 3.4.1. Increasing Demand For Interactive and Personalized Learning Experience
- 4. Market Factor Analysis
- 4.1. Porters Five Forces
- 4.2. Supply/Value Chain
- 4.3. PESTEL analysis
- 4.4. Market Entropy
- 4.5. Patent/Trademark Analysis
- 5. Global VR in Education Industry Analysis, Insights and Forecast, 2019-2031
- 5.1. Market Analysis, Insights and Forecast - by Type
- 5.1.1. Hardware
- 5.1.2. Software
- 5.1.3. Services
- 5.2. Market Analysis, Insights and Forecast - by End User
- 5.2.1. Academic Institutions
- 5.2.1.1. K-12 Learning
- 5.2.1.2. Higher Education
- 5.2.2. Corporate Training
- 5.2.2.1. IT and Telecom
- 5.2.2.2. Healthcare
- 5.2.2.3. Retail and E-commerce
- 5.2.2.4. Other End users
- 5.2.1. Academic Institutions
- 5.3. Market Analysis, Insights and Forecast - by Region
- 5.3.1. North America
- 5.3.2. Europe
- 5.3.3. Asia Pacific
- 5.3.4. Rest of the World
- 5.1. Market Analysis, Insights and Forecast - by Type
- 6. North America VR in Education Industry Analysis, Insights and Forecast, 2019-2031
- 6.1. Market Analysis, Insights and Forecast - by Type
- 6.1.1. Hardware
- 6.1.2. Software
- 6.1.3. Services
- 6.2. Market Analysis, Insights and Forecast - by End User
- 6.2.1. Academic Institutions
- 6.2.1.1. K-12 Learning
- 6.2.1.2. Higher Education
- 6.2.2. Corporate Training
- 6.2.2.1. IT and Telecom
- 6.2.2.2. Healthcare
- 6.2.2.3. Retail and E-commerce
- 6.2.2.4. Other End users
- 6.2.1. Academic Institutions
- 6.1. Market Analysis, Insights and Forecast - by Type
- 7. Europe VR in Education Industry Analysis, Insights and Forecast, 2019-2031
- 7.1. Market Analysis, Insights and Forecast - by Type
- 7.1.1. Hardware
- 7.1.2. Software
- 7.1.3. Services
- 7.2. Market Analysis, Insights and Forecast - by End User
- 7.2.1. Academic Institutions
- 7.2.1.1. K-12 Learning
- 7.2.1.2. Higher Education
- 7.2.2. Corporate Training
- 7.2.2.1. IT and Telecom
- 7.2.2.2. Healthcare
- 7.2.2.3. Retail and E-commerce
- 7.2.2.4. Other End users
- 7.2.1. Academic Institutions
- 7.1. Market Analysis, Insights and Forecast - by Type
- 8. Asia Pacific VR in Education Industry Analysis, Insights and Forecast, 2019-2031
- 8.1. Market Analysis, Insights and Forecast - by Type
- 8.1.1. Hardware
- 8.1.2. Software
- 8.1.3. Services
- 8.2. Market Analysis, Insights and Forecast - by End User
- 8.2.1. Academic Institutions
- 8.2.1.1. K-12 Learning
- 8.2.1.2. Higher Education
- 8.2.2. Corporate Training
- 8.2.2.1. IT and Telecom
- 8.2.2.2. Healthcare
- 8.2.2.3. Retail and E-commerce
- 8.2.2.4. Other End users
- 8.2.1. Academic Institutions
- 8.1. Market Analysis, Insights and Forecast - by Type
- 9. Rest of the World VR in Education Industry Analysis, Insights and Forecast, 2019-2031
- 9.1. Market Analysis, Insights and Forecast - by Type
- 9.1.1. Hardware
- 9.1.2. Software
- 9.1.3. Services
- 9.2. Market Analysis, Insights and Forecast - by End User
- 9.2.1. Academic Institutions
- 9.2.1.1. K-12 Learning
- 9.2.1.2. Higher Education
- 9.2.2. Corporate Training
- 9.2.2.1. IT and Telecom
- 9.2.2.2. Healthcare
- 9.2.2.3. Retail and E-commerce
- 9.2.2.4. Other End users
- 9.2.1. Academic Institutions
- 9.1. Market Analysis, Insights and Forecast - by Type
- 10. North America VR in Education Industry Analysis, Insights and Forecast, 2019-2031
- 10.1. Market Analysis, Insights and Forecast - By Country/Sub-region
- 10.1.1 United States
- 10.1.2 Canada
- 10.1.3 Mexico
- 11. Europe VR in Education Industry Analysis, Insights and Forecast, 2019-2031
- 11.1. Market Analysis, Insights and Forecast - By Country/Sub-region
- 11.1.1 Germany
- 11.1.2 United Kingdom
- 11.1.3 France
- 11.1.4 Spain
- 11.1.5 Italy
- 11.1.6 Spain
- 11.1.7 Belgium
- 11.1.8 Netherland
- 11.1.9 Nordics
- 11.1.10 Rest of Europe
- 12. Asia Pacific VR in Education Industry Analysis, Insights and Forecast, 2019-2031
- 12.1. Market Analysis, Insights and Forecast - By Country/Sub-region
- 12.1.1 China
- 12.1.2 Japan
- 12.1.3 India
- 12.1.4 South Korea
- 12.1.5 Southeast Asia
- 12.1.6 Australia
- 12.1.7 Indonesia
- 12.1.8 Phillipes
- 12.1.9 Singapore
- 12.1.10 Thailandc
- 12.1.11 Rest of Asia Pacific
- 13. South America VR in Education Industry Analysis, Insights and Forecast, 2019-2031
- 13.1. Market Analysis, Insights and Forecast - By Country/Sub-region
- 13.1.1 Brazil
- 13.1.2 Argentina
- 13.1.3 Peru
- 13.1.4 Chile
- 13.1.5 Colombia
- 13.1.6 Ecuador
- 13.1.7 Venezuela
- 13.1.8 Rest of South America
- 14. North America VR in Education Industry Analysis, Insights and Forecast, 2019-2031
- 14.1. Market Analysis, Insights and Forecast - By Country/Sub-region
- 14.1.1 United States
- 14.1.2 Canada
- 14.1.3 Mexico
- 15. MEA VR in Education Industry Analysis, Insights and Forecast, 2019-2031
- 15.1. Market Analysis, Insights and Forecast - By Country/Sub-region
- 15.1.1 United Arab Emirates
- 15.1.2 Saudi Arabia
- 15.1.3 South Africa
- 15.1.4 Rest of Middle East and Africa
- 16. Competitive Analysis
- 16.1. Global Market Share Analysis 2024
- 16.2. Company Profiles
- 16.2.1 EON Reality
- 16.2.1.1. Overview
- 16.2.1.2. Products
- 16.2.1.3. SWOT Analysis
- 16.2.1.4. Recent Developments
- 16.2.1.5. Financials (Based on Availability)
- 16.2.2 VR Education Holdings*List Not Exhaustive
- 16.2.2.1. Overview
- 16.2.2.2. Products
- 16.2.2.3. SWOT Analysis
- 16.2.2.4. Recent Developments
- 16.2.2.5. Financials (Based on Availability)
- 16.2.3 Lenovo Group Limited
- 16.2.3.1. Overview
- 16.2.3.2. Products
- 16.2.3.3. SWOT Analysis
- 16.2.3.4. Recent Developments
- 16.2.3.5. Financials (Based on Availability)
- 16.2.4 Samsung Electronics Co Ltd
- 16.2.4.1. Overview
- 16.2.4.2. Products
- 16.2.4.3. SWOT Analysis
- 16.2.4.4. Recent Developments
- 16.2.4.5. Financials (Based on Availability)
- 16.2.5 Avantis Systems Limited
- 16.2.5.1. Overview
- 16.2.5.2. Products
- 16.2.5.3. SWOT Analysis
- 16.2.5.4. Recent Developments
- 16.2.5.5. Financials (Based on Availability)
- 16.2.6 Virtalis Holdings Limited
- 16.2.6.1. Overview
- 16.2.6.2. Products
- 16.2.6.3. SWOT Analysis
- 16.2.6.4. Recent Developments
- 16.2.6.5. Financials (Based on Availability)
- 16.2.7 Unity Teach
- 16.2.7.1. Overview
- 16.2.7.2. Products
- 16.2.7.3. SWOT Analysis
- 16.2.7.4. Recent Developments
- 16.2.7.5. Financials (Based on Availability)
- 16.2.8 Microsoft Corporation
- 16.2.8.1. Overview
- 16.2.8.2. Products
- 16.2.8.3. SWOT Analysis
- 16.2.8.4. Recent Developments
- 16.2.8.5. Financials (Based on Availability)
- 16.2.9 zSpace Inc
- 16.2.9.1. Overview
- 16.2.9.2. Products
- 16.2.9.3. SWOT Analysis
- 16.2.9.4. Recent Developments
- 16.2.9.5. Financials (Based on Availability)
- 16.2.10 Nearpod Inc
- 16.2.10.1. Overview
- 16.2.10.2. Products
- 16.2.10.3. SWOT Analysis
- 16.2.10.4. Recent Developments
- 16.2.10.5. Financials (Based on Availability)
- 16.2.11 Veative Labs
- 16.2.11.1. Overview
- 16.2.11.2. Products
- 16.2.11.3. SWOT Analysis
- 16.2.11.4. Recent Developments
- 16.2.11.5. Financials (Based on Availability)
- 16.2.12 Alchemy VR Limited
- 16.2.12.1. Overview
- 16.2.12.2. Products
- 16.2.12.3. SWOT Analysis
- 16.2.12.4. Recent Developments
- 16.2.12.5. Financials (Based on Availability)
- 16.2.13 Meta Platforms Inc
- 16.2.13.1. Overview
- 16.2.13.2. Products
- 16.2.13.3. SWOT Analysis
- 16.2.13.4. Recent Developments
- 16.2.13.5. Financials (Based on Availability)
- 16.2.14 HTC Corporation
- 16.2.14.1. Overview
- 16.2.14.2. Products
- 16.2.14.3. SWOT Analysis
- 16.2.14.4. Recent Developments
- 16.2.14.5. Financials (Based on Availability)
- 16.2.1 EON Reality
List of Figures
- Figure 1: Global VR in Education Industry Revenue Breakdown (Million, %) by Region 2024 & 2032
- Figure 2: North America VR in Education Industry Revenue (Million), by Country 2024 & 2032
- Figure 3: North America VR in Education Industry Revenue Share (%), by Country 2024 & 2032
- Figure 4: Europe VR in Education Industry Revenue (Million), by Country 2024 & 2032
- Figure 5: Europe VR in Education Industry Revenue Share (%), by Country 2024 & 2032
- Figure 6: Asia Pacific VR in Education Industry Revenue (Million), by Country 2024 & 2032
- Figure 7: Asia Pacific VR in Education Industry Revenue Share (%), by Country 2024 & 2032
- Figure 8: South America VR in Education Industry Revenue (Million), by Country 2024 & 2032
- Figure 9: South America VR in Education Industry Revenue Share (%), by Country 2024 & 2032
- Figure 10: North America VR in Education Industry Revenue (Million), by Country 2024 & 2032
- Figure 11: North America VR in Education Industry Revenue Share (%), by Country 2024 & 2032
- Figure 12: MEA VR in Education Industry Revenue (Million), by Country 2024 & 2032
- Figure 13: MEA VR in Education Industry Revenue Share (%), by Country 2024 & 2032
- Figure 14: North America VR in Education Industry Revenue (Million), by Type 2024 & 2032
- Figure 15: North America VR in Education Industry Revenue Share (%), by Type 2024 & 2032
- Figure 16: North America VR in Education Industry Revenue (Million), by End User 2024 & 2032
- Figure 17: North America VR in Education Industry Revenue Share (%), by End User 2024 & 2032
- Figure 18: North America VR in Education Industry Revenue (Million), by Country 2024 & 2032
- Figure 19: North America VR in Education Industry Revenue Share (%), by Country 2024 & 2032
- Figure 20: Europe VR in Education Industry Revenue (Million), by Type 2024 & 2032
- Figure 21: Europe VR in Education Industry Revenue Share (%), by Type 2024 & 2032
- Figure 22: Europe VR in Education Industry Revenue (Million), by End User 2024 & 2032
- Figure 23: Europe VR in Education Industry Revenue Share (%), by End User 2024 & 2032
- Figure 24: Europe VR in Education Industry Revenue (Million), by Country 2024 & 2032
- Figure 25: Europe VR in Education Industry Revenue Share (%), by Country 2024 & 2032
- Figure 26: Asia Pacific VR in Education Industry Revenue (Million), by Type 2024 & 2032
- Figure 27: Asia Pacific VR in Education Industry Revenue Share (%), by Type 2024 & 2032
- Figure 28: Asia Pacific VR in Education Industry Revenue (Million), by End User 2024 & 2032
- Figure 29: Asia Pacific VR in Education Industry Revenue Share (%), by End User 2024 & 2032
- Figure 30: Asia Pacific VR in Education Industry Revenue (Million), by Country 2024 & 2032
- Figure 31: Asia Pacific VR in Education Industry Revenue Share (%), by Country 2024 & 2032
- Figure 32: Rest of the World VR in Education Industry Revenue (Million), by Type 2024 & 2032
- Figure 33: Rest of the World VR in Education Industry Revenue Share (%), by Type 2024 & 2032
- Figure 34: Rest of the World VR in Education Industry Revenue (Million), by End User 2024 & 2032
- Figure 35: Rest of the World VR in Education Industry Revenue Share (%), by End User 2024 & 2032
- Figure 36: Rest of the World VR in Education Industry Revenue (Million), by Country 2024 & 2032
- Figure 37: Rest of the World VR in Education Industry Revenue Share (%), by Country 2024 & 2032
List of Tables
- Table 1: Global VR in Education Industry Revenue Million Forecast, by Region 2019 & 2032
- Table 2: Global VR in Education Industry Revenue Million Forecast, by Type 2019 & 2032
- Table 3: Global VR in Education Industry Revenue Million Forecast, by End User 2019 & 2032
- Table 4: Global VR in Education Industry Revenue Million Forecast, by Region 2019 & 2032
- Table 5: Global VR in Education Industry Revenue Million Forecast, by Country 2019 & 2032
- Table 6: United States VR in Education Industry Revenue (Million) Forecast, by Application 2019 & 2032
- Table 7: Canada VR in Education Industry Revenue (Million) Forecast, by Application 2019 & 2032
- Table 8: Mexico VR in Education Industry Revenue (Million) Forecast, by Application 2019 & 2032
- Table 9: Global VR in Education Industry Revenue Million Forecast, by Country 2019 & 2032
- Table 10: Germany VR in Education Industry Revenue (Million) Forecast, by Application 2019 & 2032
- Table 11: United Kingdom VR in Education Industry Revenue (Million) Forecast, by Application 2019 & 2032
- Table 12: France VR in Education Industry Revenue (Million) Forecast, by Application 2019 & 2032
- Table 13: Spain VR in Education Industry Revenue (Million) Forecast, by Application 2019 & 2032
- Table 14: Italy VR in Education Industry Revenue (Million) Forecast, by Application 2019 & 2032
- Table 15: Spain VR in Education Industry Revenue (Million) Forecast, by Application 2019 & 2032
- Table 16: Belgium VR in Education Industry Revenue (Million) Forecast, by Application 2019 & 2032
- Table 17: Netherland VR in Education Industry Revenue (Million) Forecast, by Application 2019 & 2032
- Table 18: Nordics VR in Education Industry Revenue (Million) Forecast, by Application 2019 & 2032
- Table 19: Rest of Europe VR in Education Industry Revenue (Million) Forecast, by Application 2019 & 2032
- Table 20: Global VR in Education Industry Revenue Million Forecast, by Country 2019 & 2032
- Table 21: China VR in Education Industry Revenue (Million) Forecast, by Application 2019 & 2032
- Table 22: Japan VR in Education Industry Revenue (Million) Forecast, by Application 2019 & 2032
- Table 23: India VR in Education Industry Revenue (Million) Forecast, by Application 2019 & 2032
- Table 24: South Korea VR in Education Industry Revenue (Million) Forecast, by Application 2019 & 2032
- Table 25: Southeast Asia VR in Education Industry Revenue (Million) Forecast, by Application 2019 & 2032
- Table 26: Australia VR in Education Industry Revenue (Million) Forecast, by Application 2019 & 2032
- Table 27: Indonesia VR in Education Industry Revenue (Million) Forecast, by Application 2019 & 2032
- Table 28: Phillipes VR in Education Industry Revenue (Million) Forecast, by Application 2019 & 2032
- Table 29: Singapore VR in Education Industry Revenue (Million) Forecast, by Application 2019 & 2032
- Table 30: Thailandc VR in Education Industry Revenue (Million) Forecast, by Application 2019 & 2032
- Table 31: Rest of Asia Pacific VR in Education Industry Revenue (Million) Forecast, by Application 2019 & 2032
- Table 32: Global VR in Education Industry Revenue Million Forecast, by Country 2019 & 2032
- Table 33: Brazil VR in Education Industry Revenue (Million) Forecast, by Application 2019 & 2032
- Table 34: Argentina VR in Education Industry Revenue (Million) Forecast, by Application 2019 & 2032
- Table 35: Peru VR in Education Industry Revenue (Million) Forecast, by Application 2019 & 2032
- Table 36: Chile VR in Education Industry Revenue (Million) Forecast, by Application 2019 & 2032
- Table 37: Colombia VR in Education Industry Revenue (Million) Forecast, by Application 2019 & 2032
- Table 38: Ecuador VR in Education Industry Revenue (Million) Forecast, by Application 2019 & 2032
- Table 39: Venezuela VR in Education Industry Revenue (Million) Forecast, by Application 2019 & 2032
- Table 40: Rest of South America VR in Education Industry Revenue (Million) Forecast, by Application 2019 & 2032
- Table 41: Global VR in Education Industry Revenue Million Forecast, by Country 2019 & 2032
- Table 42: United States VR in Education Industry Revenue (Million) Forecast, by Application 2019 & 2032
- Table 43: Canada VR in Education Industry Revenue (Million) Forecast, by Application 2019 & 2032
- Table 44: Mexico VR in Education Industry Revenue (Million) Forecast, by Application 2019 & 2032
- Table 45: Global VR in Education Industry Revenue Million Forecast, by Country 2019 & 2032
- Table 46: United Arab Emirates VR in Education Industry Revenue (Million) Forecast, by Application 2019 & 2032
- Table 47: Saudi Arabia VR in Education Industry Revenue (Million) Forecast, by Application 2019 & 2032
- Table 48: South Africa VR in Education Industry Revenue (Million) Forecast, by Application 2019 & 2032
- Table 49: Rest of Middle East and Africa VR in Education Industry Revenue (Million) Forecast, by Application 2019 & 2032
- Table 50: Global VR in Education Industry Revenue Million Forecast, by Type 2019 & 2032
- Table 51: Global VR in Education Industry Revenue Million Forecast, by End User 2019 & 2032
- Table 52: Global VR in Education Industry Revenue Million Forecast, by Country 2019 & 2032
- Table 53: Global VR in Education Industry Revenue Million Forecast, by Type 2019 & 2032
- Table 54: Global VR in Education Industry Revenue Million Forecast, by End User 2019 & 2032
- Table 55: Global VR in Education Industry Revenue Million Forecast, by Country 2019 & 2032
- Table 56: Global VR in Education Industry Revenue Million Forecast, by Type 2019 & 2032
- Table 57: Global VR in Education Industry Revenue Million Forecast, by End User 2019 & 2032
- Table 58: Global VR in Education Industry Revenue Million Forecast, by Country 2019 & 2032
- Table 59: Global VR in Education Industry Revenue Million Forecast, by Type 2019 & 2032
- Table 60: Global VR in Education Industry Revenue Million Forecast, by End User 2019 & 2032
- Table 61: Global VR in Education Industry Revenue Million Forecast, by Country 2019 & 2032
Frequently Asked Questions
1. What is the projected Compound Annual Growth Rate (CAGR) of the VR in Education Industry?
The projected CAGR is approximately 21.00%.
2. Which companies are prominent players in the VR in Education Industry?
Key companies in the market include EON Reality, VR Education Holdings*List Not Exhaustive, Lenovo Group Limited, Samsung Electronics Co Ltd, Avantis Systems Limited, Virtalis Holdings Limited, Unity Teach, Microsoft Corporation, zSpace Inc, Nearpod Inc, Veative Labs, Alchemy VR Limited, Meta Platforms Inc, HTC Corporation.
3. What are the main segments of the VR in Education Industry?
The market segments include Type, End User.
4. Can you provide details about the market size?
The market size is estimated to be USD 25.85 Million as of 2022.
5. What are some drivers contributing to market growth?
Increasing demand for interactive and personalized learning experience; Higher acceptance among stakeholders owing to higher engagement and scope for blended learning technology; VR-based technology benefits from being the first entrant in the education & corporate category; The role of education and training among corporates has transformed with the growth in digital engagement and compelling content.
6. What are the notable trends driving market growth?
Increasing Demand For Interactive and Personalized Learning Experience.
7. Are there any restraints impacting market growth?
Limited content and cost efficiency of consumer-grade applications; Dependence on external factors. such as bandwidth and network. for ensuring optimal experience.
8. Can you provide examples of recent developments in the market?
October 2022: Japanese startup Jolly Good Inc., in partnership with Juntendo University, will commence a demonstration project to introduce medical education with virtual reality (VR) and develop human medical resources through VR at Royal Mahidol University and throughout Thailand. The company will provide Mahidol University with VR teaching material production facilities and VR experience equipment to create an environment that enables the self-production of VR teaching materials for infectious disease treatment education at the university.
9. What pricing options are available for accessing the report?
Pricing options include single-user, multi-user, and enterprise licenses priced at USD 4750, USD 5250, and USD 8750 respectively.
10. Is the market size provided in terms of value or volume?
The market size is provided in terms of value, measured in Million.
11. Are there any specific market keywords associated with the report?
Yes, the market keyword associated with the report is "VR in Education Industry," which aids in identifying and referencing the specific market segment covered.
12. How do I determine which pricing option suits my needs best?
The pricing options vary based on user requirements and access needs. Individual users may opt for single-user licenses, while businesses requiring broader access may choose multi-user or enterprise licenses for cost-effective access to the report.
13. Are there any additional resources or data provided in the VR in Education Industry report?
While the report offers comprehensive insights, it's advisable to review the specific contents or supplementary materials provided to ascertain if additional resources or data are available.
14. How can I stay updated on further developments or reports in the VR in Education Industry?
To stay informed about further developments, trends, and reports in the VR in Education Industry, consider subscribing to industry newsletters, following relevant companies and organizations, or regularly checking reputable industry news sources and publications.
Methodology
Step 1 - Identification of Relevant Samples Size from Population Database


Step 2 - Approaches for Defining Global Market Size (Value, Volume* & Price*)

Note*: In applicable scenarios
Step 3 - Data Sources
Primary Research
- Web Analytics
- Survey Reports
- Research Institute
- Latest Research Reports
- Opinion Leaders
Secondary Research
- Annual Reports
- White Paper
- Latest Press Release
- Industry Association
- Paid Database
- Investor Presentations

Step 4 - Data Triangulation
Involves using different sources of information in order to increase the validity of a study
These sources are likely to be stakeholders in a program - participants, other researchers, program staff, other community members, and so on.
Then we put all data in single framework & apply various statistical tools to find out the dynamic on the market.
During the analysis stage, feedback from the stakeholder groups would be compared to determine areas of agreement as well as areas of divergence


