
Key Insights
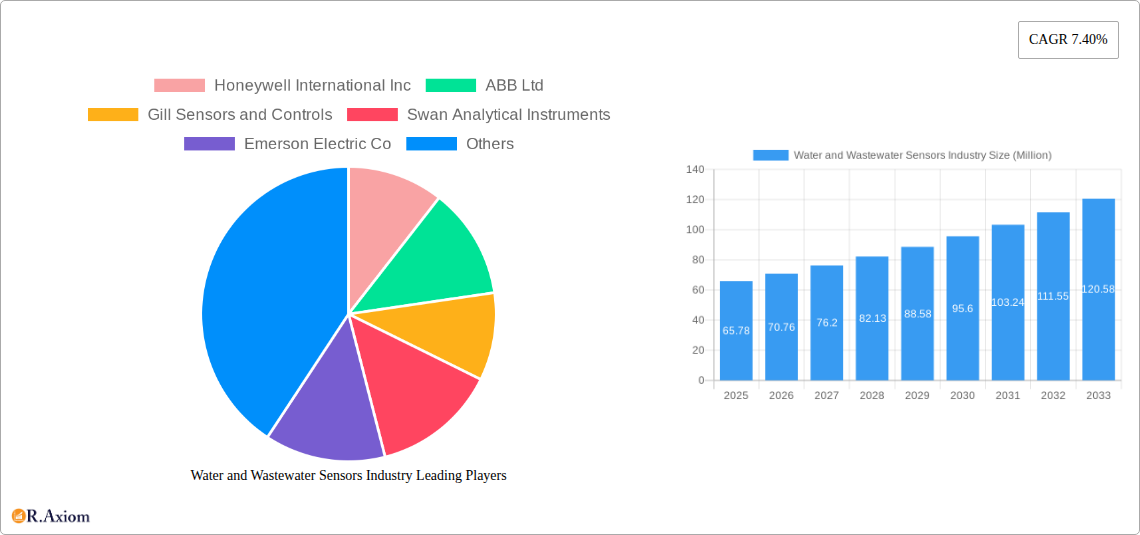
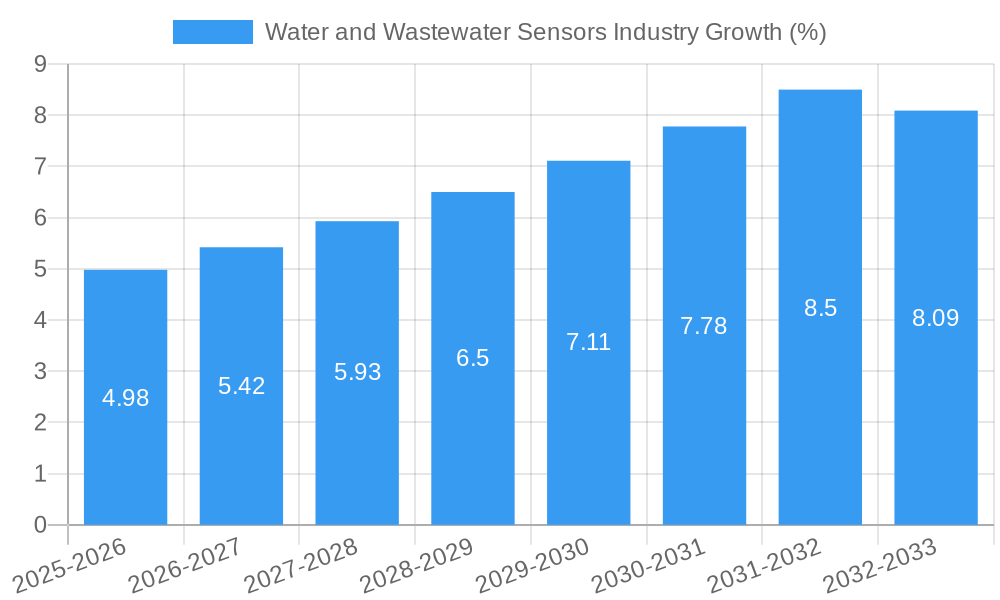
The global water and wastewater sensors market, valued at $65.78 million in 2025, is poised for robust growth, exhibiting a Compound Annual Growth Rate (CAGR) of 7.40% from 2025 to 2033. This expansion is driven by several key factors. Stringent environmental regulations globally are mandating advanced water quality monitoring, fueling demand for precise and reliable sensors. The increasing prevalence of industrial wastewater treatment plants and the growing need for efficient municipal water management systems are also significant contributors. Technological advancements, such as the development of miniaturized, low-power sensors with enhanced accuracy and connectivity features, further propel market growth. Furthermore, the rising adoption of smart water management solutions, integrating sensor data with advanced analytics for optimized water resource utilization, creates lucrative opportunities.
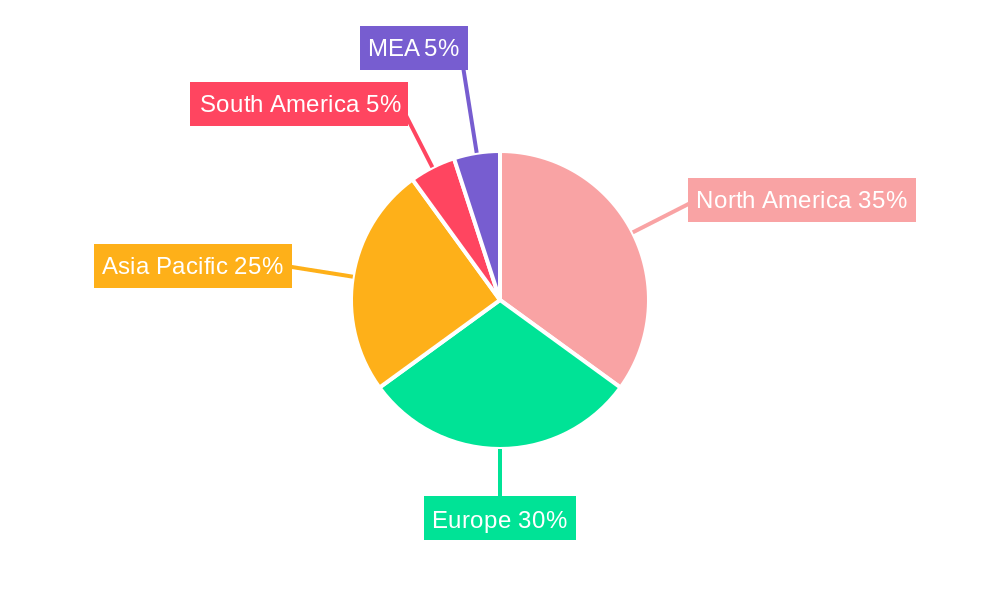
The market segmentation reveals significant growth potential across various sensor types. pH, DO (Dissolved Oxygen), and turbidity sensors dominate the market due to their critical roles in monitoring water quality. However, increasing demand for comprehensive water quality assessments is leading to growing adoption of other sensor types, including ORP (Oxidation-Reduction Potential), conductivity, and temperature sensors. Geographically, North America and Europe currently hold significant market share, driven by established infrastructure and stringent environmental regulations. However, the Asia-Pacific region is expected to witness the fastest growth, fueled by rapid urbanization, industrialization, and increasing investments in water infrastructure projects. While challenges such as high initial investment costs for sensor installations and maintenance can act as restraints, the long-term benefits of improved water quality monitoring and efficient resource management are expected to outweigh these concerns, ensuring continued market expansion.
Water and Wastewater Sensors Industry: A Comprehensive Market Report (2019-2033)
This detailed report provides a comprehensive analysis of the Water and Wastewater Sensors industry, covering market size, segmentation, key players, technological advancements, and future growth prospects. The study period spans from 2019 to 2033, with 2025 serving as the base and estimated year. The report offers actionable insights for industry stakeholders, investors, and businesses seeking to navigate this dynamic market. The global market value in 2025 is estimated at $XX Million.
Water and Wastewater Sensors Industry Market Concentration & Innovation
The Water and Wastewater Sensors market exhibits a moderately concentrated landscape, with several multinational corporations holding significant market share. Honeywell International Inc, ABB Ltd, and Emerson Electric Co are among the leading players, collectively accounting for an estimated xx% of the global market in 2025. However, smaller, specialized companies like Gill Sensors and Controls and Swan Analytical Instruments are also making significant contributions through niche product offerings and innovative technologies.
Market concentration is influenced by factors such as:
- High barriers to entry: Significant capital investments in R&D and manufacturing are required.
- Strong brand reputation and customer loyalty: Established players benefit from strong brand recognition and long-term customer relationships.
- Intellectual property protection: Patents and proprietary technologies provide a competitive advantage.
Innovation is a key driver of market growth, fueled by the increasing demand for accurate, reliable, and efficient water quality monitoring solutions. Major innovation drivers include:
- Technological advancements: Miniaturization, improved sensor accuracy, wireless connectivity, and the integration of AI and IoT technologies are driving innovation.
- Stringent environmental regulations: Governments worldwide are implementing stricter regulations to improve water quality, pushing the adoption of advanced sensors.
- Rising water scarcity and pollution: The growing scarcity of clean water and increasing water pollution are creating a strong demand for robust monitoring solutions.
Mergers and acquisitions (M&A) activities have played a role in shaping the market landscape. While specific M&A deal values are not publicly available for all transactions within the study period (2019-2024), the overall trend suggests a consolidation of the market with larger players acquiring smaller companies to expand their product portfolios and technological capabilities.
Water and Wastewater Sensors Industry Industry Trends & Insights
The Water and Wastewater Sensors market is experiencing robust growth, driven by several key factors. The Compound Annual Growth Rate (CAGR) during the forecast period (2025-2033) is projected to be xx%, propelled by increased urbanization, industrialization, and stringent environmental regulations.
Technological advancements are revolutionizing the industry. The integration of advanced technologies such as IoT, AI, and machine learning is enhancing the capabilities of water quality sensors, allowing for real-time monitoring, predictive maintenance, and data-driven decision-making. This trend is driving the market penetration of smart water management systems and contributing significantly to market expansion.
Consumer preferences are shifting toward more sophisticated sensors with enhanced accuracy, reliability, and ease of use. There is increasing demand for low-maintenance, calibration-free sensors that reduce operational costs and simplify monitoring processes. This is evident in recent product launches such as ANB Sensors' calibration-free pH sensors, which streamline pH monitoring for water quality assessment.
The competitive dynamics are characterized by intense competition among established players and emerging innovators. Companies are focusing on product differentiation, strategic partnerships, and technological advancements to maintain a competitive edge. The market is also witnessing the emergence of new business models based on sensor-as-a-service (SaaS) and data analytics, which provide customers with flexible and cost-effective solutions.
Dominant Markets & Segments in Water and Wastewater Sensors Industry
The Water and Wastewater Sensors market is segmented by application (Municipalities and Industrial Wastewater Treatment) and by sensor type (pH Sensors, DO Sensors, Temperature Sensors, Turbidity Sensors, and Other Types – ORP, Conductivity, etc.).
Dominant Segments:
By Application: The Municipalities segment holds a significant share, driven by the increasing need for efficient and reliable water quality monitoring in municipal water treatment plants. This is due to growing urbanization and the resultant increased demand for potable water and wastewater treatment services.
By Sensor Type: pH sensors dominate the market due to the critical role of pH in water treatment processes. However, other sensor types, such as DO (Dissolved Oxygen), turbidity, and conductivity sensors, are experiencing significant growth due to the increasing awareness of the importance of comprehensive water quality monitoring.
Key Drivers:
- Economic Policies: Investments in infrastructure development, particularly in water and sanitation projects, are driving market growth in several regions.
- Infrastructure Development: The development of new water treatment plants and the modernization of existing infrastructure are creating significant demand for advanced sensors.
- Government Regulations: Stringent environmental regulations related to water quality monitoring are a key factor driving market growth.
Water and Wastewater Sensors Industry Product Developments
Recent advancements in water and wastewater sensor technology include the development of self-cleaning sensors, calibration-free sensors, and multi-parameter sensors that simultaneously measure various water quality parameters. These advancements improve accuracy, reduce maintenance requirements, and streamline water quality monitoring processes. HORIBA's release of the world's first Gel-filled Self-Cleaning pH Electrode is a prime example of this trend. The integration of IoT capabilities enhances remote monitoring and data analytics, facilitating proactive water management and reducing operational costs. These products meet the growing market demand for efficient, accurate, and cost-effective water quality monitoring solutions.
Report Scope & Segmentation Analysis
This report provides a detailed segmentation analysis of the Water and Wastewater Sensors market, examining the various application and sensor types.
Application:
- Municipalities: This segment is expected to witness strong growth due to increasing urbanization and the need for efficient water treatment and management in municipalities.
- Industrial Wastewater Treatment: This segment is driven by the stringent regulations governing industrial wastewater discharge and the need for effective effluent monitoring.
Sensor Types:
- pH Sensors: The largest segment due to its critical role in water treatment processes.
- DO Sensors: Growing in importance due to its role in monitoring oxygen levels in wastewater treatment.
- Temperature Sensors: Essential for monitoring temperature-sensitive processes in water treatment.
- Turbidity Sensors: Important for monitoring water clarity and sediment levels.
- Other Types (ORP, Conductivity, etc.): This segment encompasses other essential parameters for complete water quality assessment, experiencing growth aligned with overall market trends.
Key Drivers of Water and Wastewater Sensors Industry Growth
The growth of the Water and Wastewater Sensors industry is propelled by several key factors. Stringent environmental regulations mandating accurate water quality monitoring are a primary driver. Growing urbanization and industrialization increase the demand for effective water and wastewater treatment solutions, boosting sensor demand. Technological advancements like IoT integration, improved sensor accuracy, and miniaturization are also key contributors to the industry's growth trajectory. Finally, increasing awareness of water scarcity and water quality issues is driving investments in advanced monitoring technologies.
Challenges in the Water and Wastewater Sensors Industry Sector
The Water and Wastewater Sensors industry faces several challenges. High initial investment costs for advanced sensor technologies can deter some customers. Supply chain disruptions can impact sensor availability and pricing, while maintaining sensor accuracy and reliability in harsh environmental conditions remains a technical hurdle. Furthermore, intense competition among established players and new entrants can impact profitability. The industry also faces challenges in managing the increasing volume of data generated by connected sensors.
Emerging Opportunities in Water and Wastewater Sensors Industry
Significant opportunities exist within the Water and Wastewater Sensors market. The growing adoption of smart water management systems, driven by advancements in IoT and AI, presents a substantial market opportunity. Expansion into emerging economies with increasing investments in water infrastructure offers considerable growth potential. Development of new sensor technologies with enhanced capabilities, such as improved sensitivity and fouling resistance, can create new market segments and drive growth. Finally, the growing need for real-time water quality data analysis and predictive maintenance offers significant opportunities for data analytics and service providers.
Leading Players in the Water and Wastewater Sensors Industry Market
- Honeywell International Inc
- ABB Ltd
- Gill Sensors and Controls
- Swan Analytical Instruments
- Emerson Electric Co
- Schneider Electric SE
- Omron Corporation
- Aganoxa
- Delta Phase Electronics Inc
- Yokogawa Electric Corporation
Key Developments in Water and Wastewater Sensors Industry Industry
- November 2022: HORIBA, Ltd. launched the world's first Gel-filled Self-Cleaning pH Electrode, incorporating innovative antifoul technology. This significantly improves pH testing reliability in challenging wastewater environments.
- April 2022: ANB Sensors introduced calibration-free pH sensors, simplifying pH monitoring and reducing maintenance costs. This offers a cost-effective and robust solution for water quality assessment.
Strategic Outlook for Water and Wastewater Sensors Industry Market
The Water and Wastewater Sensors market is poised for significant growth, driven by technological advancements, stringent environmental regulations, and the increasing demand for efficient water management solutions. The integration of IoT, AI, and big data analytics is expected to transform the industry, creating new opportunities for value-added services and data-driven decision-making. The focus on sustainability and water conservation will further drive the adoption of advanced sensor technologies, ensuring a positive outlook for market expansion in the coming years.
Water and Wastewater Sensors Industry Segmentation
-
1. Type
- 1.1. pH Sensors
- 1.2. DO Sensors
- 1.3. Temperature Sensors
- 1.4. Turbidity Sensors
- 1.5. Other Types (ORP, Conductivity, etc.)
-
2. Application
- 2.1. Municipalities
- 2.2. Industrial Wastewater Treatment
Water and Wastewater Sensors Industry Segmentation By Geography
- 1. North America
- 2. Europe
- 3. Asia
- 4. Australia and New Zealand
Water and Wastewater Sensors Industry REPORT HIGHLIGHTS
| Aspects | Details |
|---|---|
| Study Period | 2019-2033 |
| Base Year | 2024 |
| Estimated Year | 2025 |
| Forecast Period | 2025-2033 |
| Historical Period | 2019-2024 |
| Growth Rate | CAGR of 7.40% from 2019-2033 |
| Segmentation |
|
Table of Contents
- 1. Introduction
- 1.1. Research Scope
- 1.2. Market Segmentation
- 1.3. Research Methodology
- 1.4. Definitions and Assumptions
- 2. Executive Summary
- 2.1. Introduction
- 3. Market Dynamics
- 3.1. Introduction
- 3.2. Market Drivers
- 3.2.1. Incremental Technological Advancements aiding the Market Growth
- 3.3. Market Restrains
- 3.3.1 Growing Complexity of Wearable Devices and Limited Use of Features
- 3.3.2 augmented With Security Risks
- 3.4. Market Trends
- 3.4.1. pH Sensor Expected to Witness Increased Demand
- 4. Market Factor Analysis
- 4.1. Porters Five Forces
- 4.2. Supply/Value Chain
- 4.3. PESTEL analysis
- 4.4. Market Entropy
- 4.5. Patent/Trademark Analysis
- 5. Global Water and Wastewater Sensors Industry Analysis, Insights and Forecast, 2019-2031
- 5.1. Market Analysis, Insights and Forecast - by Type
- 5.1.1. pH Sensors
- 5.1.2. DO Sensors
- 5.1.3. Temperature Sensors
- 5.1.4. Turbidity Sensors
- 5.1.5. Other Types (ORP, Conductivity, etc.)
- 5.2. Market Analysis, Insights and Forecast - by Application
- 5.2.1. Municipalities
- 5.2.2. Industrial Wastewater Treatment
- 5.3. Market Analysis, Insights and Forecast - by Region
- 5.3.1. North America
- 5.3.2. Europe
- 5.3.3. Asia
- 5.3.4. Australia and New Zealand
- 5.1. Market Analysis, Insights and Forecast - by Type
- 6. North America Water and Wastewater Sensors Industry Analysis, Insights and Forecast, 2019-2031
- 6.1. Market Analysis, Insights and Forecast - by Type
- 6.1.1. pH Sensors
- 6.1.2. DO Sensors
- 6.1.3. Temperature Sensors
- 6.1.4. Turbidity Sensors
- 6.1.5. Other Types (ORP, Conductivity, etc.)
- 6.2. Market Analysis, Insights and Forecast - by Application
- 6.2.1. Municipalities
- 6.2.2. Industrial Wastewater Treatment
- 6.1. Market Analysis, Insights and Forecast - by Type
- 7. Europe Water and Wastewater Sensors Industry Analysis, Insights and Forecast, 2019-2031
- 7.1. Market Analysis, Insights and Forecast - by Type
- 7.1.1. pH Sensors
- 7.1.2. DO Sensors
- 7.1.3. Temperature Sensors
- 7.1.4. Turbidity Sensors
- 7.1.5. Other Types (ORP, Conductivity, etc.)
- 7.2. Market Analysis, Insights and Forecast - by Application
- 7.2.1. Municipalities
- 7.2.2. Industrial Wastewater Treatment
- 7.1. Market Analysis, Insights and Forecast - by Type
- 8. Asia Water and Wastewater Sensors Industry Analysis, Insights and Forecast, 2019-2031
- 8.1. Market Analysis, Insights and Forecast - by Type
- 8.1.1. pH Sensors
- 8.1.2. DO Sensors
- 8.1.3. Temperature Sensors
- 8.1.4. Turbidity Sensors
- 8.1.5. Other Types (ORP, Conductivity, etc.)
- 8.2. Market Analysis, Insights and Forecast - by Application
- 8.2.1. Municipalities
- 8.2.2. Industrial Wastewater Treatment
- 8.1. Market Analysis, Insights and Forecast - by Type
- 9. Australia and New Zealand Water and Wastewater Sensors Industry Analysis, Insights and Forecast, 2019-2031
- 9.1. Market Analysis, Insights and Forecast - by Type
- 9.1.1. pH Sensors
- 9.1.2. DO Sensors
- 9.1.3. Temperature Sensors
- 9.1.4. Turbidity Sensors
- 9.1.5. Other Types (ORP, Conductivity, etc.)
- 9.2. Market Analysis, Insights and Forecast - by Application
- 9.2.1. Municipalities
- 9.2.2. Industrial Wastewater Treatment
- 9.1. Market Analysis, Insights and Forecast - by Type
- 10. North America Water and Wastewater Sensors Industry Analysis, Insights and Forecast, 2019-2031
- 10.1. Market Analysis, Insights and Forecast - By Country/Sub-region
- 10.1.1. undefined
- 11. Europe Water and Wastewater Sensors Industry Analysis, Insights and Forecast, 2019-2031
- 11.1. Market Analysis, Insights and Forecast - By Country/Sub-region
- 11.1.1. undefined
- 12. Asia Pacific Water and Wastewater Sensors Industry Analysis, Insights and Forecast, 2019-2031
- 12.1. Market Analysis, Insights and Forecast - By Country/Sub-region
- 12.1.1. undefined
- 13. South America Water and Wastewater Sensors Industry Analysis, Insights and Forecast, 2019-2031
- 13.1. Market Analysis, Insights and Forecast - By Country/Sub-region
- 13.1.1. undefined
- 14. North America Water and Wastewater Sensors Industry Analysis, Insights and Forecast, 2019-2031
- 14.1. Market Analysis, Insights and Forecast - By Country/Sub-region
- 14.1.1. undefined
- 15. MEA Water and Wastewater Sensors Industry Analysis, Insights and Forecast, 2019-2031
- 15.1. Market Analysis, Insights and Forecast - By Country/Sub-region
- 15.1.1. undefined
- 16. Competitive Analysis
- 16.1. Global Market Share Analysis 2024
- 16.2. Company Profiles
- 16.2.1 Honeywell International Inc
- 16.2.1.1. Overview
- 16.2.1.2. Products
- 16.2.1.3. SWOT Analysis
- 16.2.1.4. Recent Developments
- 16.2.1.5. Financials (Based on Availability)
- 16.2.2 ABB Ltd
- 16.2.2.1. Overview
- 16.2.2.2. Products
- 16.2.2.3. SWOT Analysis
- 16.2.2.4. Recent Developments
- 16.2.2.5. Financials (Based on Availability)
- 16.2.3 Gill Sensors and Controls
- 16.2.3.1. Overview
- 16.2.3.2. Products
- 16.2.3.3. SWOT Analysis
- 16.2.3.4. Recent Developments
- 16.2.3.5. Financials (Based on Availability)
- 16.2.4 Swan Analytical Instruments
- 16.2.4.1. Overview
- 16.2.4.2. Products
- 16.2.4.3. SWOT Analysis
- 16.2.4.4. Recent Developments
- 16.2.4.5. Financials (Based on Availability)
- 16.2.5 Emerson Electric Co
- 16.2.5.1. Overview
- 16.2.5.2. Products
- 16.2.5.3. SWOT Analysis
- 16.2.5.4. Recent Developments
- 16.2.5.5. Financials (Based on Availability)
- 16.2.6 Schneider Electric SE
- 16.2.6.1. Overview
- 16.2.6.2. Products
- 16.2.6.3. SWOT Analysis
- 16.2.6.4. Recent Developments
- 16.2.6.5. Financials (Based on Availability)
- 16.2.7 Omron Corporation
- 16.2.7.1. Overview
- 16.2.7.2. Products
- 16.2.7.3. SWOT Analysis
- 16.2.7.4. Recent Developments
- 16.2.7.5. Financials (Based on Availability)
- 16.2.8 Aganoxa
- 16.2.8.1. Overview
- 16.2.8.2. Products
- 16.2.8.3. SWOT Analysis
- 16.2.8.4. Recent Developments
- 16.2.8.5. Financials (Based on Availability)
- 16.2.9 Delta Phase Electronics Inc
- 16.2.9.1. Overview
- 16.2.9.2. Products
- 16.2.9.3. SWOT Analysis
- 16.2.9.4. Recent Developments
- 16.2.9.5. Financials (Based on Availability)
- 16.2.10 Yokogawa Electric Corporation
- 16.2.10.1. Overview
- 16.2.10.2. Products
- 16.2.10.3. SWOT Analysis
- 16.2.10.4. Recent Developments
- 16.2.10.5. Financials (Based on Availability)
- 16.2.1 Honeywell International Inc
List of Figures
- Figure 1: Global Water and Wastewater Sensors Industry Revenue Breakdown (Million, %) by Region 2024 & 2032
- Figure 2: Global Water and Wastewater Sensors Industry Volume Breakdown (K Unit, %) by Region 2024 & 2032
- Figure 3: North America Water and Wastewater Sensors Industry Revenue (Million), by Country 2024 & 2032
- Figure 4: North America Water and Wastewater Sensors Industry Volume (K Unit), by Country 2024 & 2032
- Figure 5: North America Water and Wastewater Sensors Industry Revenue Share (%), by Country 2024 & 2032
- Figure 6: North America Water and Wastewater Sensors Industry Volume Share (%), by Country 2024 & 2032
- Figure 7: Europe Water and Wastewater Sensors Industry Revenue (Million), by Country 2024 & 2032
- Figure 8: Europe Water and Wastewater Sensors Industry Volume (K Unit), by Country 2024 & 2032
- Figure 9: Europe Water and Wastewater Sensors Industry Revenue Share (%), by Country 2024 & 2032
- Figure 10: Europe Water and Wastewater Sensors Industry Volume Share (%), by Country 2024 & 2032
- Figure 11: Asia Pacific Water and Wastewater Sensors Industry Revenue (Million), by Country 2024 & 2032
- Figure 12: Asia Pacific Water and Wastewater Sensors Industry Volume (K Unit), by Country 2024 & 2032
- Figure 13: Asia Pacific Water and Wastewater Sensors Industry Revenue Share (%), by Country 2024 & 2032
- Figure 14: Asia Pacific Water and Wastewater Sensors Industry Volume Share (%), by Country 2024 & 2032
- Figure 15: South America Water and Wastewater Sensors Industry Revenue (Million), by Country 2024 & 2032
- Figure 16: South America Water and Wastewater Sensors Industry Volume (K Unit), by Country 2024 & 2032
- Figure 17: South America Water and Wastewater Sensors Industry Revenue Share (%), by Country 2024 & 2032
- Figure 18: South America Water and Wastewater Sensors Industry Volume Share (%), by Country 2024 & 2032
- Figure 19: North America Water and Wastewater Sensors Industry Revenue (Million), by Country 2024 & 2032
- Figure 20: North America Water and Wastewater Sensors Industry Volume (K Unit), by Country 2024 & 2032
- Figure 21: North America Water and Wastewater Sensors Industry Revenue Share (%), by Country 2024 & 2032
- Figure 22: North America Water and Wastewater Sensors Industry Volume Share (%), by Country 2024 & 2032
- Figure 23: MEA Water and Wastewater Sensors Industry Revenue (Million), by Country 2024 & 2032
- Figure 24: MEA Water and Wastewater Sensors Industry Volume (K Unit), by Country 2024 & 2032
- Figure 25: MEA Water and Wastewater Sensors Industry Revenue Share (%), by Country 2024 & 2032
- Figure 26: MEA Water and Wastewater Sensors Industry Volume Share (%), by Country 2024 & 2032
- Figure 27: North America Water and Wastewater Sensors Industry Revenue (Million), by Type 2024 & 2032
- Figure 28: North America Water and Wastewater Sensors Industry Volume (K Unit), by Type 2024 & 2032
- Figure 29: North America Water and Wastewater Sensors Industry Revenue Share (%), by Type 2024 & 2032
- Figure 30: North America Water and Wastewater Sensors Industry Volume Share (%), by Type 2024 & 2032
- Figure 31: North America Water and Wastewater Sensors Industry Revenue (Million), by Application 2024 & 2032
- Figure 32: North America Water and Wastewater Sensors Industry Volume (K Unit), by Application 2024 & 2032
- Figure 33: North America Water and Wastewater Sensors Industry Revenue Share (%), by Application 2024 & 2032
- Figure 34: North America Water and Wastewater Sensors Industry Volume Share (%), by Application 2024 & 2032
- Figure 35: North America Water and Wastewater Sensors Industry Revenue (Million), by Country 2024 & 2032
- Figure 36: North America Water and Wastewater Sensors Industry Volume (K Unit), by Country 2024 & 2032
- Figure 37: North America Water and Wastewater Sensors Industry Revenue Share (%), by Country 2024 & 2032
- Figure 38: North America Water and Wastewater Sensors Industry Volume Share (%), by Country 2024 & 2032
- Figure 39: Europe Water and Wastewater Sensors Industry Revenue (Million), by Type 2024 & 2032
- Figure 40: Europe Water and Wastewater Sensors Industry Volume (K Unit), by Type 2024 & 2032
- Figure 41: Europe Water and Wastewater Sensors Industry Revenue Share (%), by Type 2024 & 2032
- Figure 42: Europe Water and Wastewater Sensors Industry Volume Share (%), by Type 2024 & 2032
- Figure 43: Europe Water and Wastewater Sensors Industry Revenue (Million), by Application 2024 & 2032
- Figure 44: Europe Water and Wastewater Sensors Industry Volume (K Unit), by Application 2024 & 2032
- Figure 45: Europe Water and Wastewater Sensors Industry Revenue Share (%), by Application 2024 & 2032
- Figure 46: Europe Water and Wastewater Sensors Industry Volume Share (%), by Application 2024 & 2032
- Figure 47: Europe Water and Wastewater Sensors Industry Revenue (Million), by Country 2024 & 2032
- Figure 48: Europe Water and Wastewater Sensors Industry Volume (K Unit), by Country 2024 & 2032
- Figure 49: Europe Water and Wastewater Sensors Industry Revenue Share (%), by Country 2024 & 2032
- Figure 50: Europe Water and Wastewater Sensors Industry Volume Share (%), by Country 2024 & 2032
- Figure 51: Asia Water and Wastewater Sensors Industry Revenue (Million), by Type 2024 & 2032
- Figure 52: Asia Water and Wastewater Sensors Industry Volume (K Unit), by Type 2024 & 2032
- Figure 53: Asia Water and Wastewater Sensors Industry Revenue Share (%), by Type 2024 & 2032
- Figure 54: Asia Water and Wastewater Sensors Industry Volume Share (%), by Type 2024 & 2032
- Figure 55: Asia Water and Wastewater Sensors Industry Revenue (Million), by Application 2024 & 2032
- Figure 56: Asia Water and Wastewater Sensors Industry Volume (K Unit), by Application 2024 & 2032
- Figure 57: Asia Water and Wastewater Sensors Industry Revenue Share (%), by Application 2024 & 2032
- Figure 58: Asia Water and Wastewater Sensors Industry Volume Share (%), by Application 2024 & 2032
- Figure 59: Asia Water and Wastewater Sensors Industry Revenue (Million), by Country 2024 & 2032
- Figure 60: Asia Water and Wastewater Sensors Industry Volume (K Unit), by Country 2024 & 2032
- Figure 61: Asia Water and Wastewater Sensors Industry Revenue Share (%), by Country 2024 & 2032
- Figure 62: Asia Water and Wastewater Sensors Industry Volume Share (%), by Country 2024 & 2032
- Figure 63: Australia and New Zealand Water and Wastewater Sensors Industry Revenue (Million), by Type 2024 & 2032
- Figure 64: Australia and New Zealand Water and Wastewater Sensors Industry Volume (K Unit), by Type 2024 & 2032
- Figure 65: Australia and New Zealand Water and Wastewater Sensors Industry Revenue Share (%), by Type 2024 & 2032
- Figure 66: Australia and New Zealand Water and Wastewater Sensors Industry Volume Share (%), by Type 2024 & 2032
- Figure 67: Australia and New Zealand Water and Wastewater Sensors Industry Revenue (Million), by Application 2024 & 2032
- Figure 68: Australia and New Zealand Water and Wastewater Sensors Industry Volume (K Unit), by Application 2024 & 2032
- Figure 69: Australia and New Zealand Water and Wastewater Sensors Industry Revenue Share (%), by Application 2024 & 2032
- Figure 70: Australia and New Zealand Water and Wastewater Sensors Industry Volume Share (%), by Application 2024 & 2032
- Figure 71: Australia and New Zealand Water and Wastewater Sensors Industry Revenue (Million), by Country 2024 & 2032
- Figure 72: Australia and New Zealand Water and Wastewater Sensors Industry Volume (K Unit), by Country 2024 & 2032
- Figure 73: Australia and New Zealand Water and Wastewater Sensors Industry Revenue Share (%), by Country 2024 & 2032
- Figure 74: Australia and New Zealand Water and Wastewater Sensors Industry Volume Share (%), by Country 2024 & 2032
List of Tables
- Table 1: Global Water and Wastewater Sensors Industry Revenue Million Forecast, by Region 2019 & 2032
- Table 2: Global Water and Wastewater Sensors Industry Volume K Unit Forecast, by Region 2019 & 2032
- Table 3: Global Water and Wastewater Sensors Industry Revenue Million Forecast, by Type 2019 & 2032
- Table 4: Global Water and Wastewater Sensors Industry Volume K Unit Forecast, by Type 2019 & 2032
- Table 5: Global Water and Wastewater Sensors Industry Revenue Million Forecast, by Application 2019 & 2032
- Table 6: Global Water and Wastewater Sensors Industry Volume K Unit Forecast, by Application 2019 & 2032
- Table 7: Global Water and Wastewater Sensors Industry Revenue Million Forecast, by Region 2019 & 2032
- Table 8: Global Water and Wastewater Sensors Industry Volume K Unit Forecast, by Region 2019 & 2032
- Table 9: Global Water and Wastewater Sensors Industry Revenue Million Forecast, by Country 2019 & 2032
- Table 10: Global Water and Wastewater Sensors Industry Volume K Unit Forecast, by Country 2019 & 2032
- Table 11: Global Water and Wastewater Sensors Industry Revenue Million Forecast, by Country 2019 & 2032
- Table 12: Global Water and Wastewater Sensors Industry Volume K Unit Forecast, by Country 2019 & 2032
- Table 13: Global Water and Wastewater Sensors Industry Revenue Million Forecast, by Country 2019 & 2032
- Table 14: Global Water and Wastewater Sensors Industry Volume K Unit Forecast, by Country 2019 & 2032
- Table 15: Global Water and Wastewater Sensors Industry Revenue Million Forecast, by Country 2019 & 2032
- Table 16: Global Water and Wastewater Sensors Industry Volume K Unit Forecast, by Country 2019 & 2032
- Table 17: Global Water and Wastewater Sensors Industry Revenue Million Forecast, by Country 2019 & 2032
- Table 18: Global Water and Wastewater Sensors Industry Volume K Unit Forecast, by Country 2019 & 2032
- Table 19: Global Water and Wastewater Sensors Industry Revenue Million Forecast, by Country 2019 & 2032
- Table 20: Global Water and Wastewater Sensors Industry Volume K Unit Forecast, by Country 2019 & 2032
- Table 21: Global Water and Wastewater Sensors Industry Revenue Million Forecast, by Type 2019 & 2032
- Table 22: Global Water and Wastewater Sensors Industry Volume K Unit Forecast, by Type 2019 & 2032
- Table 23: Global Water and Wastewater Sensors Industry Revenue Million Forecast, by Application 2019 & 2032
- Table 24: Global Water and Wastewater Sensors Industry Volume K Unit Forecast, by Application 2019 & 2032
- Table 25: Global Water and Wastewater Sensors Industry Revenue Million Forecast, by Country 2019 & 2032
- Table 26: Global Water and Wastewater Sensors Industry Volume K Unit Forecast, by Country 2019 & 2032
- Table 27: Global Water and Wastewater Sensors Industry Revenue Million Forecast, by Type 2019 & 2032
- Table 28: Global Water and Wastewater Sensors Industry Volume K Unit Forecast, by Type 2019 & 2032
- Table 29: Global Water and Wastewater Sensors Industry Revenue Million Forecast, by Application 2019 & 2032
- Table 30: Global Water and Wastewater Sensors Industry Volume K Unit Forecast, by Application 2019 & 2032
- Table 31: Global Water and Wastewater Sensors Industry Revenue Million Forecast, by Country 2019 & 2032
- Table 32: Global Water and Wastewater Sensors Industry Volume K Unit Forecast, by Country 2019 & 2032
- Table 33: Global Water and Wastewater Sensors Industry Revenue Million Forecast, by Type 2019 & 2032
- Table 34: Global Water and Wastewater Sensors Industry Volume K Unit Forecast, by Type 2019 & 2032
- Table 35: Global Water and Wastewater Sensors Industry Revenue Million Forecast, by Application 2019 & 2032
- Table 36: Global Water and Wastewater Sensors Industry Volume K Unit Forecast, by Application 2019 & 2032
- Table 37: Global Water and Wastewater Sensors Industry Revenue Million Forecast, by Country 2019 & 2032
- Table 38: Global Water and Wastewater Sensors Industry Volume K Unit Forecast, by Country 2019 & 2032
- Table 39: Global Water and Wastewater Sensors Industry Revenue Million Forecast, by Type 2019 & 2032
- Table 40: Global Water and Wastewater Sensors Industry Volume K Unit Forecast, by Type 2019 & 2032
- Table 41: Global Water and Wastewater Sensors Industry Revenue Million Forecast, by Application 2019 & 2032
- Table 42: Global Water and Wastewater Sensors Industry Volume K Unit Forecast, by Application 2019 & 2032
- Table 43: Global Water and Wastewater Sensors Industry Revenue Million Forecast, by Country 2019 & 2032
- Table 44: Global Water and Wastewater Sensors Industry Volume K Unit Forecast, by Country 2019 & 2032
Frequently Asked Questions
1. What is the projected Compound Annual Growth Rate (CAGR) of the Water and Wastewater Sensors Industry?
The projected CAGR is approximately 7.40%.
2. Which companies are prominent players in the Water and Wastewater Sensors Industry?
Key companies in the market include Honeywell International Inc, ABB Ltd, Gill Sensors and Controls, Swan Analytical Instruments, Emerson Electric Co, Schneider Electric SE, Omron Corporation, Aganoxa, Delta Phase Electronics Inc, Yokogawa Electric Corporation.
3. What are the main segments of the Water and Wastewater Sensors Industry?
The market segments include Type, Application.
4. Can you provide details about the market size?
The market size is estimated to be USD 65.78 Million as of 2022.
5. What are some drivers contributing to market growth?
Incremental Technological Advancements aiding the Market Growth.
6. What are the notable trends driving market growth?
pH Sensor Expected to Witness Increased Demand.
7. Are there any restraints impacting market growth?
Growing Complexity of Wearable Devices and Limited Use of Features. augmented With Security Risks.
8. Can you provide examples of recent developments in the market?
November 2022: HORIBA, Ltd., a member of the HORIBA Group, announced the release of the world's first Gel-filled Self-Cleaning pH Electrode incorporating innovative antifoul technology. This pioneering technology addresses the critical need for pH testing and condition management in sewage and wastewater treatment plants, where it plays a vital role in the activation of sludge for water-cleaning processes. The Gel-filled Self-Cleaning pH Electrode features state-of-the-art photocatalyst technology developed in collaboration with Mie University. It integrates an ultraviolet light-emitting diode (UV-LED) within the electrode itself.
9. What pricing options are available for accessing the report?
Pricing options include single-user, multi-user, and enterprise licenses priced at USD 4750, USD 5250, and USD 8750 respectively.
10. Is the market size provided in terms of value or volume?
The market size is provided in terms of value, measured in Million and volume, measured in K Unit.
11. Are there any specific market keywords associated with the report?
Yes, the market keyword associated with the report is "Water and Wastewater Sensors Industry," which aids in identifying and referencing the specific market segment covered.
12. How do I determine which pricing option suits my needs best?
The pricing options vary based on user requirements and access needs. Individual users may opt for single-user licenses, while businesses requiring broader access may choose multi-user or enterprise licenses for cost-effective access to the report.
13. Are there any additional resources or data provided in the Water and Wastewater Sensors Industry report?
While the report offers comprehensive insights, it's advisable to review the specific contents or supplementary materials provided to ascertain if additional resources or data are available.
14. How can I stay updated on further developments or reports in the Water and Wastewater Sensors Industry?
To stay informed about further developments, trends, and reports in the Water and Wastewater Sensors Industry, consider subscribing to industry newsletters, following relevant companies and organizations, or regularly checking reputable industry news sources and publications.
Methodology
Step 1 - Identification of Relevant Samples Size from Population Database


Step 2 - Approaches for Defining Global Market Size (Value, Volume* & Price*)

Note*: In applicable scenarios
Step 3 - Data Sources
Primary Research
- Web Analytics
- Survey Reports
- Research Institute
- Latest Research Reports
- Opinion Leaders
Secondary Research
- Annual Reports
- White Paper
- Latest Press Release
- Industry Association
- Paid Database
- Investor Presentations

Step 4 - Data Triangulation
Involves using different sources of information in order to increase the validity of a study
These sources are likely to be stakeholders in a program - participants, other researchers, program staff, other community members, and so on.
Then we put all data in single framework & apply various statistical tools to find out the dynamic on the market.
During the analysis stage, feedback from the stakeholder groups would be compared to determine areas of agreement as well as areas of divergence


