Active Protection Systems Market CAGR Growth Drivers and Trends: Forecasts 2025-2033

Active Protection Systems Market by Production Analysis, by Consumption Analysis, by Import Market Analysis (Value & Volume), by Export Market Analysis (Value & Volume), by Price Trend Analysis, by North America (United States, Canada, Mexico), by South America (Brazil, Argentina, Rest of South America), by Europe (United Kingdom, Germany, France, Italy, Spain, Russia, Benelux, Nordics, Rest of Europe), by Middle East & Africa (Turkey, Israel, GCC, North Africa, South Africa, Rest of Middle East & Africa), by Asia Pacific (China, India, Japan, South Korea, ASEAN, Oceania, Rest of Asia Pacific) Forecast 2025-2033

Jun 30 2025
Base Year: 2024

234 Pages
Main Logo

Active Protection Systems Market CAGR Growth Drivers and Trends: Forecasts 2025-2033


Home
Industries
Aerospace & Defense
sponsor image
sponsor image
sponsor image
sponsor image

Tailored for you

  • In-depth Analysis Tailored to Specified Regions or Segments
  • Company Profiles Customized to User Preferences
  • Comprehensive Insights Focused on Specific Segments or Regions
  • Customized Evaluation of Competitive Landscape to Meet Your Needs
  • Tailored Customization to Address Other Specific Requirements
Ask for customization


Key Insights

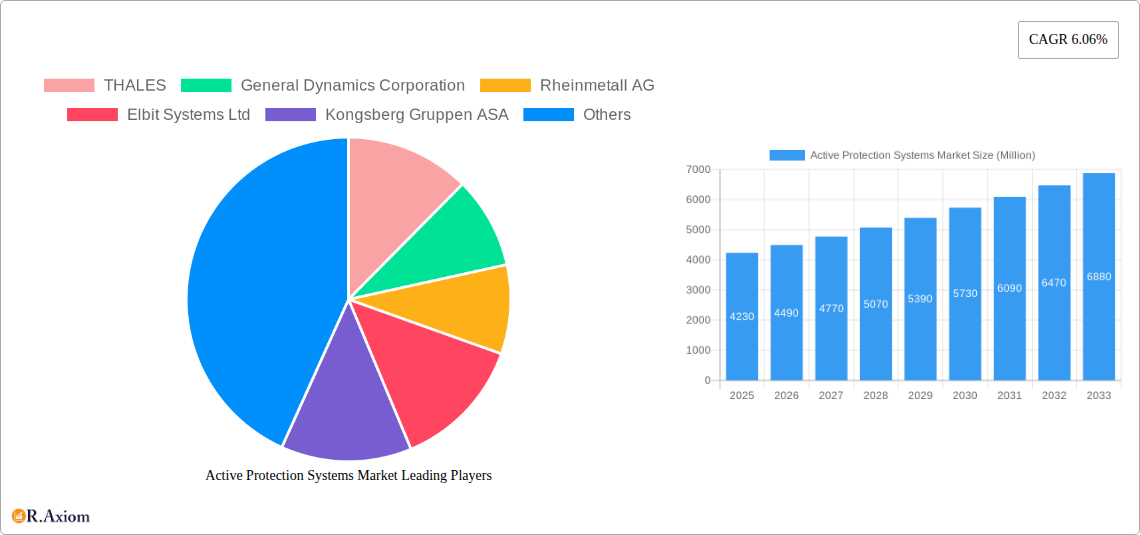
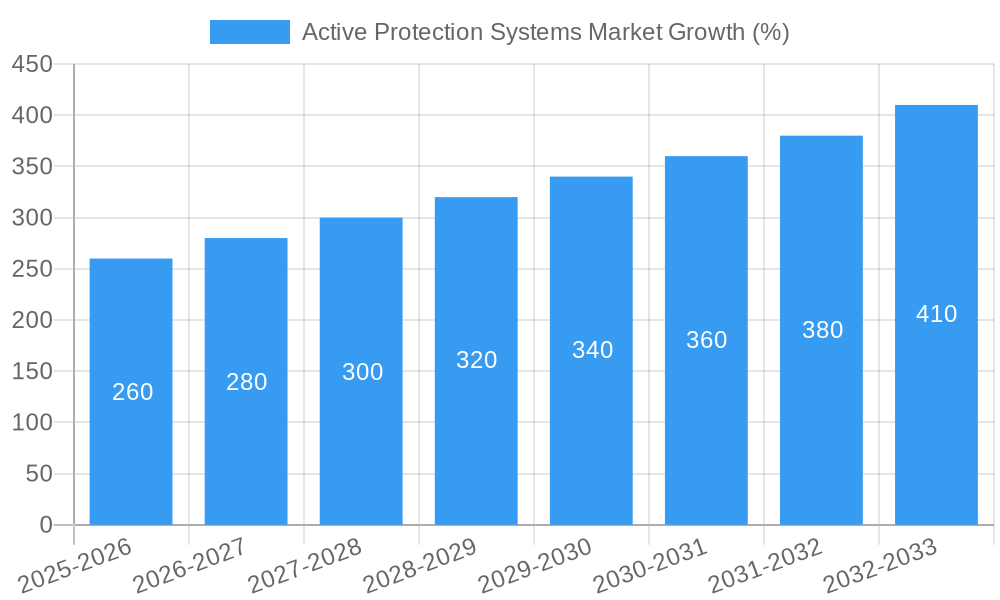
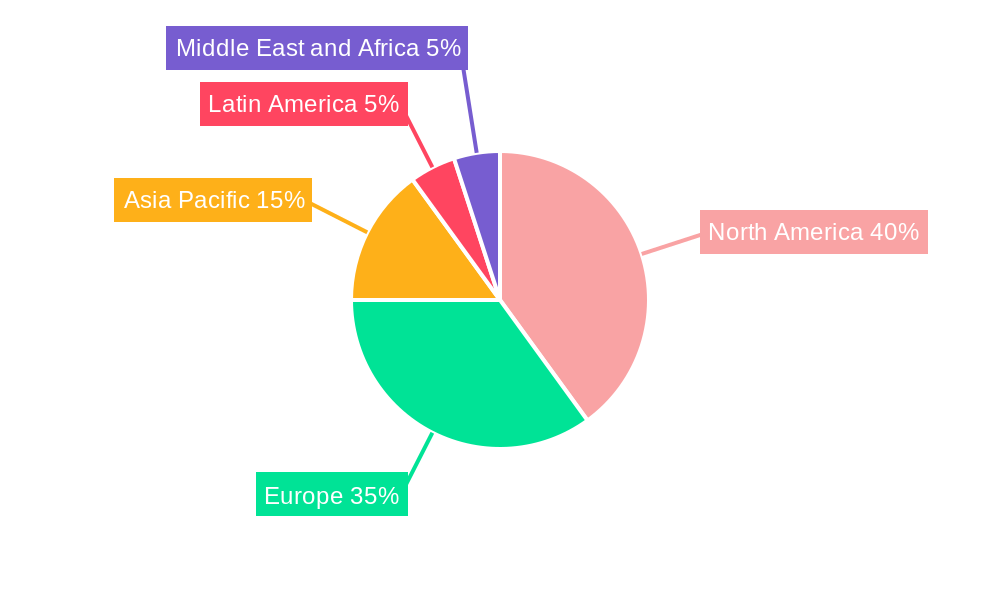
The Active Protection Systems (APS) market, valued at $4.23 billion in 2025, is projected to experience robust growth, driven by escalating geopolitical tensions and the increasing demand for enhanced protection of military vehicles and personnel. A Compound Annual Growth Rate (CAGR) of 6.06% from 2025 to 2033 indicates a significant market expansion, reaching an estimated value exceeding $7 billion by 2033. This growth is fueled by several key factors. The rising adoption of hard-kill systems, which physically neutralize incoming threats, is a major contributor. Simultaneously, soft-kill systems, which employ countermeasures like jamming or deception, are gaining traction due to their cost-effectiveness and suitability for certain scenarios. Technological advancements in sensor technology, AI-driven threat detection, and improved system integration are further propelling market expansion. Regional variations exist, with North America and Europe currently dominating the market due to high defense budgets and established technological capabilities. However, the Asia-Pacific region is poised for significant growth, driven by increasing defense modernization efforts and rising geopolitical concerns in the region. Market restraints include the high initial investment costs associated with APS implementation and the ongoing challenges in developing effective countermeasures against advanced weaponry.

The market segmentation reveals a dynamic landscape. Hard-kill systems currently hold a larger market share compared to soft-kill systems, but the latter is expected to witness accelerated growth due to technological advancements reducing their limitations. Terrestrial platforms dominate current deployment, but naval applications are also growing, driven by the need to protect naval vessels from diverse threats. Key players like Thales, General Dynamics, Rheinmetall, and Elbit Systems are at the forefront of innovation and competition, constantly striving to improve the effectiveness, affordability, and versatility of APS solutions. The future of the APS market hinges on the continued development of advanced technologies, the evolving geopolitical landscape, and the sustained commitment to enhancing military vehicle survivability. Strategic partnerships and collaborations among defense contractors will likely play a significant role in shaping the industry's trajectory over the forecast period.

Active Protection Systems Market Research Report - Market Size, Growth & Forecast

Active Protection Systems Market: A Comprehensive Analysis (2019-2033)

This detailed report provides an in-depth analysis of the Active Protection Systems (APS) market, offering valuable insights for industry stakeholders, investors, and strategic decision-makers. The study covers the period 2019-2033, with 2025 serving as the base and estimated year. The report meticulously analyzes market trends, competitive dynamics, technological advancements, and growth opportunities within the APS sector. The market is segmented by type (Hard-Kill Systems, Soft-Kill Systems) and platform (Terrestrial, Naval), offering a granular view of market performance and future potential. The total market size is projected to reach xx Million by 2033.

Active Protection Systems Market Market Concentration & Innovation

The Active Protection Systems market exhibits a moderately concentrated landscape, dominated by a few key players like THALES, General Dynamics Corporation, and Rheinmetall AG. These companies collectively hold approximately xx% of the market share in 2025, demonstrating their established presence and technological prowess. However, the market is witnessing increasing participation from smaller, innovative companies focusing on niche applications and advanced technologies.

Market Concentration Metrics (2025):

  • Top 3 players' market share: xx%
  • Top 5 players' market share: xx%
  • Average M&A deal value (2019-2024): xx Million

Innovation Drivers:

  • Advancements in sensor technologies (e.g., radar, infrared)
  • Development of AI-powered threat detection and response systems
  • Miniaturization and weight reduction of APS components
  • Increased focus on counter-UAS (Unmanned Aerial System) capabilities

Regulatory Frameworks & End-User Trends:

Stringent regulatory frameworks regarding defense technology and export controls significantly influence market growth. Increasing defense budgets globally, coupled with heightened security concerns, drive demand for sophisticated APS solutions. The trend towards autonomous and unmanned platforms further fuels innovation in APS technology. Consolidation through mergers and acquisitions (M&A) is prevalent, with deal values expected to increase in the forecast period, contributing to market concentration.

Active Protection Systems Market Industry Trends & Insights

The Active Protection Systems market is experiencing robust growth, driven by escalating geopolitical instability and the need to enhance the survivability of military platforms. The market registered a CAGR of xx% during the historical period (2019-2024) and is projected to maintain a CAGR of xx% during the forecast period (2025-2033). Technological advancements, particularly in AI and sensor technology, are significantly impacting market dynamics. The increasing adoption of APS across various platforms (terrestrial, naval, aerial) is a key growth driver. Consumer preference is shifting towards lighter, more efficient, and adaptable systems, which necessitates continuous innovation from manufacturers. The competitive landscape is dynamic, with established players facing pressure from smaller, more agile companies specializing in specific technologies. Market penetration is expected to increase to xx% by 2033.

Active Protection Systems Market Growth

Dominant Markets & Segments in Active Protection Systems Market

The North American region currently dominates the Active Protection Systems market, driven by robust defense budgets and substantial investments in military modernization. Within the market segments, Hard-Kill systems hold a larger market share compared to Soft-Kill systems due to their greater effectiveness against direct threats. Terrestrial platforms currently represent the larger market segment; however, the naval segment is expected to witness significant growth owing to the increasing deployment of advanced naval vessels.

Key Drivers of Regional Dominance (North America):

  • High defense spending
  • Technological advancements
  • Strong government support for defense industries
  • Presence of major APS manufacturers

Segment Dominance Analysis:

  • Hard-Kill Systems: Higher effectiveness against kinetic threats, driving higher demand.
  • Soft-Kill Systems: Growing adoption due to cost-effectiveness and suitability for certain threat scenarios.
  • Terrestrial Platforms: Larger market share due to wider adoption by land forces.
  • Naval Platforms: Expected high growth driven by modernization of naval fleets and increased awareness of maritime threats.

Active Protection Systems Market Product Developments

Recent years have seen significant advancements in Active Protection Systems, focusing on enhanced target detection, improved countermeasure effectiveness, and reduced system weight and size. The integration of AI and machine learning is enabling more sophisticated threat assessment and response capabilities. This has led to the development of systems with improved accuracy, reduced false alarms, and increased overall effectiveness. New applications of APS are emerging in areas such as the protection of civilian infrastructure and high-value assets. These advancements ensure that APS systems remain highly relevant to the evolving security landscape.

Report Scope & Segmentation Analysis

This report comprehensively analyzes the Active Protection Systems market across various segments.

By Type:

  • Hard-Kill Systems: This segment is projected to experience robust growth, driven by its effectiveness in neutralizing incoming threats. The market size is estimated at xx Million in 2025.
  • Soft-Kill Systems: This segment is expected to witness steady growth, propelled by its cost-effectiveness and suitability for certain applications. The market size is estimated at xx Million in 2025.

By Platform:

  • Terrestrial Platforms: This segment currently dominates the market and is anticipated to maintain its lead due to large-scale adoption by land forces. The market size is estimated at xx Million in 2025.
  • Naval Platforms: This segment is poised for significant growth, fueled by the increasing adoption of APS on naval vessels. The market size is estimated at xx Million in 2025.

Key Drivers of Active Protection Systems Market Growth

The growth of the Active Protection Systems market is driven by several key factors:

  • Increased defense budgets globally, particularly in regions experiencing geopolitical instability.
  • Advancements in sensor and AI technologies leading to more effective and efficient APS systems.
  • Growing demand for APS across various platforms, including terrestrial, naval, and aerial vehicles.
  • Rising threats from various sources, including conventional weapons, improvised explosive devices, and unmanned aerial vehicles.

Challenges in the Active Protection Systems Market Sector

The Active Protection Systems market faces several challenges:

  • High initial investment costs associated with APS systems can be a barrier to adoption, particularly for smaller nations.
  • The complexity of APS technology and the need for specialized expertise can hinder wider deployment.
  • Intense competition among major players can lead to price wars and pressure on profit margins.
  • Regulatory hurdles and export controls can limit market access in certain regions.

Emerging Opportunities in Active Protection Systems Market

The Active Protection Systems market presents several exciting opportunities:

  • Development of next-generation APS systems that are lighter, more compact, and energy-efficient.
  • Expansion into new markets, including civilian applications such as infrastructure protection.
  • Integration of APS with other defense technologies, such as counter-drone systems.
  • Growing demand for APS in emerging economies with increasing defense budgets.

Leading Players in the Active Protection Systems Market Market

  • THALES
  • General Dynamics Corporation
  • Rheinmetall AG
  • Elbit Systems Ltd
  • Kongsberg Gruppen ASA
  • Rostec State Corporation
  • Rafael Advanced Defense Systems Ltd
  • RTX Corporation
  • Artis
  • Leonardo S p A
  • BAE Systems plc
  • Saab AB
  • ASELSAN A Ş

Key Developments in Active Protection Systems Market Industry

  • January 2023: Rheinmetall AG announced a significant investment in the development of a new generation of APS technology.
  • March 2022: THALES unveiled its latest APS system with enhanced counter-UAS capabilities.
  • June 2021: General Dynamics Corporation secured a large contract for the supply of APS systems to a major international customer. (Specific details redacted for confidentiality)

Strategic Outlook for Active Protection Systems Market Market

The Active Protection Systems market is poised for continued growth, driven by technological advancements, increasing defense budgets, and rising geopolitical uncertainty. The focus on AI-powered systems and the development of lighter, more adaptable APS solutions will shape market dynamics in the coming years. Expansion into new markets and applications will further contribute to market expansion. The market presents substantial opportunities for companies capable of adapting to evolving technological and geopolitical landscapes.

Active Protection Systems Market Segmentation

  • 1. Production Analysis
  • 2. Consumption Analysis
  • 3. Import Market Analysis (Value & Volume)
  • 4. Export Market Analysis (Value & Volume)
  • 5. Price Trend Analysis

Active Protection Systems Market Segmentation By Geography

  • 1. North America
    • 1.1. United States
    • 1.2. Canada
    • 1.3. Mexico
  • 2. South America
    • 2.1. Brazil
    • 2.2. Argentina
    • 2.3. Rest of South America
  • 3. Europe
    • 3.1. United Kingdom
    • 3.2. Germany
    • 3.3. France
    • 3.4. Italy
    • 3.5. Spain
    • 3.6. Russia
    • 3.7. Benelux
    • 3.8. Nordics
    • 3.9. Rest of Europe
  • 4. Middle East & Africa
    • 4.1. Turkey
    • 4.2. Israel
    • 4.3. GCC
    • 4.4. North Africa
    • 4.5. South Africa
    • 4.6. Rest of Middle East & Africa
  • 5. Asia Pacific
    • 5.1. China
    • 5.2. India
    • 5.3. Japan
    • 5.4. South Korea
    • 5.5. ASEAN
    • 5.6. Oceania
    • 5.7. Rest of Asia Pacific
Active Protection Systems Market Regional Share


Active Protection Systems Market REPORT HIGHLIGHTS

AspectsDetails
Study Period 2019-2033
Base Year 2024
Estimated Year 2025
Forecast Period2025-2033
Historical Period2019-2024
Growth RateCAGR of 6.06% from 2019-2033
Segmentation
    • By Production Analysis
    • By Consumption Analysis
    • By Import Market Analysis (Value & Volume)
    • By Export Market Analysis (Value & Volume)
    • By Price Trend Analysis
  • By Geography
    • North America
      • United States
      • Canada
      • Mexico
    • South America
      • Brazil
      • Argentina
      • Rest of South America
    • Europe
      • United Kingdom
      • Germany
      • France
      • Italy
      • Spain
      • Russia
      • Benelux
      • Nordics
      • Rest of Europe
    • Middle East & Africa
      • Turkey
      • Israel
      • GCC
      • North Africa
      • South Africa
      • Rest of Middle East & Africa
    • Asia Pacific
      • China
      • India
      • Japan
      • South Korea
      • ASEAN
      • Oceania
      • Rest of Asia Pacific


Table of Contents

  1. 1. Introduction
    • 1.1. Research Scope
    • 1.2. Market Segmentation
    • 1.3. Research Methodology
    • 1.4. Definitions and Assumptions
  2. 2. Executive Summary
    • 2.1. Introduction
  3. 3. Market Dynamics
    • 3.1. Introduction
      • 3.2. Market Drivers
        • 3.2.1. ; Increasing Number Of Air Passengers; Use Of Portable Electronic Devices
      • 3.3. Market Restrains
        • 3.3.1. ; High Cost Of Connectivity Equipments
      • 3.4. Market Trends
        • 3.4.1. The Terrestrial Segment Holds Highest Shares in the Market
  4. 4. Market Factor Analysis
    • 4.1. Porters Five Forces
    • 4.2. Supply/Value Chain
    • 4.3. PESTEL analysis
    • 4.4. Market Entropy
    • 4.5. Patent/Trademark Analysis
  5. 5. Global Active Protection Systems Market Analysis, Insights and Forecast, 2019-2031
    • 5.1. Market Analysis, Insights and Forecast - by Production Analysis
      • 5.2. Market Analysis, Insights and Forecast - by Consumption Analysis
        • 5.3. Market Analysis, Insights and Forecast - by Import Market Analysis (Value & Volume)
          • 5.4. Market Analysis, Insights and Forecast - by Export Market Analysis (Value & Volume)
            • 5.5. Market Analysis, Insights and Forecast - by Price Trend Analysis
              • 5.6. Market Analysis, Insights and Forecast - by Region
                • 5.6.1. North America
                • 5.6.2. South America
                • 5.6.3. Europe
                • 5.6.4. Middle East & Africa
                • 5.6.5. Asia Pacific
            • 6. North America Active Protection Systems Market Analysis, Insights and Forecast, 2019-2031
              • 6.1. Market Analysis, Insights and Forecast - by Production Analysis
                • 6.2. Market Analysis, Insights and Forecast - by Consumption Analysis
                  • 6.3. Market Analysis, Insights and Forecast - by Import Market Analysis (Value & Volume)
                    • 6.4. Market Analysis, Insights and Forecast - by Export Market Analysis (Value & Volume)
                      • 6.5. Market Analysis, Insights and Forecast - by Price Trend Analysis
                      • 7. South America Active Protection Systems Market Analysis, Insights and Forecast, 2019-2031
                        • 7.1. Market Analysis, Insights and Forecast - by Production Analysis
                          • 7.2. Market Analysis, Insights and Forecast - by Consumption Analysis
                            • 7.3. Market Analysis, Insights and Forecast - by Import Market Analysis (Value & Volume)
                              • 7.4. Market Analysis, Insights and Forecast - by Export Market Analysis (Value & Volume)
                                • 7.5. Market Analysis, Insights and Forecast - by Price Trend Analysis
                                • 8. Europe Active Protection Systems Market Analysis, Insights and Forecast, 2019-2031
                                  • 8.1. Market Analysis, Insights and Forecast - by Production Analysis
                                    • 8.2. Market Analysis, Insights and Forecast - by Consumption Analysis
                                      • 8.3. Market Analysis, Insights and Forecast - by Import Market Analysis (Value & Volume)
                                        • 8.4. Market Analysis, Insights and Forecast - by Export Market Analysis (Value & Volume)
                                          • 8.5. Market Analysis, Insights and Forecast - by Price Trend Analysis
                                          • 9. Middle East & Africa Active Protection Systems Market Analysis, Insights and Forecast, 2019-2031
                                            • 9.1. Market Analysis, Insights and Forecast - by Production Analysis
                                              • 9.2. Market Analysis, Insights and Forecast - by Consumption Analysis
                                                • 9.3. Market Analysis, Insights and Forecast - by Import Market Analysis (Value & Volume)
                                                  • 9.4. Market Analysis, Insights and Forecast - by Export Market Analysis (Value & Volume)
                                                    • 9.5. Market Analysis, Insights and Forecast - by Price Trend Analysis
                                                    • 10. Asia Pacific Active Protection Systems Market Analysis, Insights and Forecast, 2019-2031
                                                      • 10.1. Market Analysis, Insights and Forecast - by Production Analysis
                                                        • 10.2. Market Analysis, Insights and Forecast - by Consumption Analysis
                                                          • 10.3. Market Analysis, Insights and Forecast - by Import Market Analysis (Value & Volume)
                                                            • 10.4. Market Analysis, Insights and Forecast - by Export Market Analysis (Value & Volume)
                                                              • 10.5. Market Analysis, Insights and Forecast - by Price Trend Analysis
                                                              • 11. North America Active Protection Systems Market Analysis, Insights and Forecast, 2019-2031
                                                                  • 11.1. Market Analysis, Insights and Forecast - By Country/Sub-region
                                                                    • 11.1.1 United States
                                                                    • 11.1.2 Canada
                                                              • 12. Europe Active Protection Systems Market Analysis, Insights and Forecast, 2019-2031
                                                                  • 12.1. Market Analysis, Insights and Forecast - By Country/Sub-region
                                                                    • 12.1.1 United Kingdom
                                                                    • 12.1.2 France
                                                                    • 12.1.3 Germany
                                                                    • 12.1.4 Russia
                                                                    • 12.1.5 Rest of Europe
                                                              • 13. Asia Pacific Active Protection Systems Market Analysis, Insights and Forecast, 2019-2031
                                                                  • 13.1. Market Analysis, Insights and Forecast - By Country/Sub-region
                                                                    • 13.1.1 China
                                                                    • 13.1.2 India
                                                                    • 13.1.3 Japan
                                                                    • 13.1.4 South Korea
                                                                    • 13.1.5 Rest of Asia Pacific
                                                              • 14. Latin America Active Protection Systems Market Analysis, Insights and Forecast, 2019-2031
                                                                  • 14.1. Market Analysis, Insights and Forecast - By Country/Sub-region
                                                                    • 14.1.1 Brazil
                                                                    • 14.1.2 Mexico
                                                                    • 14.1.3 Rest of Latin America
                                                              • 15. Middle East and Africa Active Protection Systems Market Analysis, Insights and Forecast, 2019-2031
                                                                  • 15.1. Market Analysis, Insights and Forecast - By Country/Sub-region
                                                                    • 15.1.1 United Arab Emirates
                                                                    • 15.1.2 Saudi Arabia
                                                                    • 15.1.3 Israel
                                                                    • 15.1.4 South Africa
                                                                    • 15.1.5 Rest of Middle East and Africa
                                                              • 16. Competitive Analysis
                                                                • 16.1. Global Market Share Analysis 2024
                                                                  • 16.2. Company Profiles
                                                                    • 16.2.1 THALES
                                                                      • 16.2.1.1. Overview
                                                                      • 16.2.1.2. Products
                                                                      • 16.2.1.3. SWOT Analysis
                                                                      • 16.2.1.4. Recent Developments
                                                                      • 16.2.1.5. Financials (Based on Availability)
                                                                    • 16.2.2 General Dynamics Corporation
                                                                      • 16.2.2.1. Overview
                                                                      • 16.2.2.2. Products
                                                                      • 16.2.2.3. SWOT Analysis
                                                                      • 16.2.2.4. Recent Developments
                                                                      • 16.2.2.5. Financials (Based on Availability)
                                                                    • 16.2.3 Rheinmetall AG
                                                                      • 16.2.3.1. Overview
                                                                      • 16.2.3.2. Products
                                                                      • 16.2.3.3. SWOT Analysis
                                                                      • 16.2.3.4. Recent Developments
                                                                      • 16.2.3.5. Financials (Based on Availability)
                                                                    • 16.2.4 Elbit Systems Ltd
                                                                      • 16.2.4.1. Overview
                                                                      • 16.2.4.2. Products
                                                                      • 16.2.4.3. SWOT Analysis
                                                                      • 16.2.4.4. Recent Developments
                                                                      • 16.2.4.5. Financials (Based on Availability)
                                                                    • 16.2.5 Kongsberg Gruppen ASA
                                                                      • 16.2.5.1. Overview
                                                                      • 16.2.5.2. Products
                                                                      • 16.2.5.3. SWOT Analysis
                                                                      • 16.2.5.4. Recent Developments
                                                                      • 16.2.5.5. Financials (Based on Availability)
                                                                    • 16.2.6 Rostec State Corporatio
                                                                      • 16.2.6.1. Overview
                                                                      • 16.2.6.2. Products
                                                                      • 16.2.6.3. SWOT Analysis
                                                                      • 16.2.6.4. Recent Developments
                                                                      • 16.2.6.5. Financials (Based on Availability)
                                                                    • 16.2.7 Rafael Advanced Defense Systems Ltd
                                                                      • 16.2.7.1. Overview
                                                                      • 16.2.7.2. Products
                                                                      • 16.2.7.3. SWOT Analysis
                                                                      • 16.2.7.4. Recent Developments
                                                                      • 16.2.7.5. Financials (Based on Availability)
                                                                    • 16.2.8 RTX Corporation
                                                                      • 16.2.8.1. Overview
                                                                      • 16.2.8.2. Products
                                                                      • 16.2.8.3. SWOT Analysis
                                                                      • 16.2.8.4. Recent Developments
                                                                      • 16.2.8.5. Financials (Based on Availability)
                                                                    • 16.2.9 Artis
                                                                      • 16.2.9.1. Overview
                                                                      • 16.2.9.2. Products
                                                                      • 16.2.9.3. SWOT Analysis
                                                                      • 16.2.9.4. Recent Developments
                                                                      • 16.2.9.5. Financials (Based on Availability)
                                                                    • 16.2.10 Leonardo S p A
                                                                      • 16.2.10.1. Overview
                                                                      • 16.2.10.2. Products
                                                                      • 16.2.10.3. SWOT Analysis
                                                                      • 16.2.10.4. Recent Developments
                                                                      • 16.2.10.5. Financials (Based on Availability)
                                                                    • 16.2.11 BAE Systems plc
                                                                      • 16.2.11.1. Overview
                                                                      • 16.2.11.2. Products
                                                                      • 16.2.11.3. SWOT Analysis
                                                                      • 16.2.11.4. Recent Developments
                                                                      • 16.2.11.5. Financials (Based on Availability)
                                                                    • 16.2.12 Saab AB
                                                                      • 16.2.12.1. Overview
                                                                      • 16.2.12.2. Products
                                                                      • 16.2.12.3. SWOT Analysis
                                                                      • 16.2.12.4. Recent Developments
                                                                      • 16.2.12.5. Financials (Based on Availability)
                                                                    • 16.2.13 ASELSAN A Ş
                                                                      • 16.2.13.1. Overview
                                                                      • 16.2.13.2. Products
                                                                      • 16.2.13.3. SWOT Analysis
                                                                      • 16.2.13.4. Recent Developments
                                                                      • 16.2.13.5. Financials (Based on Availability)

                                                              List of Figures

                                                              1. Figure 1: Global Active Protection Systems Market Revenue Breakdown (Million, %) by Region 2024 & 2032
                                                              2. Figure 2: North America Active Protection Systems Market Revenue (Million), by Country 2024 & 2032
                                                              3. Figure 3: North America Active Protection Systems Market Revenue Share (%), by Country 2024 & 2032
                                                              4. Figure 4: Europe Active Protection Systems Market Revenue (Million), by Country 2024 & 2032
                                                              5. Figure 5: Europe Active Protection Systems Market Revenue Share (%), by Country 2024 & 2032
                                                              6. Figure 6: Asia Pacific Active Protection Systems Market Revenue (Million), by Country 2024 & 2032
                                                              7. Figure 7: Asia Pacific Active Protection Systems Market Revenue Share (%), by Country 2024 & 2032
                                                              8. Figure 8: Latin America Active Protection Systems Market Revenue (Million), by Country 2024 & 2032
                                                              9. Figure 9: Latin America Active Protection Systems Market Revenue Share (%), by Country 2024 & 2032
                                                              10. Figure 10: Middle East and Africa Active Protection Systems Market Revenue (Million), by Country 2024 & 2032
                                                              11. Figure 11: Middle East and Africa Active Protection Systems Market Revenue Share (%), by Country 2024 & 2032
                                                              12. Figure 12: North America Active Protection Systems Market Revenue (Million), by Production Analysis 2024 & 2032
                                                              13. Figure 13: North America Active Protection Systems Market Revenue Share (%), by Production Analysis 2024 & 2032
                                                              14. Figure 14: North America Active Protection Systems Market Revenue (Million), by Consumption Analysis 2024 & 2032
                                                              15. Figure 15: North America Active Protection Systems Market Revenue Share (%), by Consumption Analysis 2024 & 2032
                                                              16. Figure 16: North America Active Protection Systems Market Revenue (Million), by Import Market Analysis (Value & Volume) 2024 & 2032
                                                              17. Figure 17: North America Active Protection Systems Market Revenue Share (%), by Import Market Analysis (Value & Volume) 2024 & 2032
                                                              18. Figure 18: North America Active Protection Systems Market Revenue (Million), by Export Market Analysis (Value & Volume) 2024 & 2032
                                                              19. Figure 19: North America Active Protection Systems Market Revenue Share (%), by Export Market Analysis (Value & Volume) 2024 & 2032
                                                              20. Figure 20: North America Active Protection Systems Market Revenue (Million), by Price Trend Analysis 2024 & 2032
                                                              21. Figure 21: North America Active Protection Systems Market Revenue Share (%), by Price Trend Analysis 2024 & 2032
                                                              22. Figure 22: North America Active Protection Systems Market Revenue (Million), by Country 2024 & 2032
                                                              23. Figure 23: North America Active Protection Systems Market Revenue Share (%), by Country 2024 & 2032
                                                              24. Figure 24: South America Active Protection Systems Market Revenue (Million), by Production Analysis 2024 & 2032
                                                              25. Figure 25: South America Active Protection Systems Market Revenue Share (%), by Production Analysis 2024 & 2032
                                                              26. Figure 26: South America Active Protection Systems Market Revenue (Million), by Consumption Analysis 2024 & 2032
                                                              27. Figure 27: South America Active Protection Systems Market Revenue Share (%), by Consumption Analysis 2024 & 2032
                                                              28. Figure 28: South America Active Protection Systems Market Revenue (Million), by Import Market Analysis (Value & Volume) 2024 & 2032
                                                              29. Figure 29: South America Active Protection Systems Market Revenue Share (%), by Import Market Analysis (Value & Volume) 2024 & 2032
                                                              30. Figure 30: South America Active Protection Systems Market Revenue (Million), by Export Market Analysis (Value & Volume) 2024 & 2032
                                                              31. Figure 31: South America Active Protection Systems Market Revenue Share (%), by Export Market Analysis (Value & Volume) 2024 & 2032
                                                              32. Figure 32: South America Active Protection Systems Market Revenue (Million), by Price Trend Analysis 2024 & 2032
                                                              33. Figure 33: South America Active Protection Systems Market Revenue Share (%), by Price Trend Analysis 2024 & 2032
                                                              34. Figure 34: South America Active Protection Systems Market Revenue (Million), by Country 2024 & 2032
                                                              35. Figure 35: South America Active Protection Systems Market Revenue Share (%), by Country 2024 & 2032
                                                              36. Figure 36: Europe Active Protection Systems Market Revenue (Million), by Production Analysis 2024 & 2032
                                                              37. Figure 37: Europe Active Protection Systems Market Revenue Share (%), by Production Analysis 2024 & 2032
                                                              38. Figure 38: Europe Active Protection Systems Market Revenue (Million), by Consumption Analysis 2024 & 2032
                                                              39. Figure 39: Europe Active Protection Systems Market Revenue Share (%), by Consumption Analysis 2024 & 2032
                                                              40. Figure 40: Europe Active Protection Systems Market Revenue (Million), by Import Market Analysis (Value & Volume) 2024 & 2032
                                                              41. Figure 41: Europe Active Protection Systems Market Revenue Share (%), by Import Market Analysis (Value & Volume) 2024 & 2032
                                                              42. Figure 42: Europe Active Protection Systems Market Revenue (Million), by Export Market Analysis (Value & Volume) 2024 & 2032
                                                              43. Figure 43: Europe Active Protection Systems Market Revenue Share (%), by Export Market Analysis (Value & Volume) 2024 & 2032
                                                              44. Figure 44: Europe Active Protection Systems Market Revenue (Million), by Price Trend Analysis 2024 & 2032
                                                              45. Figure 45: Europe Active Protection Systems Market Revenue Share (%), by Price Trend Analysis 2024 & 2032
                                                              46. Figure 46: Europe Active Protection Systems Market Revenue (Million), by Country 2024 & 2032
                                                              47. Figure 47: Europe Active Protection Systems Market Revenue Share (%), by Country 2024 & 2032
                                                              48. Figure 48: Middle East & Africa Active Protection Systems Market Revenue (Million), by Production Analysis 2024 & 2032
                                                              49. Figure 49: Middle East & Africa Active Protection Systems Market Revenue Share (%), by Production Analysis 2024 & 2032
                                                              50. Figure 50: Middle East & Africa Active Protection Systems Market Revenue (Million), by Consumption Analysis 2024 & 2032
                                                              51. Figure 51: Middle East & Africa Active Protection Systems Market Revenue Share (%), by Consumption Analysis 2024 & 2032
                                                              52. Figure 52: Middle East & Africa Active Protection Systems Market Revenue (Million), by Import Market Analysis (Value & Volume) 2024 & 2032
                                                              53. Figure 53: Middle East & Africa Active Protection Systems Market Revenue Share (%), by Import Market Analysis (Value & Volume) 2024 & 2032
                                                              54. Figure 54: Middle East & Africa Active Protection Systems Market Revenue (Million), by Export Market Analysis (Value & Volume) 2024 & 2032
                                                              55. Figure 55: Middle East & Africa Active Protection Systems Market Revenue Share (%), by Export Market Analysis (Value & Volume) 2024 & 2032
                                                              56. Figure 56: Middle East & Africa Active Protection Systems Market Revenue (Million), by Price Trend Analysis 2024 & 2032
                                                              57. Figure 57: Middle East & Africa Active Protection Systems Market Revenue Share (%), by Price Trend Analysis 2024 & 2032
                                                              58. Figure 58: Middle East & Africa Active Protection Systems Market Revenue (Million), by Country 2024 & 2032
                                                              59. Figure 59: Middle East & Africa Active Protection Systems Market Revenue Share (%), by Country 2024 & 2032
                                                              60. Figure 60: Asia Pacific Active Protection Systems Market Revenue (Million), by Production Analysis 2024 & 2032
                                                              61. Figure 61: Asia Pacific Active Protection Systems Market Revenue Share (%), by Production Analysis 2024 & 2032
                                                              62. Figure 62: Asia Pacific Active Protection Systems Market Revenue (Million), by Consumption Analysis 2024 & 2032
                                                              63. Figure 63: Asia Pacific Active Protection Systems Market Revenue Share (%), by Consumption Analysis 2024 & 2032
                                                              64. Figure 64: Asia Pacific Active Protection Systems Market Revenue (Million), by Import Market Analysis (Value & Volume) 2024 & 2032
                                                              65. Figure 65: Asia Pacific Active Protection Systems Market Revenue Share (%), by Import Market Analysis (Value & Volume) 2024 & 2032
                                                              66. Figure 66: Asia Pacific Active Protection Systems Market Revenue (Million), by Export Market Analysis (Value & Volume) 2024 & 2032
                                                              67. Figure 67: Asia Pacific Active Protection Systems Market Revenue Share (%), by Export Market Analysis (Value & Volume) 2024 & 2032
                                                              68. Figure 68: Asia Pacific Active Protection Systems Market Revenue (Million), by Price Trend Analysis 2024 & 2032
                                                              69. Figure 69: Asia Pacific Active Protection Systems Market Revenue Share (%), by Price Trend Analysis 2024 & 2032
                                                              70. Figure 70: Asia Pacific Active Protection Systems Market Revenue (Million), by Country 2024 & 2032
                                                              71. Figure 71: Asia Pacific Active Protection Systems Market Revenue Share (%), by Country 2024 & 2032

                                                              List of Tables

                                                              1. Table 1: Global Active Protection Systems Market Revenue Million Forecast, by Region 2019 & 2032
                                                              2. Table 2: Global Active Protection Systems Market Revenue Million Forecast, by Production Analysis 2019 & 2032
                                                              3. Table 3: Global Active Protection Systems Market Revenue Million Forecast, by Consumption Analysis 2019 & 2032
                                                              4. Table 4: Global Active Protection Systems Market Revenue Million Forecast, by Import Market Analysis (Value & Volume) 2019 & 2032
                                                              5. Table 5: Global Active Protection Systems Market Revenue Million Forecast, by Export Market Analysis (Value & Volume) 2019 & 2032
                                                              6. Table 6: Global Active Protection Systems Market Revenue Million Forecast, by Price Trend Analysis 2019 & 2032
                                                              7. Table 7: Global Active Protection Systems Market Revenue Million Forecast, by Region 2019 & 2032
                                                              8. Table 8: Global Active Protection Systems Market Revenue Million Forecast, by Country 2019 & 2032
                                                              9. Table 9: United States Active Protection Systems Market Revenue (Million) Forecast, by Application 2019 & 2032
                                                              10. Table 10: Canada Active Protection Systems Market Revenue (Million) Forecast, by Application 2019 & 2032
                                                              11. Table 11: Global Active Protection Systems Market Revenue Million Forecast, by Country 2019 & 2032
                                                              12. Table 12: United Kingdom Active Protection Systems Market Revenue (Million) Forecast, by Application 2019 & 2032
                                                              13. Table 13: France Active Protection Systems Market Revenue (Million) Forecast, by Application 2019 & 2032
                                                              14. Table 14: Germany Active Protection Systems Market Revenue (Million) Forecast, by Application 2019 & 2032
                                                              15. Table 15: Russia Active Protection Systems Market Revenue (Million) Forecast, by Application 2019 & 2032
                                                              16. Table 16: Rest of Europe Active Protection Systems Market Revenue (Million) Forecast, by Application 2019 & 2032
                                                              17. Table 17: Global Active Protection Systems Market Revenue Million Forecast, by Country 2019 & 2032
                                                              18. Table 18: China Active Protection Systems Market Revenue (Million) Forecast, by Application 2019 & 2032
                                                              19. Table 19: India Active Protection Systems Market Revenue (Million) Forecast, by Application 2019 & 2032
                                                              20. Table 20: Japan Active Protection Systems Market Revenue (Million) Forecast, by Application 2019 & 2032
                                                              21. Table 21: South Korea Active Protection Systems Market Revenue (Million) Forecast, by Application 2019 & 2032
                                                              22. Table 22: Rest of Asia Pacific Active Protection Systems Market Revenue (Million) Forecast, by Application 2019 & 2032
                                                              23. Table 23: Global Active Protection Systems Market Revenue Million Forecast, by Country 2019 & 2032
                                                              24. Table 24: Brazil Active Protection Systems Market Revenue (Million) Forecast, by Application 2019 & 2032
                                                              25. Table 25: Mexico Active Protection Systems Market Revenue (Million) Forecast, by Application 2019 & 2032
                                                              26. Table 26: Rest of Latin America Active Protection Systems Market Revenue (Million) Forecast, by Application 2019 & 2032
                                                              27. Table 27: Global Active Protection Systems Market Revenue Million Forecast, by Country 2019 & 2032
                                                              28. Table 28: United Arab Emirates Active Protection Systems Market Revenue (Million) Forecast, by Application 2019 & 2032
                                                              29. Table 29: Saudi Arabia Active Protection Systems Market Revenue (Million) Forecast, by Application 2019 & 2032
                                                              30. Table 30: Israel Active Protection Systems Market Revenue (Million) Forecast, by Application 2019 & 2032
                                                              31. Table 31: South Africa Active Protection Systems Market Revenue (Million) Forecast, by Application 2019 & 2032
                                                              32. Table 32: Rest of Middle East and Africa Active Protection Systems Market Revenue (Million) Forecast, by Application 2019 & 2032
                                                              33. Table 33: Global Active Protection Systems Market Revenue Million Forecast, by Production Analysis 2019 & 2032
                                                              34. Table 34: Global Active Protection Systems Market Revenue Million Forecast, by Consumption Analysis 2019 & 2032
                                                              35. Table 35: Global Active Protection Systems Market Revenue Million Forecast, by Import Market Analysis (Value & Volume) 2019 & 2032
                                                              36. Table 36: Global Active Protection Systems Market Revenue Million Forecast, by Export Market Analysis (Value & Volume) 2019 & 2032
                                                              37. Table 37: Global Active Protection Systems Market Revenue Million Forecast, by Price Trend Analysis 2019 & 2032
                                                              38. Table 38: Global Active Protection Systems Market Revenue Million Forecast, by Country 2019 & 2032
                                                              39. Table 39: United States Active Protection Systems Market Revenue (Million) Forecast, by Application 2019 & 2032
                                                              40. Table 40: Canada Active Protection Systems Market Revenue (Million) Forecast, by Application 2019 & 2032
                                                              41. Table 41: Mexico Active Protection Systems Market Revenue (Million) Forecast, by Application 2019 & 2032
                                                              42. Table 42: Global Active Protection Systems Market Revenue Million Forecast, by Production Analysis 2019 & 2032
                                                              43. Table 43: Global Active Protection Systems Market Revenue Million Forecast, by Consumption Analysis 2019 & 2032
                                                              44. Table 44: Global Active Protection Systems Market Revenue Million Forecast, by Import Market Analysis (Value & Volume) 2019 & 2032
                                                              45. Table 45: Global Active Protection Systems Market Revenue Million Forecast, by Export Market Analysis (Value & Volume) 2019 & 2032
                                                              46. Table 46: Global Active Protection Systems Market Revenue Million Forecast, by Price Trend Analysis 2019 & 2032
                                                              47. Table 47: Global Active Protection Systems Market Revenue Million Forecast, by Country 2019 & 2032
                                                              48. Table 48: Brazil Active Protection Systems Market Revenue (Million) Forecast, by Application 2019 & 2032
                                                              49. Table 49: Argentina Active Protection Systems Market Revenue (Million) Forecast, by Application 2019 & 2032
                                                              50. Table 50: Rest of South America Active Protection Systems Market Revenue (Million) Forecast, by Application 2019 & 2032
                                                              51. Table 51: Global Active Protection Systems Market Revenue Million Forecast, by Production Analysis 2019 & 2032
                                                              52. Table 52: Global Active Protection Systems Market Revenue Million Forecast, by Consumption Analysis 2019 & 2032
                                                              53. Table 53: Global Active Protection Systems Market Revenue Million Forecast, by Import Market Analysis (Value & Volume) 2019 & 2032
                                                              54. Table 54: Global Active Protection Systems Market Revenue Million Forecast, by Export Market Analysis (Value & Volume) 2019 & 2032
                                                              55. Table 55: Global Active Protection Systems Market Revenue Million Forecast, by Price Trend Analysis 2019 & 2032
                                                              56. Table 56: Global Active Protection Systems Market Revenue Million Forecast, by Country 2019 & 2032
                                                              57. Table 57: United Kingdom Active Protection Systems Market Revenue (Million) Forecast, by Application 2019 & 2032
                                                              58. Table 58: Germany Active Protection Systems Market Revenue (Million) Forecast, by Application 2019 & 2032
                                                              59. Table 59: France Active Protection Systems Market Revenue (Million) Forecast, by Application 2019 & 2032
                                                              60. Table 60: Italy Active Protection Systems Market Revenue (Million) Forecast, by Application 2019 & 2032
                                                              61. Table 61: Spain Active Protection Systems Market Revenue (Million) Forecast, by Application 2019 & 2032
                                                              62. Table 62: Russia Active Protection Systems Market Revenue (Million) Forecast, by Application 2019 & 2032
                                                              63. Table 63: Benelux Active Protection Systems Market Revenue (Million) Forecast, by Application 2019 & 2032
                                                              64. Table 64: Nordics Active Protection Systems Market Revenue (Million) Forecast, by Application 2019 & 2032
                                                              65. Table 65: Rest of Europe Active Protection Systems Market Revenue (Million) Forecast, by Application 2019 & 2032
                                                              66. Table 66: Global Active Protection Systems Market Revenue Million Forecast, by Production Analysis 2019 & 2032
                                                              67. Table 67: Global Active Protection Systems Market Revenue Million Forecast, by Consumption Analysis 2019 & 2032
                                                              68. Table 68: Global Active Protection Systems Market Revenue Million Forecast, by Import Market Analysis (Value & Volume) 2019 & 2032
                                                              69. Table 69: Global Active Protection Systems Market Revenue Million Forecast, by Export Market Analysis (Value & Volume) 2019 & 2032
                                                              70. Table 70: Global Active Protection Systems Market Revenue Million Forecast, by Price Trend Analysis 2019 & 2032
                                                              71. Table 71: Global Active Protection Systems Market Revenue Million Forecast, by Country 2019 & 2032
                                                              72. Table 72: Turkey Active Protection Systems Market Revenue (Million) Forecast, by Application 2019 & 2032
                                                              73. Table 73: Israel Active Protection Systems Market Revenue (Million) Forecast, by Application 2019 & 2032
                                                              74. Table 74: GCC Active Protection Systems Market Revenue (Million) Forecast, by Application 2019 & 2032
                                                              75. Table 75: North Africa Active Protection Systems Market Revenue (Million) Forecast, by Application 2019 & 2032
                                                              76. Table 76: South Africa Active Protection Systems Market Revenue (Million) Forecast, by Application 2019 & 2032
                                                              77. Table 77: Rest of Middle East & Africa Active Protection Systems Market Revenue (Million) Forecast, by Application 2019 & 2032
                                                              78. Table 78: Global Active Protection Systems Market Revenue Million Forecast, by Production Analysis 2019 & 2032
                                                              79. Table 79: Global Active Protection Systems Market Revenue Million Forecast, by Consumption Analysis 2019 & 2032
                                                              80. Table 80: Global Active Protection Systems Market Revenue Million Forecast, by Import Market Analysis (Value & Volume) 2019 & 2032
                                                              81. Table 81: Global Active Protection Systems Market Revenue Million Forecast, by Export Market Analysis (Value & Volume) 2019 & 2032
                                                              82. Table 82: Global Active Protection Systems Market Revenue Million Forecast, by Price Trend Analysis 2019 & 2032
                                                              83. Table 83: Global Active Protection Systems Market Revenue Million Forecast, by Country 2019 & 2032
                                                              84. Table 84: China Active Protection Systems Market Revenue (Million) Forecast, by Application 2019 & 2032
                                                              85. Table 85: India Active Protection Systems Market Revenue (Million) Forecast, by Application 2019 & 2032
                                                              86. Table 86: Japan Active Protection Systems Market Revenue (Million) Forecast, by Application 2019 & 2032
                                                              87. Table 87: South Korea Active Protection Systems Market Revenue (Million) Forecast, by Application 2019 & 2032
                                                              88. Table 88: ASEAN Active Protection Systems Market Revenue (Million) Forecast, by Application 2019 & 2032
                                                              89. Table 89: Oceania Active Protection Systems Market Revenue (Million) Forecast, by Application 2019 & 2032
                                                              90. Table 90: Rest of Asia Pacific Active Protection Systems Market Revenue (Million) Forecast, by Application 2019 & 2032


                                                              Frequently Asked Questions

                                                              1. What is the projected Compound Annual Growth Rate (CAGR) of the Active Protection Systems Market?

                                                              The projected CAGR is approximately 6.06%.

                                                              2. Which companies are prominent players in the Active Protection Systems Market?

                                                              Key companies in the market include THALES, General Dynamics Corporation, Rheinmetall AG, Elbit Systems Ltd, Kongsberg Gruppen ASA, Rostec State Corporatio, Rafael Advanced Defense Systems Ltd, RTX Corporation, Artis, Leonardo S p A, BAE Systems plc, Saab AB, ASELSAN A Ş.

                                                              3. What are the main segments of the Active Protection Systems Market?

                                                              The market segments include Production Analysis, Consumption Analysis, Import Market Analysis (Value & Volume), Export Market Analysis (Value & Volume), Price Trend Analysis.

                                                              4. Can you provide details about the market size?

                                                              The market size is estimated to be USD 4.23 Million as of 2022.

                                                              5. What are some drivers contributing to market growth?

                                                              ; Increasing Number Of Air Passengers; Use Of Portable Electronic Devices.

                                                              6. What are the notable trends driving market growth?

                                                              The Terrestrial Segment Holds Highest Shares in the Market.

                                                              7. Are there any restraints impacting market growth?

                                                              ; High Cost Of Connectivity Equipments.

                                                              8. Can you provide examples of recent developments in the market?

                                                              N/A

                                                              9. What pricing options are available for accessing the report?

                                                              Pricing options include single-user, multi-user, and enterprise licenses priced at USD 4750, USD 5250, and USD 8750 respectively.

                                                              10. Is the market size provided in terms of value or volume?

                                                              The market size is provided in terms of value, measured in Million.

                                                              11. Are there any specific market keywords associated with the report?

                                                              Yes, the market keyword associated with the report is "Active Protection Systems Market," which aids in identifying and referencing the specific market segment covered.

                                                              12. How do I determine which pricing option suits my needs best?

                                                              The pricing options vary based on user requirements and access needs. Individual users may opt for single-user licenses, while businesses requiring broader access may choose multi-user or enterprise licenses for cost-effective access to the report.

                                                              13. Are there any additional resources or data provided in the Active Protection Systems Market report?

                                                              While the report offers comprehensive insights, it's advisable to review the specific contents or supplementary materials provided to ascertain if additional resources or data are available.

                                                              14. How can I stay updated on further developments or reports in the Active Protection Systems Market?

                                                              To stay informed about further developments, trends, and reports in the Active Protection Systems Market, consider subscribing to industry newsletters, following relevant companies and organizations, or regularly checking reputable industry news sources and publications.


                                                              Methodology

                                                              Step 1 - Identification of Relevant Samples Size from Population Database

                                                              Step Chart
                                                              Bar Chart
                                                              Method Chart

                                                              Step 2 - Approaches for Defining Global Market Size (Value, Volume* & Price*)

                                                              Approach Chart
                                                              Top-down and bottom-up approaches are used to validate the global market size and estimate the market size for manufactures, regional segments, product, and application.

                                                              Note*: In applicable scenarios

                                                              Step 3 - Data Sources

                                                              Primary Research

                                                              • Web Analytics
                                                              • Survey Reports
                                                              • Research Institute
                                                              • Latest Research Reports
                                                              • Opinion Leaders

                                                              Secondary Research

                                                              • Annual Reports
                                                              • White Paper
                                                              • Latest Press Release
                                                              • Industry Association
                                                              • Paid Database
                                                              • Investor Presentations
                                                              Analyst Chart

                                                              Step 4 - Data Triangulation

                                                              Involves using different sources of information in order to increase the validity of a study

                                                              These sources are likely to be stakeholders in a program - participants, other researchers, program staff, other community members, and so on.

                                                              Then we put all data in single framework & apply various statistical tools to find out the dynamic on the market.

                                                              During the analysis stage, feedback from the stakeholder groups would be compared to determine areas of agreement as well as areas of divergence

                                                              Additionally, after gathering mixed and scattered data from a wide range of sources, data is triangulated and correlated to come up with estimated figures which are further validated through primary mediums or industry experts, opinion leaders.

                                                              About Research Axiom

                                                              Research Axiom delivers in-depth market research, industry analysis, and consulting for pharmaceuticals, automotive, IT, and consumer goods. Our reports provide the clarity you need to make informed decisions and drive innovation.

                                                              Our team combines primary research, advanced analytics, and sector expertise to deliver actionable intelligence. We offer syndicated reports, custom research, and consulting services tailored to your business needs.

                                                              At Research Axiom, we are committed to quality, transparency, and client satisfaction. Every report is rigorously validated to ensure accuracy and relevance. Our global perspective and local expertise help you understand both the big picture and the finer details of your market.

                                                              Stay informed with Research Axiom. Subscribe to our newsletter for the latest updates and research highlights, and follow us on social media for real-time insights. Research Axiom – Turning Data into Business Advantage.

                                                              artwork spiralartwork spiralRelated Reports
                                                              artwork underline

                                                              Southeast Asia, Middle-East And Africa Small Arms And Ammunition Market 2025-2033: Preparing for Growth and Change

                                                              The Southeast Asia, Middle East & Africa small arms and ammunition market is projected to reach \$1.07 billion by 2033, growing at a CAGR of 1.83%. This report analyzes market drivers, restraints, and key players, offering valuable insights into this dynamic sector. Explore regional breakdowns and future projections.

                                                              July 2025
                                                              Base Year: 2024
                                                              No Of Pages: 234
                                                              Price: $4750

                                                              Naval Combat Weapons Market Strategic Roadmap: Analysis and Forecasts 2025-2033

                                                              The Naval Combat Weapons market is booming, projected to reach $XX million by 2033 with a 4% CAGR. This comprehensive analysis explores market drivers, trends, restraints, and key players like General Dynamics and Lockheed Martin, covering segments like underwater and surface-based weapons across diverse regions. Discover the future of naval warfare technology.

                                                              July 2025
                                                              Base Year: 2024
                                                              No Of Pages: 234
                                                              Price: $4750

                                                              Target Acquisition Systems Market Report 2025: Growth Driven by Government Incentives and Partnerships

                                                              Discover the explosive growth in the Target Acquisition Systems market, projected to exceed a 5.5% CAGR through 2033. This in-depth analysis reveals key drivers, market segments (land, airborne, naval), leading companies, and regional trends. Learn how technological advancements and geopolitical factors are shaping this lucrative sector.

                                                              July 2025
                                                              Base Year: 2024
                                                              No Of Pages: 234
                                                              Price: $4750

                                                              Aerospace Plastics Industry Market Outlook and Strategic Insights

                                                              The Aerospace Plastics Market is booming, projected to reach $25 billion by 2033 at a CAGR of 7.66%. Driven by lightweighting and fuel efficiency demands, this report analyzes market trends, key players (Premium AEROTEC, Toray Industries), regional growth (North America, Asia-Pacific), and segment applications (aerostructures, cabin interiors). Discover insights into this rapidly expanding sector.

                                                              July 2025
                                                              Base Year: 2024
                                                              No Of Pages: 234
                                                              Price: $4750

                                                              Challenges to Overcome in Commercial Airport Lighting Market Market Growth: Analysis 2025-2033

                                                              The commercial airport lighting market is booming, projected to reach [estimated 2033 market size] by 2033, driven by LED adoption and infrastructure expansion. Learn about market trends, key players (Honeywell, ADB SAFEGATE, etc.), and regional growth in this in-depth analysis.

                                                              July 2025
                                                              Base Year: 2024
                                                              No Of Pages: 234
                                                              Price: $4750

                                                              North America Small Satellite Market 2025-2033 Trends: Unveiling Growth Opportunities and Competitor Dynamics

                                                              The North American small satellite market is booming, with a projected CAGR of 5.18% through 2033. Driven by commercial and government demand for Earth observation, communication, and navigation, this report analyzes market size, key players (SpaceX, Swarm Technologies, etc.), and emerging trends in LEO, GEO, and MEO satellite technology. Discover the opportunities and challenges shaping this dynamic sector.

                                                              July 2025
                                                              Base Year: 2024
                                                              No Of Pages: 197
                                                              Price: $3800

                                                              Aircraft Door Market CAGR Growth Drivers and Trends: Forecasts 2025-2033

                                                              The aircraft door market is booming, projected to reach $8.48 billion by 2033 at a CAGR of 5.69%. This in-depth analysis explores market drivers, trends, restraints, segmentation (commercial, military, general aviation; passenger, cargo, emergency doors), key players (Safran, Collins Aerospace, etc.), and regional growth forecasts. Discover the opportunities and challenges shaping this dynamic sector.

                                                              July 2025
                                                              Base Year: 2024
                                                              No Of Pages: 234
                                                              Price: $4750

                                                              Future-Forward Strategies for EMEA Aviation Infrastructure Industry Industry

                                                              The EMEA aviation infrastructure market is booming, projected to reach $1.47 billion by 2033 with a 4.42% CAGR. Discover key market trends, drivers, restraints, and major players shaping this dynamic sector. Explore regional breakdowns and infrastructure segment analyses.

                                                              July 2025
                                                              Base Year: 2024
                                                              No Of Pages: 234
                                                              Price: $4750

                                                              APAC Military Aircraft Modernization and Retrofit Market 2025 Market Trends and 2033 Forecasts: Exploring Growth Potential

                                                              The APAC military aircraft modernization and retrofit market is booming, projected to reach $13.71 billion by 2025, driven by geopolitical tensions and technological advancements. Learn about key market trends, major players, and growth forecasts until 2033.

                                                              July 2025
                                                              Base Year: 2024
                                                              No Of Pages: 197
                                                              Price: $3800

                                                              Future-Ready Strategies for North America Charter Jet Services Market Market Growth

                                                              The North America charter jet services market is booming, projected to reach \$24.2 billion by 2033 with a 9.1% CAGR. Discover key trends, drivers, and leading companies shaping this lucrative private aviation sector. Learn about market segmentation by aircraft size and regional analysis focusing on the US, Canada, and Mexico.

                                                              July 2025
                                                              Base Year: 2024
                                                              No Of Pages: 234
                                                              Price: $4750

                                                              Middle East Aviation Market Report Probes the XXX Million Size, Share, Growth Report and Future Analysis by 2033

                                                              The Middle East aviation market, a $27.18 billion industry in 2025, is booming. Discover key trends, growth drivers (tourism, infrastructure investments), and leading companies shaping this rapidly expanding sector with a projected 4.40% CAGR until 2033. Explore regional market shares and future projections for commercial, military, and general aviation.

                                                              July 2025
                                                              Base Year: 2024
                                                              No Of Pages: 234
                                                              Price: $4750

                                                              Commercial Airport Radar Systems Industry Future-proof Strategies: Trends, Competitor Dynamics, and Opportunities 2025-2033

                                                              The Commercial Airport Radar Systems market is booming, projected to reach $5.98B in 2025 with a 7.48% CAGR. Discover key trends, drivers, restraints, and leading companies shaping this vital sector for air traffic management. Learn about market segmentation by application (surveillance, weather, approach radars) and regional analysis.

                                                              July 2025
                                                              Base Year: 2024
                                                              No Of Pages: 234
                                                              Price: $4750

                                                              Market Deep Dive: Exploring Defense Aircraft Materials Market Trends 2025-2033

                                                              Discover the booming defense aircraft materials market! This comprehensive analysis reveals key trends, drivers, and restraints impacting growth through 2033, covering materials like aluminum alloys, titanium, and composites, and major players like Toray and DuPont. Explore regional market shares and forecast data.

                                                              July 2025
                                                              Base Year: 2024
                                                              No Of Pages: 234
                                                              Price: $4750

                                                              Future Trends Shaping Naval ISR Market Growth

                                                              Discover the booming Naval ISR market, projected to reach $XX million by 2033 with a 3.5% CAGR. Explore market drivers, trends, and key players like Lockheed Martin and General Dynamics. Learn about regional growth in North America, Europe, and Asia-Pacific. Get the insights you need for strategic planning.

                                                              July 2025
                                                              Base Year: 2024
                                                              No Of Pages: 234
                                                              Price: $4750

                                                              Latin America Inflight Services Market Market’s Growth Blueprint

                                                              Discover the booming Latin American inflight services market! This comprehensive analysis reveals a $1.11B market in 2025, projecting 9.91% CAGR growth to 2033. Explore key drivers, trends, and challenges impacting airlines, catering companies, and passenger experiences. Learn about market segmentation, leading players, and regional opportunities.

                                                              July 2025
                                                              Base Year: 2024
                                                              No Of Pages: 234
                                                              Price: $4750

                                                              Airport Ground Handling Vehicles Industry 2025-2033 Trends: Unveiling Growth Opportunities and Competitor Dynamics

                                                              The Airport Ground Handling Vehicles market is booming, projected to reach $8.94B by 2025 with a 5.99% CAGR. Discover key trends, drivers, and restraints shaping this industry, including the rise of electric vehicles and regional market analysis. Learn about leading companies and future growth forecasts.

                                                              July 2025
                                                              Base Year: 2024
                                                              No Of Pages: 234
                                                              Price: $4750

                                                              Exploring Opportunities in Naval Gas Turbine Market Sector

                                                              Discover the booming Naval Gas Turbine Market, projected to reach $X million by 2033 with a CAGR exceeding 7.80%. Explore market drivers, trends, restraints, key players (GE, Rolls Royce, Mitsubishi), and regional analysis (North America, Europe, Asia-Pacific). Get the insights you need to navigate this high-growth sector.

                                                              July 2025
                                                              Base Year: 2024
                                                              No Of Pages: 234
                                                              Price: $4750

                                                              Middle East Civil Aviation Flight Training and Simulation Market in Emerging Markets: Analysis and Projections 2025-2033

                                                              The Middle East Civil Aviation Flight Training & Simulation Market is booming, with a CAGR exceeding 15%! Discover key trends, drivers, restraints, and leading companies shaping this lucrative sector. Explore market size projections to 2033 and regional breakdowns for the UAE, Saudi Arabia, and more.

                                                              July 2025
                                                              Base Year: 2024
                                                              No Of Pages: 234
                                                              Price: $4750

                                                              Aircraft Winglets Market Market Expansion: Growth Outlook 2025-2033

                                                              The Aircraft Winglets Market is booming, projected to reach \$4.78 billion by 2033, with a CAGR of 7.90%. This report analyzes market drivers, trends, and key players like Aviation Partners Boeing and BLR Aerospace, offering insights into fuel-efficient aviation technologies.

                                                              July 2025
                                                              Base Year: 2024
                                                              No Of Pages: 234
                                                              Price: $4750

                                                              SATCOM Industry Market Expansion Strategies

                                                              The global SATCOM market is booming, with a projected 23.54% CAGR through 2033. Driven by IoT, cloud computing, and government initiatives, this report analyzes market size, segments (LEO, GEO, MEO, satellite mass), key players (SpaceX, Intelsat, Airbus), and regional trends. Discover the future of satellite communication!

                                                              July 2025
                                                              Base Year: 2024
                                                              No Of Pages: 197
                                                              Price: $3800
                                                              • Home
                                                              • About Us
                                                              • Industries
                                                                • Aerospace & Defense
                                                                • Agriculture
                                                                • Animal Nutrition & Wellness
                                                                • Automotive
                                                                • Chemicals & Materials
                                                                • Consumer Goods and Services
                                                                • Energy & Power
                                                                • Financial Services and Investment Intelligence
                                                                • Food & Beverage
                                                                • Home and Property Improvement
                                                                • Hospitality and Tourism
                                                                • Logistics
                                                                • Manufacturing Products and Services
                                                                • Packaging
                                                                • Professional and Commercial Services
                                                                • Real Estate and Construction
                                                                • Retail
                                                                • Technology, Media and Telecom
                                                                • Healthcare
                                                              • Services
                                                              • Contact
                                                              Main Logo
                                                              • Home
                                                              • About Us
                                                              • Industries
                                                                • Aerospace & Defense
                                                                • Agriculture
                                                                • Animal Nutrition & Wellness
                                                                • Automotive
                                                                • Chemicals & Materials
                                                                • Consumer Goods and Services
                                                                • Energy & Power
                                                                • Financial Services and Investment Intelligence
                                                                • Food & Beverage
                                                                • Home and Property Improvement
                                                                • Hospitality and Tourism
                                                                • Logistics
                                                                • Manufacturing Products and Services
                                                                • Packaging
                                                                • Professional and Commercial Services
                                                                • Real Estate and Construction
                                                                • Retail
                                                                • Technology, Media and Telecom
                                                                • Healthcare
                                                              • Services
                                                              • Contact
                                                              +17162654855
                                                              [email protected]

                                                              +17162654855

                                                              [email protected]

                                                              Business Address

                                                              Head Office

                                                              Office no. A 5010, fifth floor, Solitaire Business Hub, Near Phoenix mall, Pune, Maharashtra 411014

                                                              Contact Information

                                                              Craig Francis

                                                              Business Development Head

                                                              +17162654855

                                                              [email protected]

                                                              Connect With Us

                                                              Secure Payment Partners

                                                              payment image
                                                              RetailLogisticsPackagingAutomotiveHealthcareAgricultureEnergy & PowerFood & BeverageAerospace & DefenseChemicals & MaterialsHospitality and TourismAnimal Nutrition & WellnessConsumer Goods and ServicesReal Estate and ConstructionHome and Property ImprovementTechnology, Media and TelecomManufacturing Products and ServicesFinancial Services and Investment Intelligence

                                                              © 2025 All rights reserved


                                                              Privacy Policy
                                                              Terms and Conditions
                                                              FAQ