
Key Insights
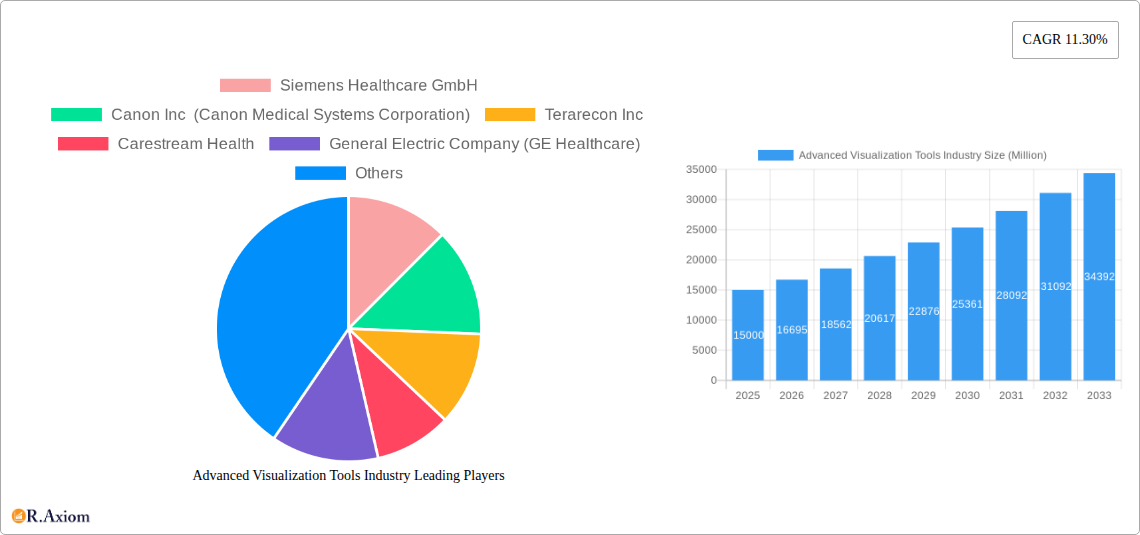
The advanced visualization tools market is experiencing robust growth, driven by the increasing adoption of medical imaging technologies across healthcare settings. A compound annual growth rate (CAGR) of 11.30% from 2019 to 2024 suggests a significant expansion, likely fueled by factors such as the rising prevalence of chronic diseases necessitating advanced diagnostic tools, technological advancements leading to improved image quality and processing speeds, and the growing demand for minimally invasive procedures. The market segmentation reveals a strong emphasis on Magnetic Resonance Imaging (MRI) and Computed Tomography (CT) within imaging modalities, with oncology and cardiology leading clinical applications. The strong presence of established players like Siemens Healthcare, GE Healthcare, and Philips underscores the market's maturity and potential for further consolidation. The substantial investments in research and development by these companies, aimed at improving image resolution, enhancing diagnostic accuracy, and developing AI-powered analysis tools, further contribute to market expansion. The enterprise segment within the type of solution category likely dominates due to the substantial investment required for infrastructure and maintenance.
Looking forward, several trends will shape the market's trajectory. The increasing integration of artificial intelligence (AI) and machine learning (ML) for image analysis and interpretation will significantly enhance diagnostic accuracy and efficiency. Cloud-based solutions are also gaining traction, offering scalability, accessibility, and cost-effectiveness. However, challenges remain, such as the high initial investment costs associated with advanced visualization tools and the need for skilled professionals to operate and interpret the resulting images. Despite these restraints, the long-term outlook for the advanced visualization tools market remains positive, driven by continuous technological innovation, the expanding healthcare sector, and an aging global population requiring more advanced diagnostics. Geographic growth will likely be concentrated in regions with expanding healthcare infrastructure and increasing adoption of advanced medical technologies, such as North America and Asia-Pacific.
This comprehensive report provides an in-depth analysis of the Advanced Visualization Tools industry, covering market size, segmentation, growth drivers, challenges, and key players. The study period spans from 2019 to 2033, with 2025 serving as the base and estimated year. The forecast period is 2025-2033, and the historical period is 2019-2024. The report offers actionable insights for industry stakeholders, including manufacturers, healthcare providers, and investors. The total market size in 2025 is estimated at xx Million.
Advanced Visualization Tools Industry Market Concentration & Innovation
The Advanced Visualization Tools industry is characterized by a moderately concentrated market, with a few major players holding significant market share. Siemens Healthcare GmbH, General Electric Company (GE Healthcare), and Koninklijke Philips NV are among the leading companies, collectively accounting for an estimated xx% of the global market in 2025. Market concentration is influenced by factors such as high capital expenditure requirements for research and development, stringent regulatory approvals, and the need for specialized expertise.
Innovation is a key driver in this industry, with continuous advancements in imaging technologies, software algorithms, and data analytics capabilities. Companies are investing heavily in developing AI-powered diagnostic tools, cloud-based image management systems, and advanced visualization platforms to enhance diagnostic accuracy, improve workflow efficiency, and reduce costs.
Regulatory frameworks, including those related to data privacy and medical device approvals, play a crucial role in shaping industry dynamics. The presence of substitute technologies, such as traditional imaging techniques, also impacts market competition. End-user trends, such as the increasing adoption of minimally invasive procedures and the growing demand for personalized medicine, are driving demand for advanced visualization tools. M&A activities have also played a significant role in consolidating the market, with several large deals concluded in recent years with a total value exceeding xx Million in the last five years. Specific deal values are not publicly available for all transactions.
- Market Share: Top 3 players hold approximately xx% of the market.
- M&A Activity: xx Million in deal value over the last five years.
- Key Innovation Drivers: AI, Cloud Computing, Advanced Algorithms.
Advanced Visualization Tools Industry Industry Trends & Insights
The Advanced Visualization Tools market is experiencing robust growth, driven by several key factors. The increasing prevalence of chronic diseases, coupled with the aging global population, is fueling demand for advanced diagnostic and therapeutic solutions. Technological advancements, such as the development of high-resolution imaging systems and advanced visualization software, are enhancing diagnostic accuracy and enabling more precise treatment planning. Moreover, the rising adoption of minimally invasive surgical procedures is creating a significant opportunity for advanced visualization technologies.
The market's growth is further propelled by the growing demand for improved healthcare infrastructure, particularly in emerging economies. Government initiatives aimed at enhancing healthcare access and quality are also contributing to market expansion. The COVID-19 pandemic significantly accelerated the adoption of telehealth and remote diagnostics, spurring the growth of cloud-based visualization platforms and remote collaboration tools. However, challenges such as high costs associated with equipment and software, stringent regulatory approvals, and data security concerns could potentially limit market growth in specific geographic regions.
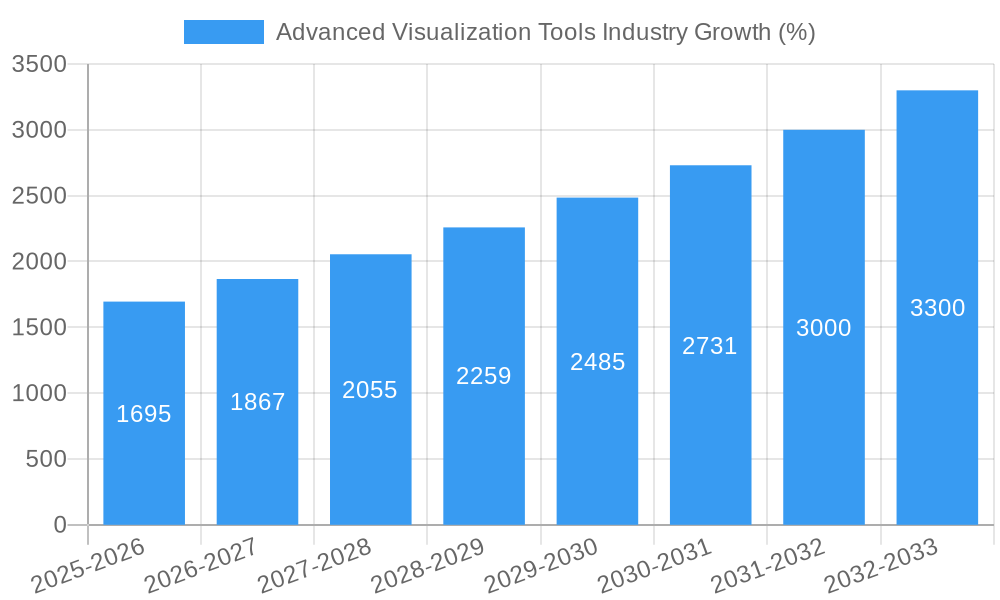
The industry is witnessing increasing competition among established players and new entrants. Companies are adopting various strategies, including product innovation, strategic partnerships, and acquisitions, to gain a competitive edge. The market is expected to exhibit a Compound Annual Growth Rate (CAGR) of xx% during the forecast period (2025-2033), with significant penetration in developed markets.
Dominant Markets & Segments in Advanced Visualization Tools Industry
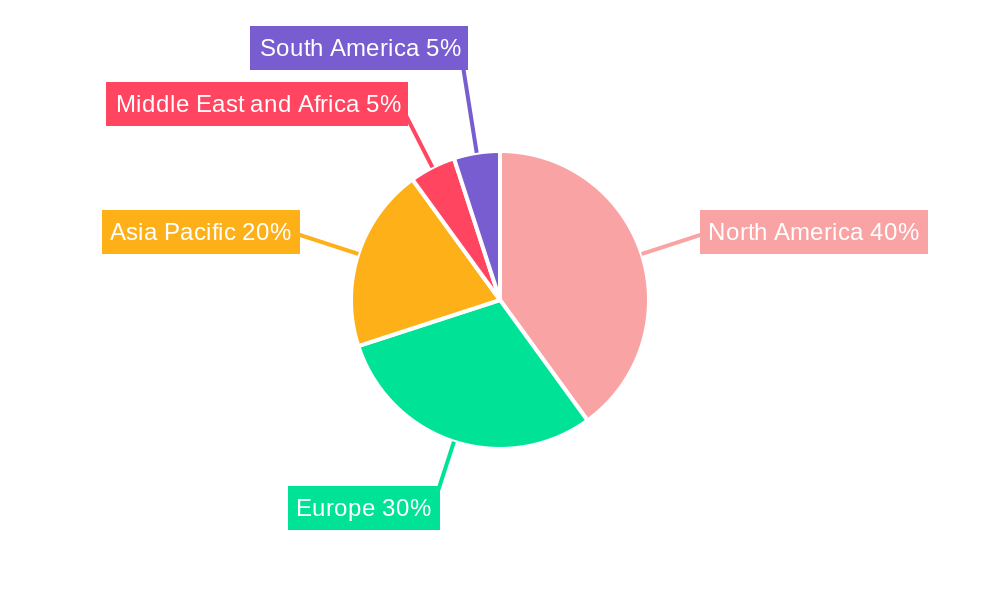
The North American region holds the largest market share in the Advanced Visualization Tools industry, driven by factors such as high healthcare expenditure, advanced healthcare infrastructure, and early adoption of new technologies. Within this region, the United States and Canada are significant contributors.
Key Drivers by Segment:
Imaging Modality:
- MRI: High resolution, detailed anatomical views, driving growth in oncology and neurology.
- CT: Rapid imaging, wide availability, strong demand in trauma and cardiovascular applications.
- Ultrasound: Cost-effective, portable, widely used in point-of-care settings and various specialties.
- Nuclear Medicine: Specialized applications, growth driven by advancements in PET/CT technology.
- Other Imaging Modalities: Including PET, SPECT, etc., niche but growing market.
Clinical Application:
- Oncology: Strong demand due to the increasing prevalence of cancer and the need for precise diagnosis and treatment.
- Orthopedics: Growing adoption of advanced imaging techniques for minimally invasive surgeries and fracture analysis.
- Cardiovascular: Essential in diagnosis and treatment planning for heart-related conditions.
- Neurology: Critical for diagnosis and monitoring of neurological disorders.
- Other Clinical Applications: Diverse applications across various medical specialties.
Product and Service:
- Hardware: High initial investment, leading to market dominance by established players.
- Software: Increasing adoption of advanced analytics and AI driving growth.
- Services: Including installation, maintenance, and training, supporting hardware and software sales.
Type of Solution:
- Enterprise: Large hospitals and imaging centers are the main clients; high capital expenditure drives market concentration.
- Standalone: Smaller clinics and private practices, offer scalability and flexibility.
The growth in each segment is influenced by factors such as technological advancements, regulatory approvals, reimbursement policies, and clinical adoption rates.
Advanced Visualization Tools Industry Product Developments
Recent product developments in the advanced visualization tools industry are focused on enhancing image quality, improving workflow efficiency, and integrating artificial intelligence for advanced analytics. New products include AI-powered diagnostic tools for automated image analysis and improved diagnostic accuracy, cloud-based image management systems for enhanced collaboration and data accessibility, and advanced visualization platforms with intuitive user interfaces and enhanced 3D rendering capabilities. These innovations address the growing needs for improved diagnostic accuracy, streamlined workflows, and enhanced collaboration among healthcare professionals. The market fit is strong, driven by the demand for faster, more accurate, and more efficient diagnostic solutions.
Report Scope & Segmentation Analysis
This report segments the Advanced Visualization Tools market by imaging modality (MRI, CT, Ultrasound, Nuclear Medicine, Other), clinical application (Oncology, Orthopedics, Cardiovascular, Neurology, Other), product and service (Hardware, Software, Services), and type of solution (Enterprise, Standalone). Each segment is analyzed in detail, providing insights into market size, growth projections, and competitive dynamics. Growth projections vary significantly across segments, reflecting differing technological advancements, regulatory landscapes, and clinical adoption rates. The competitive dynamics are shaped by factors such as the presence of established players, the emergence of new entrants, and the pace of technological innovation.
Key Drivers of Advanced Visualization Tools Industry Growth
Several factors drive the growth of the Advanced Visualization Tools industry. Technological advancements, such as the development of AI-powered diagnostic tools and cloud-based image management systems, are improving diagnostic accuracy, workflow efficiency, and data accessibility. Economic factors, including increasing healthcare expenditure and the rising adoption of advanced medical technologies, are boosting market demand. Regulatory factors, such as government initiatives to improve healthcare infrastructure and support the adoption of innovative medical technologies, are creating favorable market conditions. The growing prevalence of chronic diseases and the aging global population further enhance demand for sophisticated imaging solutions.
Challenges in the Advanced Visualization Tools Industry Sector
Several challenges hinder growth in this sector. High costs associated with advanced imaging equipment and software can limit accessibility, particularly in resource-constrained settings. Stringent regulatory approvals for medical devices can delay product launches and increase development costs. Supply chain disruptions, particularly in the manufacturing of specialized components, may affect the availability and pricing of advanced visualization tools. Intense competition among established players and new entrants can exert pressure on pricing and profitability. These factors together can significantly impact the overall market growth.
Emerging Opportunities in Advanced Visualization Tools Industry
Emerging opportunities exist in areas such as the development of AI-powered diagnostic tools for improved accuracy and efficiency, the integration of cloud-based platforms for enhanced collaboration and data management, and the expansion of advanced visualization technologies into emerging markets. The increasing adoption of minimally invasive surgical procedures presents significant growth potential for advanced visualization tools. Personalized medicine approaches, demanding precise and detailed imaging, will also drive demand. Furthermore, the integration of virtual and augmented reality technologies offers exciting possibilities for improved medical training and surgical planning.
Leading Players in the Advanced Visualization Tools Industry Market
- Siemens Healthcare GmbH
- Canon Inc (Canon Medical Systems Corporation)
- Terarecon Inc
- Carestream Health
- General Electric Company (GE Healthcare)
- Koninklijke Philips NV
- Pro Medicus Ltd
- Agfa-Gevaert Group
- Fujifilm Holdings Corporation
Key Developments in Advanced Visualization Tools Industry Industry
February 2022: Siemens Healthineers and Universal Medical Imaging partnered to improve image screening and diagnosis efficiency in Chinese primary healthcare institutions using advanced imaging equipment and remote assistant tools. This highlights the growing adoption of telehealth and remote diagnostics.
August 2022: Kitware launched MIQA, a cloud-based medical image quality assurance application. This emphasizes the increasing importance of cloud-based solutions for collaboration and data management in geographically dispersed healthcare settings.
Strategic Outlook for Advanced Visualization Tools Industry Market
The Advanced Visualization Tools industry is poised for continued growth, driven by technological advancements, increasing healthcare expenditure, and a growing demand for improved diagnostic and therapeutic solutions. Future market potential is significant, particularly in emerging markets and applications leveraging AI and cloud technologies. Opportunities exist for companies that can innovate, adapt to evolving regulatory environments, and effectively address the challenges of cost, accessibility, and data security. The focus will continue to be on enhancing image quality, improving workflow efficiency, and developing AI-powered diagnostic tools.
Advanced Visualization Tools Industry Segmentation
-
1. Product and Service
- 1.1. Hardware
- 1.2. Software
- 1.3. Services
-
2. Type of Solution
- 2.1. Enterprise
- 2.2. Standalone
-
3. Imaging Modality
- 3.1. Magnetic Resonance Imaging (MRI)
- 3.2. Computed Tomography (CT)
- 3.3. Ultrasound
- 3.4. Nuclear Medicine
- 3.5. Other Imaging Modalities
-
4. Clinical Application
- 4.1. Oncology
- 4.2. Orthopedics
- 4.3. Cardiovascular
- 4.4. Neurology
- 4.5. Other Clinical Applications
Advanced Visualization Tools Industry Segmentation By Geography
-
1. North America
- 1.1. United States
- 1.2. Canada
- 1.3. Mexico
-
2. Europe
- 2.1. Germany
- 2.2. United Kingdom
- 2.3. France
- 2.4. Italy
- 2.5. Spain
- 2.6. Rest of Europe
-
3. Asia Pacific
- 3.1. China
- 3.2. Japan
- 3.3. India
- 3.4. Australia
- 3.5. South Korea
- 3.6. Rest of Asia Pacific
-
4. Middle East and Africa
- 4.1. GCC
- 4.2. South Africa
- 4.3. Rest of Middle East and Africa
-
5. South America
- 5.1. Brazil
- 5.2. Argentina
- 5.3. Rest of South America
Advanced Visualization Tools Industry REPORT HIGHLIGHTS
| Aspects | Details |
|---|---|
| Study Period | 2019-2033 |
| Base Year | 2024 |
| Estimated Year | 2025 |
| Forecast Period | 2025-2033 |
| Historical Period | 2019-2024 |
| Growth Rate | CAGR of 11.30% from 2019-2033 |
| Segmentation |
|
Table of Contents
- 1. Introduction
- 1.1. Research Scope
- 1.2. Market Segmentation
- 1.3. Research Methodology
- 1.4. Definitions and Assumptions
- 2. Executive Summary
- 2.1. Introduction
- 3. Market Dynamics
- 3.1. Introduction
- 3.2. Market Drivers
- 3.2.1. Increasing Prevalence of Chronic Diseases Coupled With Growing Geriatric Population; Rising Awareness of Benefits associated with Advanced Visualization Tools in Disease Diagnosis
- 3.3. Market Restrains
- 3.3.1. Limited Availability of Reimbursements for Radiology-Based Diagnostic Procedures
- 3.4. Market Trends
- 3.4.1. Oncology Under Clinical Application Expected to Grow Over the Forecast Period
- 4. Market Factor Analysis
- 4.1. Porters Five Forces
- 4.2. Supply/Value Chain
- 4.3. PESTEL analysis
- 4.4. Market Entropy
- 4.5. Patent/Trademark Analysis
- 5. Global Advanced Visualization Tools Industry Analysis, Insights and Forecast, 2019-2031
- 5.1. Market Analysis, Insights and Forecast - by Product and Service
- 5.1.1. Hardware
- 5.1.2. Software
- 5.1.3. Services
- 5.2. Market Analysis, Insights and Forecast - by Type of Solution
- 5.2.1. Enterprise
- 5.2.2. Standalone
- 5.3. Market Analysis, Insights and Forecast - by Imaging Modality
- 5.3.1. Magnetic Resonance Imaging (MRI)
- 5.3.2. Computed Tomography (CT)
- 5.3.3. Ultrasound
- 5.3.4. Nuclear Medicine
- 5.3.5. Other Imaging Modalities
- 5.4. Market Analysis, Insights and Forecast - by Clinical Application
- 5.4.1. Oncology
- 5.4.2. Orthopedics
- 5.4.3. Cardiovascular
- 5.4.4. Neurology
- 5.4.5. Other Clinical Applications
- 5.5. Market Analysis, Insights and Forecast - by Region
- 5.5.1. North America
- 5.5.2. Europe
- 5.5.3. Asia Pacific
- 5.5.4. Middle East and Africa
- 5.5.5. South America
- 5.1. Market Analysis, Insights and Forecast - by Product and Service
- 6. North America Advanced Visualization Tools Industry Analysis, Insights and Forecast, 2019-2031
- 6.1. Market Analysis, Insights and Forecast - by Product and Service
- 6.1.1. Hardware
- 6.1.2. Software
- 6.1.3. Services
- 6.2. Market Analysis, Insights and Forecast - by Type of Solution
- 6.2.1. Enterprise
- 6.2.2. Standalone
- 6.3. Market Analysis, Insights and Forecast - by Imaging Modality
- 6.3.1. Magnetic Resonance Imaging (MRI)
- 6.3.2. Computed Tomography (CT)
- 6.3.3. Ultrasound
- 6.3.4. Nuclear Medicine
- 6.3.5. Other Imaging Modalities
- 6.4. Market Analysis, Insights and Forecast - by Clinical Application
- 6.4.1. Oncology
- 6.4.2. Orthopedics
- 6.4.3. Cardiovascular
- 6.4.4. Neurology
- 6.4.5. Other Clinical Applications
- 6.1. Market Analysis, Insights and Forecast - by Product and Service
- 7. Europe Advanced Visualization Tools Industry Analysis, Insights and Forecast, 2019-2031
- 7.1. Market Analysis, Insights and Forecast - by Product and Service
- 7.1.1. Hardware
- 7.1.2. Software
- 7.1.3. Services
- 7.2. Market Analysis, Insights and Forecast - by Type of Solution
- 7.2.1. Enterprise
- 7.2.2. Standalone
- 7.3. Market Analysis, Insights and Forecast - by Imaging Modality
- 7.3.1. Magnetic Resonance Imaging (MRI)
- 7.3.2. Computed Tomography (CT)
- 7.3.3. Ultrasound
- 7.3.4. Nuclear Medicine
- 7.3.5. Other Imaging Modalities
- 7.4. Market Analysis, Insights and Forecast - by Clinical Application
- 7.4.1. Oncology
- 7.4.2. Orthopedics
- 7.4.3. Cardiovascular
- 7.4.4. Neurology
- 7.4.5. Other Clinical Applications
- 7.1. Market Analysis, Insights and Forecast - by Product and Service
- 8. Asia Pacific Advanced Visualization Tools Industry Analysis, Insights and Forecast, 2019-2031
- 8.1. Market Analysis, Insights and Forecast - by Product and Service
- 8.1.1. Hardware
- 8.1.2. Software
- 8.1.3. Services
- 8.2. Market Analysis, Insights and Forecast - by Type of Solution
- 8.2.1. Enterprise
- 8.2.2. Standalone
- 8.3. Market Analysis, Insights and Forecast - by Imaging Modality
- 8.3.1. Magnetic Resonance Imaging (MRI)
- 8.3.2. Computed Tomography (CT)
- 8.3.3. Ultrasound
- 8.3.4. Nuclear Medicine
- 8.3.5. Other Imaging Modalities
- 8.4. Market Analysis, Insights and Forecast - by Clinical Application
- 8.4.1. Oncology
- 8.4.2. Orthopedics
- 8.4.3. Cardiovascular
- 8.4.4. Neurology
- 8.4.5. Other Clinical Applications
- 8.1. Market Analysis, Insights and Forecast - by Product and Service
- 9. Middle East and Africa Advanced Visualization Tools Industry Analysis, Insights and Forecast, 2019-2031
- 9.1. Market Analysis, Insights and Forecast - by Product and Service
- 9.1.1. Hardware
- 9.1.2. Software
- 9.1.3. Services
- 9.2. Market Analysis, Insights and Forecast - by Type of Solution
- 9.2.1. Enterprise
- 9.2.2. Standalone
- 9.3. Market Analysis, Insights and Forecast - by Imaging Modality
- 9.3.1. Magnetic Resonance Imaging (MRI)
- 9.3.2. Computed Tomography (CT)
- 9.3.3. Ultrasound
- 9.3.4. Nuclear Medicine
- 9.3.5. Other Imaging Modalities
- 9.4. Market Analysis, Insights and Forecast - by Clinical Application
- 9.4.1. Oncology
- 9.4.2. Orthopedics
- 9.4.3. Cardiovascular
- 9.4.4. Neurology
- 9.4.5. Other Clinical Applications
- 9.1. Market Analysis, Insights and Forecast - by Product and Service
- 10. South America Advanced Visualization Tools Industry Analysis, Insights and Forecast, 2019-2031
- 10.1. Market Analysis, Insights and Forecast - by Product and Service
- 10.1.1. Hardware
- 10.1.2. Software
- 10.1.3. Services
- 10.2. Market Analysis, Insights and Forecast - by Type of Solution
- 10.2.1. Enterprise
- 10.2.2. Standalone
- 10.3. Market Analysis, Insights and Forecast - by Imaging Modality
- 10.3.1. Magnetic Resonance Imaging (MRI)
- 10.3.2. Computed Tomography (CT)
- 10.3.3. Ultrasound
- 10.3.4. Nuclear Medicine
- 10.3.5. Other Imaging Modalities
- 10.4. Market Analysis, Insights and Forecast - by Clinical Application
- 10.4.1. Oncology
- 10.4.2. Orthopedics
- 10.4.3. Cardiovascular
- 10.4.4. Neurology
- 10.4.5. Other Clinical Applications
- 10.1. Market Analysis, Insights and Forecast - by Product and Service
- 11. North America Advanced Visualization Tools Industry Analysis, Insights and Forecast, 2019-2031
- 11.1. Market Analysis, Insights and Forecast - By Country/Sub-region
- 11.1.1 United States
- 11.1.2 Canada
- 11.1.3 Mexico
- 12. Europe Advanced Visualization Tools Industry Analysis, Insights and Forecast, 2019-2031
- 12.1. Market Analysis, Insights and Forecast - By Country/Sub-region
- 12.1.1 Germany
- 12.1.2 United Kingdom
- 12.1.3 France
- 12.1.4 Italy
- 12.1.5 Spain
- 12.1.6 Rest of Europe
- 13. Asia Pacific Advanced Visualization Tools Industry Analysis, Insights and Forecast, 2019-2031
- 13.1. Market Analysis, Insights and Forecast - By Country/Sub-region
- 13.1.1 China
- 13.1.2 Japan
- 13.1.3 India
- 13.1.4 Australia
- 13.1.5 South Korea
- 13.1.6 Rest of Asia Pacific
- 14. Middle East and Africa Advanced Visualization Tools Industry Analysis, Insights and Forecast, 2019-2031
- 14.1. Market Analysis, Insights and Forecast - By Country/Sub-region
- 14.1.1 GCC
- 14.1.2 South Africa
- 14.1.3 Rest of Middle East and Africa
- 15. South America Advanced Visualization Tools Industry Analysis, Insights and Forecast, 2019-2031
- 15.1. Market Analysis, Insights and Forecast - By Country/Sub-region
- 15.1.1 Brazil
- 15.1.2 Argentina
- 15.1.3 Rest of South America
- 16. Competitive Analysis
- 16.1. Global Market Share Analysis 2024
- 16.2. Company Profiles
- 16.2.1 Siemens Healthcare GmbH
- 16.2.1.1. Overview
- 16.2.1.2. Products
- 16.2.1.3. SWOT Analysis
- 16.2.1.4. Recent Developments
- 16.2.1.5. Financials (Based on Availability)
- 16.2.2 Canon Inc (Canon Medical Systems Corporation)
- 16.2.2.1. Overview
- 16.2.2.2. Products
- 16.2.2.3. SWOT Analysis
- 16.2.2.4. Recent Developments
- 16.2.2.5. Financials (Based on Availability)
- 16.2.3 Terarecon Inc
- 16.2.3.1. Overview
- 16.2.3.2. Products
- 16.2.3.3. SWOT Analysis
- 16.2.3.4. Recent Developments
- 16.2.3.5. Financials (Based on Availability)
- 16.2.4 Carestream Health
- 16.2.4.1. Overview
- 16.2.4.2. Products
- 16.2.4.3. SWOT Analysis
- 16.2.4.4. Recent Developments
- 16.2.4.5. Financials (Based on Availability)
- 16.2.5 General Electric Company (GE Healthcare)
- 16.2.5.1. Overview
- 16.2.5.2. Products
- 16.2.5.3. SWOT Analysis
- 16.2.5.4. Recent Developments
- 16.2.5.5. Financials (Based on Availability)
- 16.2.6 Koninklijke Philips NV
- 16.2.6.1. Overview
- 16.2.6.2. Products
- 16.2.6.3. SWOT Analysis
- 16.2.6.4. Recent Developments
- 16.2.6.5. Financials (Based on Availability)
- 16.2.7 Pro Medicus Ltd
- 16.2.7.1. Overview
- 16.2.7.2. Products
- 16.2.7.3. SWOT Analysis
- 16.2.7.4. Recent Developments
- 16.2.7.5. Financials (Based on Availability)
- 16.2.8 Agfa-Gevaert Group
- 16.2.8.1. Overview
- 16.2.8.2. Products
- 16.2.8.3. SWOT Analysis
- 16.2.8.4. Recent Developments
- 16.2.8.5. Financials (Based on Availability)
- 16.2.9 Fujifilm Holdings Corporation
- 16.2.9.1. Overview
- 16.2.9.2. Products
- 16.2.9.3. SWOT Analysis
- 16.2.9.4. Recent Developments
- 16.2.9.5. Financials (Based on Availability)
- 16.2.1 Siemens Healthcare GmbH
List of Figures
- Figure 1: Global Advanced Visualization Tools Industry Revenue Breakdown (Million, %) by Region 2024 & 2032
- Figure 2: Global Advanced Visualization Tools Industry Volume Breakdown (K Unit, %) by Region 2024 & 2032
- Figure 3: North America Advanced Visualization Tools Industry Revenue (Million), by Country 2024 & 2032
- Figure 4: North America Advanced Visualization Tools Industry Volume (K Unit), by Country 2024 & 2032
- Figure 5: North America Advanced Visualization Tools Industry Revenue Share (%), by Country 2024 & 2032
- Figure 6: North America Advanced Visualization Tools Industry Volume Share (%), by Country 2024 & 2032
- Figure 7: Europe Advanced Visualization Tools Industry Revenue (Million), by Country 2024 & 2032
- Figure 8: Europe Advanced Visualization Tools Industry Volume (K Unit), by Country 2024 & 2032
- Figure 9: Europe Advanced Visualization Tools Industry Revenue Share (%), by Country 2024 & 2032
- Figure 10: Europe Advanced Visualization Tools Industry Volume Share (%), by Country 2024 & 2032
- Figure 11: Asia Pacific Advanced Visualization Tools Industry Revenue (Million), by Country 2024 & 2032
- Figure 12: Asia Pacific Advanced Visualization Tools Industry Volume (K Unit), by Country 2024 & 2032
- Figure 13: Asia Pacific Advanced Visualization Tools Industry Revenue Share (%), by Country 2024 & 2032
- Figure 14: Asia Pacific Advanced Visualization Tools Industry Volume Share (%), by Country 2024 & 2032
- Figure 15: Middle East and Africa Advanced Visualization Tools Industry Revenue (Million), by Country 2024 & 2032
- Figure 16: Middle East and Africa Advanced Visualization Tools Industry Volume (K Unit), by Country 2024 & 2032
- Figure 17: Middle East and Africa Advanced Visualization Tools Industry Revenue Share (%), by Country 2024 & 2032
- Figure 18: Middle East and Africa Advanced Visualization Tools Industry Volume Share (%), by Country 2024 & 2032
- Figure 19: South America Advanced Visualization Tools Industry Revenue (Million), by Country 2024 & 2032
- Figure 20: South America Advanced Visualization Tools Industry Volume (K Unit), by Country 2024 & 2032
- Figure 21: South America Advanced Visualization Tools Industry Revenue Share (%), by Country 2024 & 2032
- Figure 22: South America Advanced Visualization Tools Industry Volume Share (%), by Country 2024 & 2032
- Figure 23: North America Advanced Visualization Tools Industry Revenue (Million), by Product and Service 2024 & 2032
- Figure 24: North America Advanced Visualization Tools Industry Volume (K Unit), by Product and Service 2024 & 2032
- Figure 25: North America Advanced Visualization Tools Industry Revenue Share (%), by Product and Service 2024 & 2032
- Figure 26: North America Advanced Visualization Tools Industry Volume Share (%), by Product and Service 2024 & 2032
- Figure 27: North America Advanced Visualization Tools Industry Revenue (Million), by Type of Solution 2024 & 2032
- Figure 28: North America Advanced Visualization Tools Industry Volume (K Unit), by Type of Solution 2024 & 2032
- Figure 29: North America Advanced Visualization Tools Industry Revenue Share (%), by Type of Solution 2024 & 2032
- Figure 30: North America Advanced Visualization Tools Industry Volume Share (%), by Type of Solution 2024 & 2032
- Figure 31: North America Advanced Visualization Tools Industry Revenue (Million), by Imaging Modality 2024 & 2032
- Figure 32: North America Advanced Visualization Tools Industry Volume (K Unit), by Imaging Modality 2024 & 2032
- Figure 33: North America Advanced Visualization Tools Industry Revenue Share (%), by Imaging Modality 2024 & 2032
- Figure 34: North America Advanced Visualization Tools Industry Volume Share (%), by Imaging Modality 2024 & 2032
- Figure 35: North America Advanced Visualization Tools Industry Revenue (Million), by Clinical Application 2024 & 2032
- Figure 36: North America Advanced Visualization Tools Industry Volume (K Unit), by Clinical Application 2024 & 2032
- Figure 37: North America Advanced Visualization Tools Industry Revenue Share (%), by Clinical Application 2024 & 2032
- Figure 38: North America Advanced Visualization Tools Industry Volume Share (%), by Clinical Application 2024 & 2032
- Figure 39: North America Advanced Visualization Tools Industry Revenue (Million), by Country 2024 & 2032
- Figure 40: North America Advanced Visualization Tools Industry Volume (K Unit), by Country 2024 & 2032
- Figure 41: North America Advanced Visualization Tools Industry Revenue Share (%), by Country 2024 & 2032
- Figure 42: North America Advanced Visualization Tools Industry Volume Share (%), by Country 2024 & 2032
- Figure 43: Europe Advanced Visualization Tools Industry Revenue (Million), by Product and Service 2024 & 2032
- Figure 44: Europe Advanced Visualization Tools Industry Volume (K Unit), by Product and Service 2024 & 2032
- Figure 45: Europe Advanced Visualization Tools Industry Revenue Share (%), by Product and Service 2024 & 2032
- Figure 46: Europe Advanced Visualization Tools Industry Volume Share (%), by Product and Service 2024 & 2032
- Figure 47: Europe Advanced Visualization Tools Industry Revenue (Million), by Type of Solution 2024 & 2032
- Figure 48: Europe Advanced Visualization Tools Industry Volume (K Unit), by Type of Solution 2024 & 2032
- Figure 49: Europe Advanced Visualization Tools Industry Revenue Share (%), by Type of Solution 2024 & 2032
- Figure 50: Europe Advanced Visualization Tools Industry Volume Share (%), by Type of Solution 2024 & 2032
- Figure 51: Europe Advanced Visualization Tools Industry Revenue (Million), by Imaging Modality 2024 & 2032
- Figure 52: Europe Advanced Visualization Tools Industry Volume (K Unit), by Imaging Modality 2024 & 2032
- Figure 53: Europe Advanced Visualization Tools Industry Revenue Share (%), by Imaging Modality 2024 & 2032
- Figure 54: Europe Advanced Visualization Tools Industry Volume Share (%), by Imaging Modality 2024 & 2032
- Figure 55: Europe Advanced Visualization Tools Industry Revenue (Million), by Clinical Application 2024 & 2032
- Figure 56: Europe Advanced Visualization Tools Industry Volume (K Unit), by Clinical Application 2024 & 2032
- Figure 57: Europe Advanced Visualization Tools Industry Revenue Share (%), by Clinical Application 2024 & 2032
- Figure 58: Europe Advanced Visualization Tools Industry Volume Share (%), by Clinical Application 2024 & 2032
- Figure 59: Europe Advanced Visualization Tools Industry Revenue (Million), by Country 2024 & 2032
- Figure 60: Europe Advanced Visualization Tools Industry Volume (K Unit), by Country 2024 & 2032
- Figure 61: Europe Advanced Visualization Tools Industry Revenue Share (%), by Country 2024 & 2032
- Figure 62: Europe Advanced Visualization Tools Industry Volume Share (%), by Country 2024 & 2032
- Figure 63: Asia Pacific Advanced Visualization Tools Industry Revenue (Million), by Product and Service 2024 & 2032
- Figure 64: Asia Pacific Advanced Visualization Tools Industry Volume (K Unit), by Product and Service 2024 & 2032
- Figure 65: Asia Pacific Advanced Visualization Tools Industry Revenue Share (%), by Product and Service 2024 & 2032
- Figure 66: Asia Pacific Advanced Visualization Tools Industry Volume Share (%), by Product and Service 2024 & 2032
- Figure 67: Asia Pacific Advanced Visualization Tools Industry Revenue (Million), by Type of Solution 2024 & 2032
- Figure 68: Asia Pacific Advanced Visualization Tools Industry Volume (K Unit), by Type of Solution 2024 & 2032
- Figure 69: Asia Pacific Advanced Visualization Tools Industry Revenue Share (%), by Type of Solution 2024 & 2032
- Figure 70: Asia Pacific Advanced Visualization Tools Industry Volume Share (%), by Type of Solution 2024 & 2032
- Figure 71: Asia Pacific Advanced Visualization Tools Industry Revenue (Million), by Imaging Modality 2024 & 2032
- Figure 72: Asia Pacific Advanced Visualization Tools Industry Volume (K Unit), by Imaging Modality 2024 & 2032
- Figure 73: Asia Pacific Advanced Visualization Tools Industry Revenue Share (%), by Imaging Modality 2024 & 2032
- Figure 74: Asia Pacific Advanced Visualization Tools Industry Volume Share (%), by Imaging Modality 2024 & 2032
- Figure 75: Asia Pacific Advanced Visualization Tools Industry Revenue (Million), by Clinical Application 2024 & 2032
- Figure 76: Asia Pacific Advanced Visualization Tools Industry Volume (K Unit), by Clinical Application 2024 & 2032
- Figure 77: Asia Pacific Advanced Visualization Tools Industry Revenue Share (%), by Clinical Application 2024 & 2032
- Figure 78: Asia Pacific Advanced Visualization Tools Industry Volume Share (%), by Clinical Application 2024 & 2032
- Figure 79: Asia Pacific Advanced Visualization Tools Industry Revenue (Million), by Country 2024 & 2032
- Figure 80: Asia Pacific Advanced Visualization Tools Industry Volume (K Unit), by Country 2024 & 2032
- Figure 81: Asia Pacific Advanced Visualization Tools Industry Revenue Share (%), by Country 2024 & 2032
- Figure 82: Asia Pacific Advanced Visualization Tools Industry Volume Share (%), by Country 2024 & 2032
- Figure 83: Middle East and Africa Advanced Visualization Tools Industry Revenue (Million), by Product and Service 2024 & 2032
- Figure 84: Middle East and Africa Advanced Visualization Tools Industry Volume (K Unit), by Product and Service 2024 & 2032
- Figure 85: Middle East and Africa Advanced Visualization Tools Industry Revenue Share (%), by Product and Service 2024 & 2032
- Figure 86: Middle East and Africa Advanced Visualization Tools Industry Volume Share (%), by Product and Service 2024 & 2032
- Figure 87: Middle East and Africa Advanced Visualization Tools Industry Revenue (Million), by Type of Solution 2024 & 2032
- Figure 88: Middle East and Africa Advanced Visualization Tools Industry Volume (K Unit), by Type of Solution 2024 & 2032
- Figure 89: Middle East and Africa Advanced Visualization Tools Industry Revenue Share (%), by Type of Solution 2024 & 2032
- Figure 90: Middle East and Africa Advanced Visualization Tools Industry Volume Share (%), by Type of Solution 2024 & 2032
- Figure 91: Middle East and Africa Advanced Visualization Tools Industry Revenue (Million), by Imaging Modality 2024 & 2032
- Figure 92: Middle East and Africa Advanced Visualization Tools Industry Volume (K Unit), by Imaging Modality 2024 & 2032
- Figure 93: Middle East and Africa Advanced Visualization Tools Industry Revenue Share (%), by Imaging Modality 2024 & 2032
- Figure 94: Middle East and Africa Advanced Visualization Tools Industry Volume Share (%), by Imaging Modality 2024 & 2032
- Figure 95: Middle East and Africa Advanced Visualization Tools Industry Revenue (Million), by Clinical Application 2024 & 2032
- Figure 96: Middle East and Africa Advanced Visualization Tools Industry Volume (K Unit), by Clinical Application 2024 & 2032
- Figure 97: Middle East and Africa Advanced Visualization Tools Industry Revenue Share (%), by Clinical Application 2024 & 2032
- Figure 98: Middle East and Africa Advanced Visualization Tools Industry Volume Share (%), by Clinical Application 2024 & 2032
- Figure 99: Middle East and Africa Advanced Visualization Tools Industry Revenue (Million), by Country 2024 & 2032
- Figure 100: Middle East and Africa Advanced Visualization Tools Industry Volume (K Unit), by Country 2024 & 2032
- Figure 101: Middle East and Africa Advanced Visualization Tools Industry Revenue Share (%), by Country 2024 & 2032
- Figure 102: Middle East and Africa Advanced Visualization Tools Industry Volume Share (%), by Country 2024 & 2032
- Figure 103: South America Advanced Visualization Tools Industry Revenue (Million), by Product and Service 2024 & 2032
- Figure 104: South America Advanced Visualization Tools Industry Volume (K Unit), by Product and Service 2024 & 2032
- Figure 105: South America Advanced Visualization Tools Industry Revenue Share (%), by Product and Service 2024 & 2032
- Figure 106: South America Advanced Visualization Tools Industry Volume Share (%), by Product and Service 2024 & 2032
- Figure 107: South America Advanced Visualization Tools Industry Revenue (Million), by Type of Solution 2024 & 2032
- Figure 108: South America Advanced Visualization Tools Industry Volume (K Unit), by Type of Solution 2024 & 2032
- Figure 109: South America Advanced Visualization Tools Industry Revenue Share (%), by Type of Solution 2024 & 2032
- Figure 110: South America Advanced Visualization Tools Industry Volume Share (%), by Type of Solution 2024 & 2032
- Figure 111: South America Advanced Visualization Tools Industry Revenue (Million), by Imaging Modality 2024 & 2032
- Figure 112: South America Advanced Visualization Tools Industry Volume (K Unit), by Imaging Modality 2024 & 2032
- Figure 113: South America Advanced Visualization Tools Industry Revenue Share (%), by Imaging Modality 2024 & 2032
- Figure 114: South America Advanced Visualization Tools Industry Volume Share (%), by Imaging Modality 2024 & 2032
- Figure 115: South America Advanced Visualization Tools Industry Revenue (Million), by Clinical Application 2024 & 2032
- Figure 116: South America Advanced Visualization Tools Industry Volume (K Unit), by Clinical Application 2024 & 2032
- Figure 117: South America Advanced Visualization Tools Industry Revenue Share (%), by Clinical Application 2024 & 2032
- Figure 118: South America Advanced Visualization Tools Industry Volume Share (%), by Clinical Application 2024 & 2032
- Figure 119: South America Advanced Visualization Tools Industry Revenue (Million), by Country 2024 & 2032
- Figure 120: South America Advanced Visualization Tools Industry Volume (K Unit), by Country 2024 & 2032
- Figure 121: South America Advanced Visualization Tools Industry Revenue Share (%), by Country 2024 & 2032
- Figure 122: South America Advanced Visualization Tools Industry Volume Share (%), by Country 2024 & 2032
List of Tables
- Table 1: Global Advanced Visualization Tools Industry Revenue Million Forecast, by Region 2019 & 2032
- Table 2: Global Advanced Visualization Tools Industry Volume K Unit Forecast, by Region 2019 & 2032
- Table 3: Global Advanced Visualization Tools Industry Revenue Million Forecast, by Product and Service 2019 & 2032
- Table 4: Global Advanced Visualization Tools Industry Volume K Unit Forecast, by Product and Service 2019 & 2032
- Table 5: Global Advanced Visualization Tools Industry Revenue Million Forecast, by Type of Solution 2019 & 2032
- Table 6: Global Advanced Visualization Tools Industry Volume K Unit Forecast, by Type of Solution 2019 & 2032
- Table 7: Global Advanced Visualization Tools Industry Revenue Million Forecast, by Imaging Modality 2019 & 2032
- Table 8: Global Advanced Visualization Tools Industry Volume K Unit Forecast, by Imaging Modality 2019 & 2032
- Table 9: Global Advanced Visualization Tools Industry Revenue Million Forecast, by Clinical Application 2019 & 2032
- Table 10: Global Advanced Visualization Tools Industry Volume K Unit Forecast, by Clinical Application 2019 & 2032
- Table 11: Global Advanced Visualization Tools Industry Revenue Million Forecast, by Region 2019 & 2032
- Table 12: Global Advanced Visualization Tools Industry Volume K Unit Forecast, by Region 2019 & 2032
- Table 13: Global Advanced Visualization Tools Industry Revenue Million Forecast, by Country 2019 & 2032
- Table 14: Global Advanced Visualization Tools Industry Volume K Unit Forecast, by Country 2019 & 2032
- Table 15: United States Advanced Visualization Tools Industry Revenue (Million) Forecast, by Application 2019 & 2032
- Table 16: United States Advanced Visualization Tools Industry Volume (K Unit) Forecast, by Application 2019 & 2032
- Table 17: Canada Advanced Visualization Tools Industry Revenue (Million) Forecast, by Application 2019 & 2032
- Table 18: Canada Advanced Visualization Tools Industry Volume (K Unit) Forecast, by Application 2019 & 2032
- Table 19: Mexico Advanced Visualization Tools Industry Revenue (Million) Forecast, by Application 2019 & 2032
- Table 20: Mexico Advanced Visualization Tools Industry Volume (K Unit) Forecast, by Application 2019 & 2032
- Table 21: Global Advanced Visualization Tools Industry Revenue Million Forecast, by Country 2019 & 2032
- Table 22: Global Advanced Visualization Tools Industry Volume K Unit Forecast, by Country 2019 & 2032
- Table 23: Germany Advanced Visualization Tools Industry Revenue (Million) Forecast, by Application 2019 & 2032
- Table 24: Germany Advanced Visualization Tools Industry Volume (K Unit) Forecast, by Application 2019 & 2032
- Table 25: United Kingdom Advanced Visualization Tools Industry Revenue (Million) Forecast, by Application 2019 & 2032
- Table 26: United Kingdom Advanced Visualization Tools Industry Volume (K Unit) Forecast, by Application 2019 & 2032
- Table 27: France Advanced Visualization Tools Industry Revenue (Million) Forecast, by Application 2019 & 2032
- Table 28: France Advanced Visualization Tools Industry Volume (K Unit) Forecast, by Application 2019 & 2032
- Table 29: Italy Advanced Visualization Tools Industry Revenue (Million) Forecast, by Application 2019 & 2032
- Table 30: Italy Advanced Visualization Tools Industry Volume (K Unit) Forecast, by Application 2019 & 2032
- Table 31: Spain Advanced Visualization Tools Industry Revenue (Million) Forecast, by Application 2019 & 2032
- Table 32: Spain Advanced Visualization Tools Industry Volume (K Unit) Forecast, by Application 2019 & 2032
- Table 33: Rest of Europe Advanced Visualization Tools Industry Revenue (Million) Forecast, by Application 2019 & 2032
- Table 34: Rest of Europe Advanced Visualization Tools Industry Volume (K Unit) Forecast, by Application 2019 & 2032
- Table 35: Global Advanced Visualization Tools Industry Revenue Million Forecast, by Country 2019 & 2032
- Table 36: Global Advanced Visualization Tools Industry Volume K Unit Forecast, by Country 2019 & 2032
- Table 37: China Advanced Visualization Tools Industry Revenue (Million) Forecast, by Application 2019 & 2032
- Table 38: China Advanced Visualization Tools Industry Volume (K Unit) Forecast, by Application 2019 & 2032
- Table 39: Japan Advanced Visualization Tools Industry Revenue (Million) Forecast, by Application 2019 & 2032
- Table 40: Japan Advanced Visualization Tools Industry Volume (K Unit) Forecast, by Application 2019 & 2032
- Table 41: India Advanced Visualization Tools Industry Revenue (Million) Forecast, by Application 2019 & 2032
- Table 42: India Advanced Visualization Tools Industry Volume (K Unit) Forecast, by Application 2019 & 2032
- Table 43: Australia Advanced Visualization Tools Industry Revenue (Million) Forecast, by Application 2019 & 2032
- Table 44: Australia Advanced Visualization Tools Industry Volume (K Unit) Forecast, by Application 2019 & 2032
- Table 45: South Korea Advanced Visualization Tools Industry Revenue (Million) Forecast, by Application 2019 & 2032
- Table 46: South Korea Advanced Visualization Tools Industry Volume (K Unit) Forecast, by Application 2019 & 2032
- Table 47: Rest of Asia Pacific Advanced Visualization Tools Industry Revenue (Million) Forecast, by Application 2019 & 2032
- Table 48: Rest of Asia Pacific Advanced Visualization Tools Industry Volume (K Unit) Forecast, by Application 2019 & 2032
- Table 49: Global Advanced Visualization Tools Industry Revenue Million Forecast, by Country 2019 & 2032
- Table 50: Global Advanced Visualization Tools Industry Volume K Unit Forecast, by Country 2019 & 2032
- Table 51: GCC Advanced Visualization Tools Industry Revenue (Million) Forecast, by Application 2019 & 2032
- Table 52: GCC Advanced Visualization Tools Industry Volume (K Unit) Forecast, by Application 2019 & 2032
- Table 53: South Africa Advanced Visualization Tools Industry Revenue (Million) Forecast, by Application 2019 & 2032
- Table 54: South Africa Advanced Visualization Tools Industry Volume (K Unit) Forecast, by Application 2019 & 2032
- Table 55: Rest of Middle East and Africa Advanced Visualization Tools Industry Revenue (Million) Forecast, by Application 2019 & 2032
- Table 56: Rest of Middle East and Africa Advanced Visualization Tools Industry Volume (K Unit) Forecast, by Application 2019 & 2032
- Table 57: Global Advanced Visualization Tools Industry Revenue Million Forecast, by Country 2019 & 2032
- Table 58: Global Advanced Visualization Tools Industry Volume K Unit Forecast, by Country 2019 & 2032
- Table 59: Brazil Advanced Visualization Tools Industry Revenue (Million) Forecast, by Application 2019 & 2032
- Table 60: Brazil Advanced Visualization Tools Industry Volume (K Unit) Forecast, by Application 2019 & 2032
- Table 61: Argentina Advanced Visualization Tools Industry Revenue (Million) Forecast, by Application 2019 & 2032
- Table 62: Argentina Advanced Visualization Tools Industry Volume (K Unit) Forecast, by Application 2019 & 2032
- Table 63: Rest of South America Advanced Visualization Tools Industry Revenue (Million) Forecast, by Application 2019 & 2032
- Table 64: Rest of South America Advanced Visualization Tools Industry Volume (K Unit) Forecast, by Application 2019 & 2032
- Table 65: Global Advanced Visualization Tools Industry Revenue Million Forecast, by Product and Service 2019 & 2032
- Table 66: Global Advanced Visualization Tools Industry Volume K Unit Forecast, by Product and Service 2019 & 2032
- Table 67: Global Advanced Visualization Tools Industry Revenue Million Forecast, by Type of Solution 2019 & 2032
- Table 68: Global Advanced Visualization Tools Industry Volume K Unit Forecast, by Type of Solution 2019 & 2032
- Table 69: Global Advanced Visualization Tools Industry Revenue Million Forecast, by Imaging Modality 2019 & 2032
- Table 70: Global Advanced Visualization Tools Industry Volume K Unit Forecast, by Imaging Modality 2019 & 2032
- Table 71: Global Advanced Visualization Tools Industry Revenue Million Forecast, by Clinical Application 2019 & 2032
- Table 72: Global Advanced Visualization Tools Industry Volume K Unit Forecast, by Clinical Application 2019 & 2032
- Table 73: Global Advanced Visualization Tools Industry Revenue Million Forecast, by Country 2019 & 2032
- Table 74: Global Advanced Visualization Tools Industry Volume K Unit Forecast, by Country 2019 & 2032
- Table 75: United States Advanced Visualization Tools Industry Revenue (Million) Forecast, by Application 2019 & 2032
- Table 76: United States Advanced Visualization Tools Industry Volume (K Unit) Forecast, by Application 2019 & 2032
- Table 77: Canada Advanced Visualization Tools Industry Revenue (Million) Forecast, by Application 2019 & 2032
- Table 78: Canada Advanced Visualization Tools Industry Volume (K Unit) Forecast, by Application 2019 & 2032
- Table 79: Mexico Advanced Visualization Tools Industry Revenue (Million) Forecast, by Application 2019 & 2032
- Table 80: Mexico Advanced Visualization Tools Industry Volume (K Unit) Forecast, by Application 2019 & 2032
- Table 81: Global Advanced Visualization Tools Industry Revenue Million Forecast, by Product and Service 2019 & 2032
- Table 82: Global Advanced Visualization Tools Industry Volume K Unit Forecast, by Product and Service 2019 & 2032
- Table 83: Global Advanced Visualization Tools Industry Revenue Million Forecast, by Type of Solution 2019 & 2032
- Table 84: Global Advanced Visualization Tools Industry Volume K Unit Forecast, by Type of Solution 2019 & 2032
- Table 85: Global Advanced Visualization Tools Industry Revenue Million Forecast, by Imaging Modality 2019 & 2032
- Table 86: Global Advanced Visualization Tools Industry Volume K Unit Forecast, by Imaging Modality 2019 & 2032
- Table 87: Global Advanced Visualization Tools Industry Revenue Million Forecast, by Clinical Application 2019 & 2032
- Table 88: Global Advanced Visualization Tools Industry Volume K Unit Forecast, by Clinical Application 2019 & 2032
- Table 89: Global Advanced Visualization Tools Industry Revenue Million Forecast, by Country 2019 & 2032
- Table 90: Global Advanced Visualization Tools Industry Volume K Unit Forecast, by Country 2019 & 2032
- Table 91: Germany Advanced Visualization Tools Industry Revenue (Million) Forecast, by Application 2019 & 2032
- Table 92: Germany Advanced Visualization Tools Industry Volume (K Unit) Forecast, by Application 2019 & 2032
- Table 93: United Kingdom Advanced Visualization Tools Industry Revenue (Million) Forecast, by Application 2019 & 2032
- Table 94: United Kingdom Advanced Visualization Tools Industry Volume (K Unit) Forecast, by Application 2019 & 2032
- Table 95: France Advanced Visualization Tools Industry Revenue (Million) Forecast, by Application 2019 & 2032
- Table 96: France Advanced Visualization Tools Industry Volume (K Unit) Forecast, by Application 2019 & 2032
- Table 97: Italy Advanced Visualization Tools Industry Revenue (Million) Forecast, by Application 2019 & 2032
- Table 98: Italy Advanced Visualization Tools Industry Volume (K Unit) Forecast, by Application 2019 & 2032
- Table 99: Spain Advanced Visualization Tools Industry Revenue (Million) Forecast, by Application 2019 & 2032
- Table 100: Spain Advanced Visualization Tools Industry Volume (K Unit) Forecast, by Application 2019 & 2032
- Table 101: Rest of Europe Advanced Visualization Tools Industry Revenue (Million) Forecast, by Application 2019 & 2032
- Table 102: Rest of Europe Advanced Visualization Tools Industry Volume (K Unit) Forecast, by Application 2019 & 2032
- Table 103: Global Advanced Visualization Tools Industry Revenue Million Forecast, by Product and Service 2019 & 2032
- Table 104: Global Advanced Visualization Tools Industry Volume K Unit Forecast, by Product and Service 2019 & 2032
- Table 105: Global Advanced Visualization Tools Industry Revenue Million Forecast, by Type of Solution 2019 & 2032
- Table 106: Global Advanced Visualization Tools Industry Volume K Unit Forecast, by Type of Solution 2019 & 2032
- Table 107: Global Advanced Visualization Tools Industry Revenue Million Forecast, by Imaging Modality 2019 & 2032
- Table 108: Global Advanced Visualization Tools Industry Volume K Unit Forecast, by Imaging Modality 2019 & 2032
- Table 109: Global Advanced Visualization Tools Industry Revenue Million Forecast, by Clinical Application 2019 & 2032
- Table 110: Global Advanced Visualization Tools Industry Volume K Unit Forecast, by Clinical Application 2019 & 2032
- Table 111: Global Advanced Visualization Tools Industry Revenue Million Forecast, by Country 2019 & 2032
- Table 112: Global Advanced Visualization Tools Industry Volume K Unit Forecast, by Country 2019 & 2032
- Table 113: China Advanced Visualization Tools Industry Revenue (Million) Forecast, by Application 2019 & 2032
- Table 114: China Advanced Visualization Tools Industry Volume (K Unit) Forecast, by Application 2019 & 2032
- Table 115: Japan Advanced Visualization Tools Industry Revenue (Million) Forecast, by Application 2019 & 2032
- Table 116: Japan Advanced Visualization Tools Industry Volume (K Unit) Forecast, by Application 2019 & 2032
- Table 117: India Advanced Visualization Tools Industry Revenue (Million) Forecast, by Application 2019 & 2032
- Table 118: India Advanced Visualization Tools Industry Volume (K Unit) Forecast, by Application 2019 & 2032
- Table 119: Australia Advanced Visualization Tools Industry Revenue (Million) Forecast, by Application 2019 & 2032
- Table 120: Australia Advanced Visualization Tools Industry Volume (K Unit) Forecast, by Application 2019 & 2032
- Table 121: South Korea Advanced Visualization Tools Industry Revenue (Million) Forecast, by Application 2019 & 2032
- Table 122: South Korea Advanced Visualization Tools Industry Volume (K Unit) Forecast, by Application 2019 & 2032
- Table 123: Rest of Asia Pacific Advanced Visualization Tools Industry Revenue (Million) Forecast, by Application 2019 & 2032
- Table 124: Rest of Asia Pacific Advanced Visualization Tools Industry Volume (K Unit) Forecast, by Application 2019 & 2032
- Table 125: Global Advanced Visualization Tools Industry Revenue Million Forecast, by Product and Service 2019 & 2032
- Table 126: Global Advanced Visualization Tools Industry Volume K Unit Forecast, by Product and Service 2019 & 2032
- Table 127: Global Advanced Visualization Tools Industry Revenue Million Forecast, by Type of Solution 2019 & 2032
- Table 128: Global Advanced Visualization Tools Industry Volume K Unit Forecast, by Type of Solution 2019 & 2032
- Table 129: Global Advanced Visualization Tools Industry Revenue Million Forecast, by Imaging Modality 2019 & 2032
- Table 130: Global Advanced Visualization Tools Industry Volume K Unit Forecast, by Imaging Modality 2019 & 2032
- Table 131: Global Advanced Visualization Tools Industry Revenue Million Forecast, by Clinical Application 2019 & 2032
- Table 132: Global Advanced Visualization Tools Industry Volume K Unit Forecast, by Clinical Application 2019 & 2032
- Table 133: Global Advanced Visualization Tools Industry Revenue Million Forecast, by Country 2019 & 2032
- Table 134: Global Advanced Visualization Tools Industry Volume K Unit Forecast, by Country 2019 & 2032
- Table 135: GCC Advanced Visualization Tools Industry Revenue (Million) Forecast, by Application 2019 & 2032
- Table 136: GCC Advanced Visualization Tools Industry Volume (K Unit) Forecast, by Application 2019 & 2032
- Table 137: South Africa Advanced Visualization Tools Industry Revenue (Million) Forecast, by Application 2019 & 2032
- Table 138: South Africa Advanced Visualization Tools Industry Volume (K Unit) Forecast, by Application 2019 & 2032
- Table 139: Rest of Middle East and Africa Advanced Visualization Tools Industry Revenue (Million) Forecast, by Application 2019 & 2032
- Table 140: Rest of Middle East and Africa Advanced Visualization Tools Industry Volume (K Unit) Forecast, by Application 2019 & 2032
- Table 141: Global Advanced Visualization Tools Industry Revenue Million Forecast, by Product and Service 2019 & 2032
- Table 142: Global Advanced Visualization Tools Industry Volume K Unit Forecast, by Product and Service 2019 & 2032
- Table 143: Global Advanced Visualization Tools Industry Revenue Million Forecast, by Type of Solution 2019 & 2032
- Table 144: Global Advanced Visualization Tools Industry Volume K Unit Forecast, by Type of Solution 2019 & 2032
- Table 145: Global Advanced Visualization Tools Industry Revenue Million Forecast, by Imaging Modality 2019 & 2032
- Table 146: Global Advanced Visualization Tools Industry Volume K Unit Forecast, by Imaging Modality 2019 & 2032
- Table 147: Global Advanced Visualization Tools Industry Revenue Million Forecast, by Clinical Application 2019 & 2032
- Table 148: Global Advanced Visualization Tools Industry Volume K Unit Forecast, by Clinical Application 2019 & 2032
- Table 149: Global Advanced Visualization Tools Industry Revenue Million Forecast, by Country 2019 & 2032
- Table 150: Global Advanced Visualization Tools Industry Volume K Unit Forecast, by Country 2019 & 2032
- Table 151: Brazil Advanced Visualization Tools Industry Revenue (Million) Forecast, by Application 2019 & 2032
- Table 152: Brazil Advanced Visualization Tools Industry Volume (K Unit) Forecast, by Application 2019 & 2032
- Table 153: Argentina Advanced Visualization Tools Industry Revenue (Million) Forecast, by Application 2019 & 2032
- Table 154: Argentina Advanced Visualization Tools Industry Volume (K Unit) Forecast, by Application 2019 & 2032
- Table 155: Rest of South America Advanced Visualization Tools Industry Revenue (Million) Forecast, by Application 2019 & 2032
- Table 156: Rest of South America Advanced Visualization Tools Industry Volume (K Unit) Forecast, by Application 2019 & 2032
Frequently Asked Questions
1. What is the projected Compound Annual Growth Rate (CAGR) of the Advanced Visualization Tools Industry?
The projected CAGR is approximately 11.30%.
2. Which companies are prominent players in the Advanced Visualization Tools Industry?
Key companies in the market include Siemens Healthcare GmbH, Canon Inc (Canon Medical Systems Corporation), Terarecon Inc , Carestream Health, General Electric Company (GE Healthcare), Koninklijke Philips NV, Pro Medicus Ltd, Agfa-Gevaert Group, Fujifilm Holdings Corporation.
3. What are the main segments of the Advanced Visualization Tools Industry?
The market segments include Product and Service, Type of Solution, Imaging Modality, Clinical Application.
4. Can you provide details about the market size?
The market size is estimated to be USD XX Million as of 2022.
5. What are some drivers contributing to market growth?
Increasing Prevalence of Chronic Diseases Coupled With Growing Geriatric Population; Rising Awareness of Benefits associated with Advanced Visualization Tools in Disease Diagnosis.
6. What are the notable trends driving market growth?
Oncology Under Clinical Application Expected to Grow Over the Forecast Period.
7. Are there any restraints impacting market growth?
Limited Availability of Reimbursements for Radiology-Based Diagnostic Procedures.
8. Can you provide examples of recent developments in the market?
August 2022: Kitware launched MIQA, a cloud-based application for medical image quality assurance. It facilitates collaboration and longitudinal studies by geographically diverse teams.
9. What pricing options are available for accessing the report?
Pricing options include single-user, multi-user, and enterprise licenses priced at USD 4750, USD 5250, and USD 8750 respectively.
10. Is the market size provided in terms of value or volume?
The market size is provided in terms of value, measured in Million and volume, measured in K Unit.
11. Are there any specific market keywords associated with the report?
Yes, the market keyword associated with the report is "Advanced Visualization Tools Industry," which aids in identifying and referencing the specific market segment covered.
12. How do I determine which pricing option suits my needs best?
The pricing options vary based on user requirements and access needs. Individual users may opt for single-user licenses, while businesses requiring broader access may choose multi-user or enterprise licenses for cost-effective access to the report.
13. Are there any additional resources or data provided in the Advanced Visualization Tools Industry report?
While the report offers comprehensive insights, it's advisable to review the specific contents or supplementary materials provided to ascertain if additional resources or data are available.
14. How can I stay updated on further developments or reports in the Advanced Visualization Tools Industry?
To stay informed about further developments, trends, and reports in the Advanced Visualization Tools Industry, consider subscribing to industry newsletters, following relevant companies and organizations, or regularly checking reputable industry news sources and publications.
Methodology
Step 1 - Identification of Relevant Samples Size from Population Database


Step 2 - Approaches for Defining Global Market Size (Value, Volume* & Price*)

Note*: In applicable scenarios
Step 3 - Data Sources
Primary Research
- Web Analytics
- Survey Reports
- Research Institute
- Latest Research Reports
- Opinion Leaders
Secondary Research
- Annual Reports
- White Paper
- Latest Press Release
- Industry Association
- Paid Database
- Investor Presentations

Step 4 - Data Triangulation
Involves using different sources of information in order to increase the validity of a study
These sources are likely to be stakeholders in a program - participants, other researchers, program staff, other community members, and so on.
Then we put all data in single framework & apply various statistical tools to find out the dynamic on the market.
During the analysis stage, feedback from the stakeholder groups would be compared to determine areas of agreement as well as areas of divergence


