
Key Insights
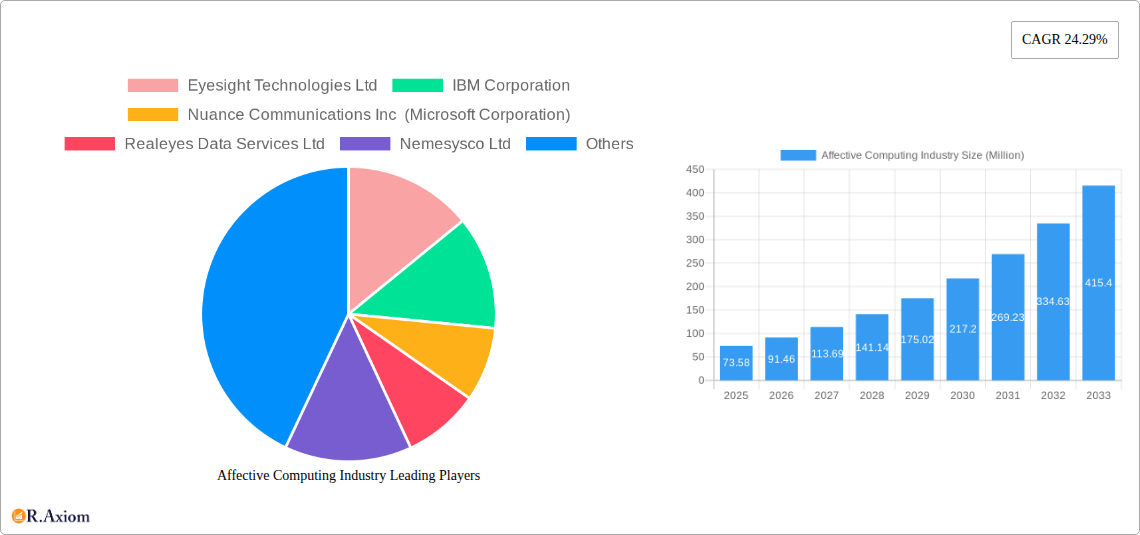
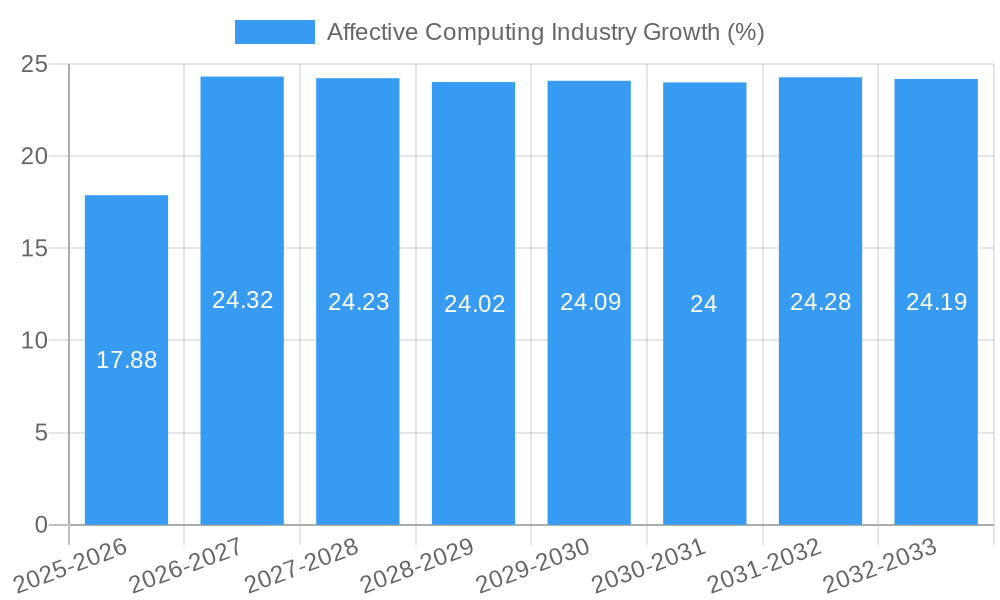
The Affective Computing market, valued at $73.58 million in 2025, is poised for significant growth, exhibiting a Compound Annual Growth Rate (CAGR) of 24.29% from 2025 to 2033. This robust expansion is driven by increasing demand for personalized user experiences across various sectors, advances in artificial intelligence (AI) and machine learning (ML) technologies enabling more accurate emotion recognition, and the rising adoption of affective computing solutions in healthcare for patient monitoring and mental health applications. The healthcare sector is a major driver, leveraging affective computing for improved diagnostics, personalized treatment plans, and enhanced patient care. Furthermore, the automotive industry utilizes these technologies for driver monitoring systems that enhance safety and driver assistance features. The retail sector benefits from personalized marketing campaigns and improved customer experience through real-time emotion analysis.
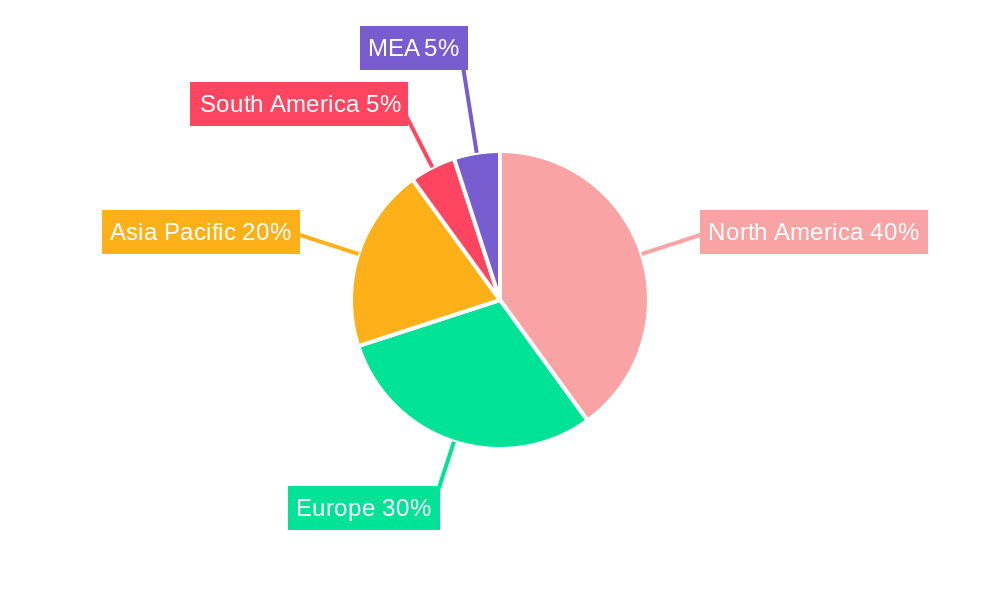
However, challenges exist, including concerns over data privacy and ethical implications related to the collection and use of emotional data. The high cost of development and implementation of affective computing systems, coupled with the need for sophisticated algorithms capable of handling complex human emotions accurately, pose further restraints on market growth. Despite these challenges, the market segmentation reveals strong potential. The software component is anticipated to experience faster growth compared to hardware due to the rapid evolution of AI and ML algorithms, which are integral to the software solutions. North America is currently leading the market, owing to its early adoption of advanced technologies and the presence of key players. However, Asia Pacific is projected to witness substantial growth in the coming years fueled by increased investment in technological advancements and a rapidly expanding digital economy. The continued development of more robust and ethical solutions will be vital in unlocking the full potential of this transformative technology.
Affective Computing Industry Market Report: 2019-2033
This comprehensive report provides an in-depth analysis of the Affective Computing industry, offering valuable insights for stakeholders, investors, and industry professionals. With a study period spanning 2019-2033, a base year of 2025, and a forecast period of 2025-2033, this report meticulously examines market trends, growth drivers, challenges, and opportunities within this rapidly evolving sector. The report projects a xx Million market value by 2033, with a CAGR of xx% during the forecast period.
Affective Computing Industry Market Concentration & Innovation
The Affective Computing industry exhibits a moderately concentrated market structure, with several key players holding significant market share. While precise market share figures for each company are unavailable, leading players like IBM Corporation, Nuance Communications Inc (Microsoft Corporation), and Affectiva Inc. command substantial portions. Smaller, specialized companies like Eyesight Technologies Ltd and Realeyes Data Services Ltd also contribute significantly to market innovation. The industry is characterized by continuous innovation, driven by advancements in AI, machine learning, and sensor technologies. Mergers and acquisitions (M&A) play a vital role in consolidating market share and driving innovation. Recent M&A activity values are unavailable (xx Million). Regulatory frameworks surrounding data privacy and ethical considerations significantly impact the industry's development. The industry faces competitive pressure from emerging technologies and substitutes, but consumer adoption and demand continue to drive market growth. End-user trends towards personalized experiences and enhanced user interfaces fuel innovation.
- Market Concentration: Moderately concentrated, with several major players and a number of smaller, specialized companies.
- Innovation Drivers: Advancements in AI, machine learning, sensor technologies, and increasing demand for personalized experiences.
- Regulatory Frameworks: Data privacy regulations and ethical considerations significantly impact development and adoption.
- Product Substitutes: Competition exists from other human-computer interaction methods.
- End-User Trends: Increasing demand for personalization and enhanced user interfaces across various sectors.
- M&A Activity: Ongoing consolidation through mergers and acquisitions; recent deal values unavailable (xx Million).
Affective Computing Industry Industry Trends & Insights
The Affective Computing industry is experiencing rapid growth, fueled by several key factors. The increasing adoption of AI and machine learning across diverse sectors is a major driver. Consumer preferences are shifting towards more intuitive and personalized experiences, driving demand for emotion recognition technologies. Technological disruptions, such as advancements in sensor technology and improved algorithms, are continually improving the accuracy and capabilities of affective computing systems. The market exhibits strong competitive dynamics, with established players and new entrants vying for market share. Market penetration is increasing across various sectors, particularly in healthcare and automotive. The global market is expected to reach xx Million by 2033, driven by the CAGR of xx%.
Dominant Markets & Segments in Affective Computing Industry
The Affective Computing market is witnessing significant growth across various regions and segments. While precise figures for regional and segment dominance aren't available, we can infer that the North American market likely holds a dominant position. This is driven by substantial investment in technological innovation, a robust healthcare sector, and an early adoption of new technologies.
By Component:
- Hardware: Growth in this segment is driven by advancements in sensor technology and miniaturization. This enables more compact and easily integrated systems in various products and settings.
- Software: This segment is witnessing significant growth due to the development of sophisticated algorithms and machine learning models that improve emotion recognition accuracy and expand functionalities.
By End-user Industry:
- Healthcare: The healthcare sector is a major adopter, using Affective Computing for patient monitoring, personalized treatment, and improved mental health care.
- Automotive: The automotive industry utilizes the technology for driver monitoring, enhancing safety, and developing more intuitive driver-assistance systems.
- Retail: Retailers are using affective computing for enhancing customer experience and improving marketing strategies by analyzing customer emotions.
- Other End-user Industries: Other segments such as education, entertainment, and security are also showcasing growing adoption of affective computing solutions.
Key drivers across segments include increasing demand for personalized experiences and government support for technological advancement.
Affective Computing Industry Product Developments
Recent product innovations in Affective Computing focus on improved accuracy, enhanced portability, and expanded applications. New products integrate seamlessly into existing systems and offer more sophisticated emotion recognition capabilities. Competitive advantages are gained through improved algorithms, proprietary data sets, and integration with other technologies. The market is witnessing a trend towards cloud-based solutions, offering scalability and cost-effectiveness. Technological trends emphasize miniaturization, increased accuracy, and real-time processing. Market fit is optimized through tailored solutions for specific end-user industries.
Report Scope & Segmentation Analysis
This report segments the Affective Computing market in two key ways: by component (hardware and software) and by end-user industry (healthcare, automotive, retail, and other industries). Each segment is analyzed in detail, including growth projections, market size estimates, and competitive dynamics.
By Component: The Hardware segment is projected to grow at a CAGR of xx% during the forecast period, while the Software segment is anticipated to grow at xx%. The hardware segment is dominated by companies specializing in sensor technology, while the software segment sees a broader range of players developing algorithms and software applications.
By End-user Industry: The Healthcare segment is projected to be the fastest-growing segment, followed by the Automotive sector. The retail sector shows steady growth driven by the increasing use of emotion-based marketing and customer experience improvements. The "other industries" segment represents a diverse range of sectors adapting the technology.
Key Drivers of Affective Computing Industry Growth
Several key factors fuel the growth of the Affective Computing industry. Advancements in artificial intelligence and machine learning significantly improve the accuracy and capabilities of emotion recognition technologies. The increasing availability of high-quality data fuels algorithm improvements. Economic factors such as increased investment in R&D and rising consumer disposable incomes also contribute. Regulatory policies supporting the development and adoption of new technologies create a favorable environment for growth.
Challenges in the Affective Computing Industry Sector
The Affective Computing industry faces several challenges. Regulatory hurdles surrounding data privacy and ethical considerations present significant barriers to entry and expansion. Supply chain disruptions can impact the availability of components and materials needed for device manufacturing. Intense competition from established and emerging players creates pricing pressures and necessitates continuous innovation. The accuracy and reliability of emotion recognition technology remains a challenge, potentially limiting wider adoption. These factors contribute to a total estimated impact of xx Million annually on market growth.
Emerging Opportunities in Affective Computing Industry
Emerging opportunities abound in Affective Computing. New applications in education and mental healthcare offer significant potential. The development of more sophisticated and user-friendly interfaces will expand adoption. Advancements in wearable technology and embedded systems will create new opportunities for integration into everyday devices. Emerging markets in developing economies provide untapped potential for growth.
Leading Players in the Affective Computing Industry Market
- Eyesight Technologies Ltd
- IBM Corporation
- Nuance Communications Inc (Microsoft Corporation)
- Realeyes Data Services Ltd
- Nemesysco Ltd
- Kairos AR Inc
- Affectiva Inc
- Amazon Web Services Inc
- audEERING GmbH
- Emotibot Technologies Limited
- Element Human Ltd
- Gesturetek Inc
Key Developments in Affective Computing Industry Industry
September 2022: Nuance Communications, Inc. announced that Liberty Global expanded its use of Nuance Dragon TV for Virgin Media O2 customers in the United Kingdom, enhancing accessibility for visually impaired users. This highlights the increasing focus on inclusive technology.
August 2022: CallMiner's new integrations with Genesys Cloud CX and Amazon Connect demonstrate the growing importance of real-time analytics and seamless integration in the Contact Center as a Service (CCaaS) market. This underscores the value of affective computing in optimizing customer service operations.
May 2022: The "Affective Computing and Social Robots in the Rehabilitation of Children with Autism" workshop highlights the application of affective computing in therapeutic settings and showcases collaborative efforts across multiple countries. This signifies an expansion of the technology’s use in specialized areas.
Strategic Outlook for Affective Computing Industry Market
The Affective Computing industry is poised for substantial growth, driven by technological advancements, increasing demand for personalized experiences, and expanding applications across diverse sectors. Future market potential is substantial, with significant opportunities in emerging markets and new applications. Companies that can effectively leverage AI, machine learning, and data analytics will gain a competitive advantage. A focus on data privacy and ethical considerations will be crucial for sustained growth and market acceptance. The industry's continued evolution will depend on addressing the existing challenges and effectively capitalizing on emerging opportunities.
Affective Computing Industry Segmentation
-
1. Component
-
1.1. Hardware
- 1.1.1. Sensors
- 1.1.2. Cameras
- 1.1.3. Storage Devices and Processors
- 1.1.4. Other Components
-
1.2. Software
- 1.2.1. Analytics Software
- 1.2.2. Enterprise Software
- 1.2.3. Facial Recognition
- 1.2.4. Gesture Recognition
- 1.2.5. Speech Recognition
-
1.1. Hardware
-
2. End-user Industry
- 2.1. Healthcare
- 2.2. Automotive
- 2.3. Retail
- 2.4. Other End-user Industries
Affective Computing Industry Segmentation By Geography
- 1. North America
- 2. Europe
- 3. Asia
- 4. Latin America
- 5. Middle East and Africa
Affective Computing Industry REPORT HIGHLIGHTS
| Aspects | Details |
|---|---|
| Study Period | 2019-2033 |
| Base Year | 2024 |
| Estimated Year | 2025 |
| Forecast Period | 2025-2033 |
| Historical Period | 2019-2024 |
| Growth Rate | CAGR of 24.29% from 2019-2033 |
| Segmentation |
|
Table of Contents
- 1. Introduction
- 1.1. Research Scope
- 1.2. Market Segmentation
- 1.3. Research Methodology
- 1.4. Definitions and Assumptions
- 2. Executive Summary
- 2.1. Introduction
- 3. Market Dynamics
- 3.1. Introduction
- 3.2. Market Drivers
- 3.2.1. Increased Automation in Contact Centers; Increasing Adoption of Cloud-based Solutions and Online Solutions; Rising Technology Adoptions in Various Industries such as Automotive
- 3.3. Market Restrains
- 3.3.1. ; High Cost of RF Power
- 3.4. Market Trends
- 3.4.1. Rising Technology Adoptions in Various Industries such as Automotive
- 4. Market Factor Analysis
- 4.1. Porters Five Forces
- 4.2. Supply/Value Chain
- 4.3. PESTEL analysis
- 4.4. Market Entropy
- 4.5. Patent/Trademark Analysis
- 5. Global Affective Computing Industry Analysis, Insights and Forecast, 2019-2031
- 5.1. Market Analysis, Insights and Forecast - by Component
- 5.1.1. Hardware
- 5.1.1.1. Sensors
- 5.1.1.2. Cameras
- 5.1.1.3. Storage Devices and Processors
- 5.1.1.4. Other Components
- 5.1.2. Software
- 5.1.2.1. Analytics Software
- 5.1.2.2. Enterprise Software
- 5.1.2.3. Facial Recognition
- 5.1.2.4. Gesture Recognition
- 5.1.2.5. Speech Recognition
- 5.1.1. Hardware
- 5.2. Market Analysis, Insights and Forecast - by End-user Industry
- 5.2.1. Healthcare
- 5.2.2. Automotive
- 5.2.3. Retail
- 5.2.4. Other End-user Industries
- 5.3. Market Analysis, Insights and Forecast - by Region
- 5.3.1. North America
- 5.3.2. Europe
- 5.3.3. Asia
- 5.3.4. Latin America
- 5.3.5. Middle East and Africa
- 5.1. Market Analysis, Insights and Forecast - by Component
- 6. North America Affective Computing Industry Analysis, Insights and Forecast, 2019-2031
- 6.1. Market Analysis, Insights and Forecast - by Component
- 6.1.1. Hardware
- 6.1.1.1. Sensors
- 6.1.1.2. Cameras
- 6.1.1.3. Storage Devices and Processors
- 6.1.1.4. Other Components
- 6.1.2. Software
- 6.1.2.1. Analytics Software
- 6.1.2.2. Enterprise Software
- 6.1.2.3. Facial Recognition
- 6.1.2.4. Gesture Recognition
- 6.1.2.5. Speech Recognition
- 6.1.1. Hardware
- 6.2. Market Analysis, Insights and Forecast - by End-user Industry
- 6.2.1. Healthcare
- 6.2.2. Automotive
- 6.2.3. Retail
- 6.2.4. Other End-user Industries
- 6.1. Market Analysis, Insights and Forecast - by Component
- 7. Europe Affective Computing Industry Analysis, Insights and Forecast, 2019-2031
- 7.1. Market Analysis, Insights and Forecast - by Component
- 7.1.1. Hardware
- 7.1.1.1. Sensors
- 7.1.1.2. Cameras
- 7.1.1.3. Storage Devices and Processors
- 7.1.1.4. Other Components
- 7.1.2. Software
- 7.1.2.1. Analytics Software
- 7.1.2.2. Enterprise Software
- 7.1.2.3. Facial Recognition
- 7.1.2.4. Gesture Recognition
- 7.1.2.5. Speech Recognition
- 7.1.1. Hardware
- 7.2. Market Analysis, Insights and Forecast - by End-user Industry
- 7.2.1. Healthcare
- 7.2.2. Automotive
- 7.2.3. Retail
- 7.2.4. Other End-user Industries
- 7.1. Market Analysis, Insights and Forecast - by Component
- 8. Asia Affective Computing Industry Analysis, Insights and Forecast, 2019-2031
- 8.1. Market Analysis, Insights and Forecast - by Component
- 8.1.1. Hardware
- 8.1.1.1. Sensors
- 8.1.1.2. Cameras
- 8.1.1.3. Storage Devices and Processors
- 8.1.1.4. Other Components
- 8.1.2. Software
- 8.1.2.1. Analytics Software
- 8.1.2.2. Enterprise Software
- 8.1.2.3. Facial Recognition
- 8.1.2.4. Gesture Recognition
- 8.1.2.5. Speech Recognition
- 8.1.1. Hardware
- 8.2. Market Analysis, Insights and Forecast - by End-user Industry
- 8.2.1. Healthcare
- 8.2.2. Automotive
- 8.2.3. Retail
- 8.2.4. Other End-user Industries
- 8.1. Market Analysis, Insights and Forecast - by Component
- 9. Latin America Affective Computing Industry Analysis, Insights and Forecast, 2019-2031
- 9.1. Market Analysis, Insights and Forecast - by Component
- 9.1.1. Hardware
- 9.1.1.1. Sensors
- 9.1.1.2. Cameras
- 9.1.1.3. Storage Devices and Processors
- 9.1.1.4. Other Components
- 9.1.2. Software
- 9.1.2.1. Analytics Software
- 9.1.2.2. Enterprise Software
- 9.1.2.3. Facial Recognition
- 9.1.2.4. Gesture Recognition
- 9.1.2.5. Speech Recognition
- 9.1.1. Hardware
- 9.2. Market Analysis, Insights and Forecast - by End-user Industry
- 9.2.1. Healthcare
- 9.2.2. Automotive
- 9.2.3. Retail
- 9.2.4. Other End-user Industries
- 9.1. Market Analysis, Insights and Forecast - by Component
- 10. Middle East and Africa Affective Computing Industry Analysis, Insights and Forecast, 2019-2031
- 10.1. Market Analysis, Insights and Forecast - by Component
- 10.1.1. Hardware
- 10.1.1.1. Sensors
- 10.1.1.2. Cameras
- 10.1.1.3. Storage Devices and Processors
- 10.1.1.4. Other Components
- 10.1.2. Software
- 10.1.2.1. Analytics Software
- 10.1.2.2. Enterprise Software
- 10.1.2.3. Facial Recognition
- 10.1.2.4. Gesture Recognition
- 10.1.2.5. Speech Recognition
- 10.1.1. Hardware
- 10.2. Market Analysis, Insights and Forecast - by End-user Industry
- 10.2.1. Healthcare
- 10.2.2. Automotive
- 10.2.3. Retail
- 10.2.4. Other End-user Industries
- 10.1. Market Analysis, Insights and Forecast - by Component
- 11. North America Affective Computing Industry Analysis, Insights and Forecast, 2019-2031
- 11.1. Market Analysis, Insights and Forecast - By Country/Sub-region
- 11.1.1 United States
- 11.1.2 Canada
- 11.1.3 Mexico
- 12. Europe Affective Computing Industry Analysis, Insights and Forecast, 2019-2031
- 12.1. Market Analysis, Insights and Forecast - By Country/Sub-region
- 12.1.1 Germany
- 12.1.2 United Kingdom
- 12.1.3 France
- 12.1.4 Spain
- 12.1.5 Italy
- 12.1.6 Spain
- 12.1.7 Belgium
- 12.1.8 Netherland
- 12.1.9 Nordics
- 12.1.10 Rest of Europe
- 13. Asia Pacific Affective Computing Industry Analysis, Insights and Forecast, 2019-2031
- 13.1. Market Analysis, Insights and Forecast - By Country/Sub-region
- 13.1.1 China
- 13.1.2 Japan
- 13.1.3 India
- 13.1.4 South Korea
- 13.1.5 Southeast Asia
- 13.1.6 Australia
- 13.1.7 Indonesia
- 13.1.8 Phillipes
- 13.1.9 Singapore
- 13.1.10 Thailandc
- 13.1.11 Rest of Asia Pacific
- 14. South America Affective Computing Industry Analysis, Insights and Forecast, 2019-2031
- 14.1. Market Analysis, Insights and Forecast - By Country/Sub-region
- 14.1.1 Brazil
- 14.1.2 Argentina
- 14.1.3 Peru
- 14.1.4 Chile
- 14.1.5 Colombia
- 14.1.6 Ecuador
- 14.1.7 Venezuela
- 14.1.8 Rest of South America
- 15. North America Affective Computing Industry Analysis, Insights and Forecast, 2019-2031
- 15.1. Market Analysis, Insights and Forecast - By Country/Sub-region
- 15.1.1 United States
- 15.1.2 Canada
- 15.1.3 Mexico
- 16. MEA Affective Computing Industry Analysis, Insights and Forecast, 2019-2031
- 16.1. Market Analysis, Insights and Forecast - By Country/Sub-region
- 16.1.1 United Arab Emirates
- 16.1.2 Saudi Arabia
- 16.1.3 South Africa
- 16.1.4 Rest of Middle East and Africa
- 17. Competitive Analysis
- 17.1. Global Market Share Analysis 2024
- 17.2. Company Profiles
- 17.2.1 Eyesight Technologies Ltd
- 17.2.1.1. Overview
- 17.2.1.2. Products
- 17.2.1.3. SWOT Analysis
- 17.2.1.4. Recent Developments
- 17.2.1.5. Financials (Based on Availability)
- 17.2.2 IBM Corporation
- 17.2.2.1. Overview
- 17.2.2.2. Products
- 17.2.2.3. SWOT Analysis
- 17.2.2.4. Recent Developments
- 17.2.2.5. Financials (Based on Availability)
- 17.2.3 Nuance Communications Inc (Microsoft Corporation)
- 17.2.3.1. Overview
- 17.2.3.2. Products
- 17.2.3.3. SWOT Analysis
- 17.2.3.4. Recent Developments
- 17.2.3.5. Financials (Based on Availability)
- 17.2.4 Realeyes Data Services Ltd
- 17.2.4.1. Overview
- 17.2.4.2. Products
- 17.2.4.3. SWOT Analysis
- 17.2.4.4. Recent Developments
- 17.2.4.5. Financials (Based on Availability)
- 17.2.5 Nemesysco Ltd
- 17.2.5.1. Overview
- 17.2.5.2. Products
- 17.2.5.3. SWOT Analysis
- 17.2.5.4. Recent Developments
- 17.2.5.5. Financials (Based on Availability)
- 17.2.6 Kairos AR Inc
- 17.2.6.1. Overview
- 17.2.6.2. Products
- 17.2.6.3. SWOT Analysis
- 17.2.6.4. Recent Developments
- 17.2.6.5. Financials (Based on Availability)
- 17.2.7 Affectiva Inc
- 17.2.7.1. Overview
- 17.2.7.2. Products
- 17.2.7.3. SWOT Analysis
- 17.2.7.4. Recent Developments
- 17.2.7.5. Financials (Based on Availability)
- 17.2.8 Amazon Web Services Inc
- 17.2.8.1. Overview
- 17.2.8.2. Products
- 17.2.8.3. SWOT Analysis
- 17.2.8.4. Recent Developments
- 17.2.8.5. Financials (Based on Availability)
- 17.2.9 audEERING GmbH
- 17.2.9.1. Overview
- 17.2.9.2. Products
- 17.2.9.3. SWOT Analysis
- 17.2.9.4. Recent Developments
- 17.2.9.5. Financials (Based on Availability)
- 17.2.10 Emotibot Technologies Limited
- 17.2.10.1. Overview
- 17.2.10.2. Products
- 17.2.10.3. SWOT Analysis
- 17.2.10.4. Recent Developments
- 17.2.10.5. Financials (Based on Availability)
- 17.2.11 Element Human Ltd
- 17.2.11.1. Overview
- 17.2.11.2. Products
- 17.2.11.3. SWOT Analysis
- 17.2.11.4. Recent Developments
- 17.2.11.5. Financials (Based on Availability)
- 17.2.12 Gesturetek Inc
- 17.2.12.1. Overview
- 17.2.12.2. Products
- 17.2.12.3. SWOT Analysis
- 17.2.12.4. Recent Developments
- 17.2.12.5. Financials (Based on Availability)
- 17.2.1 Eyesight Technologies Ltd
List of Figures
- Figure 1: Global Affective Computing Industry Revenue Breakdown (Million, %) by Region 2024 & 2032
- Figure 2: Global Affective Computing Industry Volume Breakdown (K Unit, %) by Region 2024 & 2032
- Figure 3: North America Affective Computing Industry Revenue (Million), by Country 2024 & 2032
- Figure 4: North America Affective Computing Industry Volume (K Unit), by Country 2024 & 2032
- Figure 5: North America Affective Computing Industry Revenue Share (%), by Country 2024 & 2032
- Figure 6: North America Affective Computing Industry Volume Share (%), by Country 2024 & 2032
- Figure 7: Europe Affective Computing Industry Revenue (Million), by Country 2024 & 2032
- Figure 8: Europe Affective Computing Industry Volume (K Unit), by Country 2024 & 2032
- Figure 9: Europe Affective Computing Industry Revenue Share (%), by Country 2024 & 2032
- Figure 10: Europe Affective Computing Industry Volume Share (%), by Country 2024 & 2032
- Figure 11: Asia Pacific Affective Computing Industry Revenue (Million), by Country 2024 & 2032
- Figure 12: Asia Pacific Affective Computing Industry Volume (K Unit), by Country 2024 & 2032
- Figure 13: Asia Pacific Affective Computing Industry Revenue Share (%), by Country 2024 & 2032
- Figure 14: Asia Pacific Affective Computing Industry Volume Share (%), by Country 2024 & 2032
- Figure 15: South America Affective Computing Industry Revenue (Million), by Country 2024 & 2032
- Figure 16: South America Affective Computing Industry Volume (K Unit), by Country 2024 & 2032
- Figure 17: South America Affective Computing Industry Revenue Share (%), by Country 2024 & 2032
- Figure 18: South America Affective Computing Industry Volume Share (%), by Country 2024 & 2032
- Figure 19: North America Affective Computing Industry Revenue (Million), by Country 2024 & 2032
- Figure 20: North America Affective Computing Industry Volume (K Unit), by Country 2024 & 2032
- Figure 21: North America Affective Computing Industry Revenue Share (%), by Country 2024 & 2032
- Figure 22: North America Affective Computing Industry Volume Share (%), by Country 2024 & 2032
- Figure 23: MEA Affective Computing Industry Revenue (Million), by Country 2024 & 2032
- Figure 24: MEA Affective Computing Industry Volume (K Unit), by Country 2024 & 2032
- Figure 25: MEA Affective Computing Industry Revenue Share (%), by Country 2024 & 2032
- Figure 26: MEA Affective Computing Industry Volume Share (%), by Country 2024 & 2032
- Figure 27: North America Affective Computing Industry Revenue (Million), by Component 2024 & 2032
- Figure 28: North America Affective Computing Industry Volume (K Unit), by Component 2024 & 2032
- Figure 29: North America Affective Computing Industry Revenue Share (%), by Component 2024 & 2032
- Figure 30: North America Affective Computing Industry Volume Share (%), by Component 2024 & 2032
- Figure 31: North America Affective Computing Industry Revenue (Million), by End-user Industry 2024 & 2032
- Figure 32: North America Affective Computing Industry Volume (K Unit), by End-user Industry 2024 & 2032
- Figure 33: North America Affective Computing Industry Revenue Share (%), by End-user Industry 2024 & 2032
- Figure 34: North America Affective Computing Industry Volume Share (%), by End-user Industry 2024 & 2032
- Figure 35: North America Affective Computing Industry Revenue (Million), by Country 2024 & 2032
- Figure 36: North America Affective Computing Industry Volume (K Unit), by Country 2024 & 2032
- Figure 37: North America Affective Computing Industry Revenue Share (%), by Country 2024 & 2032
- Figure 38: North America Affective Computing Industry Volume Share (%), by Country 2024 & 2032
- Figure 39: Europe Affective Computing Industry Revenue (Million), by Component 2024 & 2032
- Figure 40: Europe Affective Computing Industry Volume (K Unit), by Component 2024 & 2032
- Figure 41: Europe Affective Computing Industry Revenue Share (%), by Component 2024 & 2032
- Figure 42: Europe Affective Computing Industry Volume Share (%), by Component 2024 & 2032
- Figure 43: Europe Affective Computing Industry Revenue (Million), by End-user Industry 2024 & 2032
- Figure 44: Europe Affective Computing Industry Volume (K Unit), by End-user Industry 2024 & 2032
- Figure 45: Europe Affective Computing Industry Revenue Share (%), by End-user Industry 2024 & 2032
- Figure 46: Europe Affective Computing Industry Volume Share (%), by End-user Industry 2024 & 2032
- Figure 47: Europe Affective Computing Industry Revenue (Million), by Country 2024 & 2032
- Figure 48: Europe Affective Computing Industry Volume (K Unit), by Country 2024 & 2032
- Figure 49: Europe Affective Computing Industry Revenue Share (%), by Country 2024 & 2032
- Figure 50: Europe Affective Computing Industry Volume Share (%), by Country 2024 & 2032
- Figure 51: Asia Affective Computing Industry Revenue (Million), by Component 2024 & 2032
- Figure 52: Asia Affective Computing Industry Volume (K Unit), by Component 2024 & 2032
- Figure 53: Asia Affective Computing Industry Revenue Share (%), by Component 2024 & 2032
- Figure 54: Asia Affective Computing Industry Volume Share (%), by Component 2024 & 2032
- Figure 55: Asia Affective Computing Industry Revenue (Million), by End-user Industry 2024 & 2032
- Figure 56: Asia Affective Computing Industry Volume (K Unit), by End-user Industry 2024 & 2032
- Figure 57: Asia Affective Computing Industry Revenue Share (%), by End-user Industry 2024 & 2032
- Figure 58: Asia Affective Computing Industry Volume Share (%), by End-user Industry 2024 & 2032
- Figure 59: Asia Affective Computing Industry Revenue (Million), by Country 2024 & 2032
- Figure 60: Asia Affective Computing Industry Volume (K Unit), by Country 2024 & 2032
- Figure 61: Asia Affective Computing Industry Revenue Share (%), by Country 2024 & 2032
- Figure 62: Asia Affective Computing Industry Volume Share (%), by Country 2024 & 2032
- Figure 63: Latin America Affective Computing Industry Revenue (Million), by Component 2024 & 2032
- Figure 64: Latin America Affective Computing Industry Volume (K Unit), by Component 2024 & 2032
- Figure 65: Latin America Affective Computing Industry Revenue Share (%), by Component 2024 & 2032
- Figure 66: Latin America Affective Computing Industry Volume Share (%), by Component 2024 & 2032
- Figure 67: Latin America Affective Computing Industry Revenue (Million), by End-user Industry 2024 & 2032
- Figure 68: Latin America Affective Computing Industry Volume (K Unit), by End-user Industry 2024 & 2032
- Figure 69: Latin America Affective Computing Industry Revenue Share (%), by End-user Industry 2024 & 2032
- Figure 70: Latin America Affective Computing Industry Volume Share (%), by End-user Industry 2024 & 2032
- Figure 71: Latin America Affective Computing Industry Revenue (Million), by Country 2024 & 2032
- Figure 72: Latin America Affective Computing Industry Volume (K Unit), by Country 2024 & 2032
- Figure 73: Latin America Affective Computing Industry Revenue Share (%), by Country 2024 & 2032
- Figure 74: Latin America Affective Computing Industry Volume Share (%), by Country 2024 & 2032
- Figure 75: Middle East and Africa Affective Computing Industry Revenue (Million), by Component 2024 & 2032
- Figure 76: Middle East and Africa Affective Computing Industry Volume (K Unit), by Component 2024 & 2032
- Figure 77: Middle East and Africa Affective Computing Industry Revenue Share (%), by Component 2024 & 2032
- Figure 78: Middle East and Africa Affective Computing Industry Volume Share (%), by Component 2024 & 2032
- Figure 79: Middle East and Africa Affective Computing Industry Revenue (Million), by End-user Industry 2024 & 2032
- Figure 80: Middle East and Africa Affective Computing Industry Volume (K Unit), by End-user Industry 2024 & 2032
- Figure 81: Middle East and Africa Affective Computing Industry Revenue Share (%), by End-user Industry 2024 & 2032
- Figure 82: Middle East and Africa Affective Computing Industry Volume Share (%), by End-user Industry 2024 & 2032
- Figure 83: Middle East and Africa Affective Computing Industry Revenue (Million), by Country 2024 & 2032
- Figure 84: Middle East and Africa Affective Computing Industry Volume (K Unit), by Country 2024 & 2032
- Figure 85: Middle East and Africa Affective Computing Industry Revenue Share (%), by Country 2024 & 2032
- Figure 86: Middle East and Africa Affective Computing Industry Volume Share (%), by Country 2024 & 2032
List of Tables
- Table 1: Global Affective Computing Industry Revenue Million Forecast, by Region 2019 & 2032
- Table 2: Global Affective Computing Industry Volume K Unit Forecast, by Region 2019 & 2032
- Table 3: Global Affective Computing Industry Revenue Million Forecast, by Component 2019 & 2032
- Table 4: Global Affective Computing Industry Volume K Unit Forecast, by Component 2019 & 2032
- Table 5: Global Affective Computing Industry Revenue Million Forecast, by End-user Industry 2019 & 2032
- Table 6: Global Affective Computing Industry Volume K Unit Forecast, by End-user Industry 2019 & 2032
- Table 7: Global Affective Computing Industry Revenue Million Forecast, by Region 2019 & 2032
- Table 8: Global Affective Computing Industry Volume K Unit Forecast, by Region 2019 & 2032
- Table 9: Global Affective Computing Industry Revenue Million Forecast, by Country 2019 & 2032
- Table 10: Global Affective Computing Industry Volume K Unit Forecast, by Country 2019 & 2032
- Table 11: United States Affective Computing Industry Revenue (Million) Forecast, by Application 2019 & 2032
- Table 12: United States Affective Computing Industry Volume (K Unit) Forecast, by Application 2019 & 2032
- Table 13: Canada Affective Computing Industry Revenue (Million) Forecast, by Application 2019 & 2032
- Table 14: Canada Affective Computing Industry Volume (K Unit) Forecast, by Application 2019 & 2032
- Table 15: Mexico Affective Computing Industry Revenue (Million) Forecast, by Application 2019 & 2032
- Table 16: Mexico Affective Computing Industry Volume (K Unit) Forecast, by Application 2019 & 2032
- Table 17: Global Affective Computing Industry Revenue Million Forecast, by Country 2019 & 2032
- Table 18: Global Affective Computing Industry Volume K Unit Forecast, by Country 2019 & 2032
- Table 19: Germany Affective Computing Industry Revenue (Million) Forecast, by Application 2019 & 2032
- Table 20: Germany Affective Computing Industry Volume (K Unit) Forecast, by Application 2019 & 2032
- Table 21: United Kingdom Affective Computing Industry Revenue (Million) Forecast, by Application 2019 & 2032
- Table 22: United Kingdom Affective Computing Industry Volume (K Unit) Forecast, by Application 2019 & 2032
- Table 23: France Affective Computing Industry Revenue (Million) Forecast, by Application 2019 & 2032
- Table 24: France Affective Computing Industry Volume (K Unit) Forecast, by Application 2019 & 2032
- Table 25: Spain Affective Computing Industry Revenue (Million) Forecast, by Application 2019 & 2032
- Table 26: Spain Affective Computing Industry Volume (K Unit) Forecast, by Application 2019 & 2032
- Table 27: Italy Affective Computing Industry Revenue (Million) Forecast, by Application 2019 & 2032
- Table 28: Italy Affective Computing Industry Volume (K Unit) Forecast, by Application 2019 & 2032
- Table 29: Spain Affective Computing Industry Revenue (Million) Forecast, by Application 2019 & 2032
- Table 30: Spain Affective Computing Industry Volume (K Unit) Forecast, by Application 2019 & 2032
- Table 31: Belgium Affective Computing Industry Revenue (Million) Forecast, by Application 2019 & 2032
- Table 32: Belgium Affective Computing Industry Volume (K Unit) Forecast, by Application 2019 & 2032
- Table 33: Netherland Affective Computing Industry Revenue (Million) Forecast, by Application 2019 & 2032
- Table 34: Netherland Affective Computing Industry Volume (K Unit) Forecast, by Application 2019 & 2032
- Table 35: Nordics Affective Computing Industry Revenue (Million) Forecast, by Application 2019 & 2032
- Table 36: Nordics Affective Computing Industry Volume (K Unit) Forecast, by Application 2019 & 2032
- Table 37: Rest of Europe Affective Computing Industry Revenue (Million) Forecast, by Application 2019 & 2032
- Table 38: Rest of Europe Affective Computing Industry Volume (K Unit) Forecast, by Application 2019 & 2032
- Table 39: Global Affective Computing Industry Revenue Million Forecast, by Country 2019 & 2032
- Table 40: Global Affective Computing Industry Volume K Unit Forecast, by Country 2019 & 2032
- Table 41: China Affective Computing Industry Revenue (Million) Forecast, by Application 2019 & 2032
- Table 42: China Affective Computing Industry Volume (K Unit) Forecast, by Application 2019 & 2032
- Table 43: Japan Affective Computing Industry Revenue (Million) Forecast, by Application 2019 & 2032
- Table 44: Japan Affective Computing Industry Volume (K Unit) Forecast, by Application 2019 & 2032
- Table 45: India Affective Computing Industry Revenue (Million) Forecast, by Application 2019 & 2032
- Table 46: India Affective Computing Industry Volume (K Unit) Forecast, by Application 2019 & 2032
- Table 47: South Korea Affective Computing Industry Revenue (Million) Forecast, by Application 2019 & 2032
- Table 48: South Korea Affective Computing Industry Volume (K Unit) Forecast, by Application 2019 & 2032
- Table 49: Southeast Asia Affective Computing Industry Revenue (Million) Forecast, by Application 2019 & 2032
- Table 50: Southeast Asia Affective Computing Industry Volume (K Unit) Forecast, by Application 2019 & 2032
- Table 51: Australia Affective Computing Industry Revenue (Million) Forecast, by Application 2019 & 2032
- Table 52: Australia Affective Computing Industry Volume (K Unit) Forecast, by Application 2019 & 2032
- Table 53: Indonesia Affective Computing Industry Revenue (Million) Forecast, by Application 2019 & 2032
- Table 54: Indonesia Affective Computing Industry Volume (K Unit) Forecast, by Application 2019 & 2032
- Table 55: Phillipes Affective Computing Industry Revenue (Million) Forecast, by Application 2019 & 2032
- Table 56: Phillipes Affective Computing Industry Volume (K Unit) Forecast, by Application 2019 & 2032
- Table 57: Singapore Affective Computing Industry Revenue (Million) Forecast, by Application 2019 & 2032
- Table 58: Singapore Affective Computing Industry Volume (K Unit) Forecast, by Application 2019 & 2032
- Table 59: Thailandc Affective Computing Industry Revenue (Million) Forecast, by Application 2019 & 2032
- Table 60: Thailandc Affective Computing Industry Volume (K Unit) Forecast, by Application 2019 & 2032
- Table 61: Rest of Asia Pacific Affective Computing Industry Revenue (Million) Forecast, by Application 2019 & 2032
- Table 62: Rest of Asia Pacific Affective Computing Industry Volume (K Unit) Forecast, by Application 2019 & 2032
- Table 63: Global Affective Computing Industry Revenue Million Forecast, by Country 2019 & 2032
- Table 64: Global Affective Computing Industry Volume K Unit Forecast, by Country 2019 & 2032
- Table 65: Brazil Affective Computing Industry Revenue (Million) Forecast, by Application 2019 & 2032
- Table 66: Brazil Affective Computing Industry Volume (K Unit) Forecast, by Application 2019 & 2032
- Table 67: Argentina Affective Computing Industry Revenue (Million) Forecast, by Application 2019 & 2032
- Table 68: Argentina Affective Computing Industry Volume (K Unit) Forecast, by Application 2019 & 2032
- Table 69: Peru Affective Computing Industry Revenue (Million) Forecast, by Application 2019 & 2032
- Table 70: Peru Affective Computing Industry Volume (K Unit) Forecast, by Application 2019 & 2032
- Table 71: Chile Affective Computing Industry Revenue (Million) Forecast, by Application 2019 & 2032
- Table 72: Chile Affective Computing Industry Volume (K Unit) Forecast, by Application 2019 & 2032
- Table 73: Colombia Affective Computing Industry Revenue (Million) Forecast, by Application 2019 & 2032
- Table 74: Colombia Affective Computing Industry Volume (K Unit) Forecast, by Application 2019 & 2032
- Table 75: Ecuador Affective Computing Industry Revenue (Million) Forecast, by Application 2019 & 2032
- Table 76: Ecuador Affective Computing Industry Volume (K Unit) Forecast, by Application 2019 & 2032
- Table 77: Venezuela Affective Computing Industry Revenue (Million) Forecast, by Application 2019 & 2032
- Table 78: Venezuela Affective Computing Industry Volume (K Unit) Forecast, by Application 2019 & 2032
- Table 79: Rest of South America Affective Computing Industry Revenue (Million) Forecast, by Application 2019 & 2032
- Table 80: Rest of South America Affective Computing Industry Volume (K Unit) Forecast, by Application 2019 & 2032
- Table 81: Global Affective Computing Industry Revenue Million Forecast, by Country 2019 & 2032
- Table 82: Global Affective Computing Industry Volume K Unit Forecast, by Country 2019 & 2032
- Table 83: United States Affective Computing Industry Revenue (Million) Forecast, by Application 2019 & 2032
- Table 84: United States Affective Computing Industry Volume (K Unit) Forecast, by Application 2019 & 2032
- Table 85: Canada Affective Computing Industry Revenue (Million) Forecast, by Application 2019 & 2032
- Table 86: Canada Affective Computing Industry Volume (K Unit) Forecast, by Application 2019 & 2032
- Table 87: Mexico Affective Computing Industry Revenue (Million) Forecast, by Application 2019 & 2032
- Table 88: Mexico Affective Computing Industry Volume (K Unit) Forecast, by Application 2019 & 2032
- Table 89: Global Affective Computing Industry Revenue Million Forecast, by Country 2019 & 2032
- Table 90: Global Affective Computing Industry Volume K Unit Forecast, by Country 2019 & 2032
- Table 91: United Arab Emirates Affective Computing Industry Revenue (Million) Forecast, by Application 2019 & 2032
- Table 92: United Arab Emirates Affective Computing Industry Volume (K Unit) Forecast, by Application 2019 & 2032
- Table 93: Saudi Arabia Affective Computing Industry Revenue (Million) Forecast, by Application 2019 & 2032
- Table 94: Saudi Arabia Affective Computing Industry Volume (K Unit) Forecast, by Application 2019 & 2032
- Table 95: South Africa Affective Computing Industry Revenue (Million) Forecast, by Application 2019 & 2032
- Table 96: South Africa Affective Computing Industry Volume (K Unit) Forecast, by Application 2019 & 2032
- Table 97: Rest of Middle East and Africa Affective Computing Industry Revenue (Million) Forecast, by Application 2019 & 2032
- Table 98: Rest of Middle East and Africa Affective Computing Industry Volume (K Unit) Forecast, by Application 2019 & 2032
- Table 99: Global Affective Computing Industry Revenue Million Forecast, by Component 2019 & 2032
- Table 100: Global Affective Computing Industry Volume K Unit Forecast, by Component 2019 & 2032
- Table 101: Global Affective Computing Industry Revenue Million Forecast, by End-user Industry 2019 & 2032
- Table 102: Global Affective Computing Industry Volume K Unit Forecast, by End-user Industry 2019 & 2032
- Table 103: Global Affective Computing Industry Revenue Million Forecast, by Country 2019 & 2032
- Table 104: Global Affective Computing Industry Volume K Unit Forecast, by Country 2019 & 2032
- Table 105: Global Affective Computing Industry Revenue Million Forecast, by Component 2019 & 2032
- Table 106: Global Affective Computing Industry Volume K Unit Forecast, by Component 2019 & 2032
- Table 107: Global Affective Computing Industry Revenue Million Forecast, by End-user Industry 2019 & 2032
- Table 108: Global Affective Computing Industry Volume K Unit Forecast, by End-user Industry 2019 & 2032
- Table 109: Global Affective Computing Industry Revenue Million Forecast, by Country 2019 & 2032
- Table 110: Global Affective Computing Industry Volume K Unit Forecast, by Country 2019 & 2032
- Table 111: Global Affective Computing Industry Revenue Million Forecast, by Component 2019 & 2032
- Table 112: Global Affective Computing Industry Volume K Unit Forecast, by Component 2019 & 2032
- Table 113: Global Affective Computing Industry Revenue Million Forecast, by End-user Industry 2019 & 2032
- Table 114: Global Affective Computing Industry Volume K Unit Forecast, by End-user Industry 2019 & 2032
- Table 115: Global Affective Computing Industry Revenue Million Forecast, by Country 2019 & 2032
- Table 116: Global Affective Computing Industry Volume K Unit Forecast, by Country 2019 & 2032
- Table 117: Global Affective Computing Industry Revenue Million Forecast, by Component 2019 & 2032
- Table 118: Global Affective Computing Industry Volume K Unit Forecast, by Component 2019 & 2032
- Table 119: Global Affective Computing Industry Revenue Million Forecast, by End-user Industry 2019 & 2032
- Table 120: Global Affective Computing Industry Volume K Unit Forecast, by End-user Industry 2019 & 2032
- Table 121: Global Affective Computing Industry Revenue Million Forecast, by Country 2019 & 2032
- Table 122: Global Affective Computing Industry Volume K Unit Forecast, by Country 2019 & 2032
- Table 123: Global Affective Computing Industry Revenue Million Forecast, by Component 2019 & 2032
- Table 124: Global Affective Computing Industry Volume K Unit Forecast, by Component 2019 & 2032
- Table 125: Global Affective Computing Industry Revenue Million Forecast, by End-user Industry 2019 & 2032
- Table 126: Global Affective Computing Industry Volume K Unit Forecast, by End-user Industry 2019 & 2032
- Table 127: Global Affective Computing Industry Revenue Million Forecast, by Country 2019 & 2032
- Table 128: Global Affective Computing Industry Volume K Unit Forecast, by Country 2019 & 2032
Frequently Asked Questions
1. What is the projected Compound Annual Growth Rate (CAGR) of the Affective Computing Industry?
The projected CAGR is approximately 24.29%.
2. Which companies are prominent players in the Affective Computing Industry?
Key companies in the market include Eyesight Technologies Ltd, IBM Corporation, Nuance Communications Inc (Microsoft Corporation), Realeyes Data Services Ltd, Nemesysco Ltd, Kairos AR Inc, Affectiva Inc, Amazon Web Services Inc, audEERING GmbH, Emotibot Technologies Limited, Element Human Ltd, Gesturetek Inc.
3. What are the main segments of the Affective Computing Industry?
The market segments include Component, End-user Industry.
4. Can you provide details about the market size?
The market size is estimated to be USD 73.58 Million as of 2022.
5. What are some drivers contributing to market growth?
Increased Automation in Contact Centers; Increasing Adoption of Cloud-based Solutions and Online Solutions; Rising Technology Adoptions in Various Industries such as Automotive.
6. What are the notable trends driving market growth?
Rising Technology Adoptions in Various Industries such as Automotive.
7. Are there any restraints impacting market growth?
; High Cost of RF Power.
8. Can you provide examples of recent developments in the market?
September 2022: Nuance Communications, Inc. announced that Liberty Global expanded its use of Nuance Dragon TV for Virgin Media O2 customers in the United Kingdom. The expansion included new capabilities that provided enhanced support for visually impaired customers, such as reading aloud program information.
9. What pricing options are available for accessing the report?
Pricing options include single-user, multi-user, and enterprise licenses priced at USD 4750, USD 5250, and USD 8750 respectively.
10. Is the market size provided in terms of value or volume?
The market size is provided in terms of value, measured in Million and volume, measured in K Unit.
11. Are there any specific market keywords associated with the report?
Yes, the market keyword associated with the report is "Affective Computing Industry," which aids in identifying and referencing the specific market segment covered.
12. How do I determine which pricing option suits my needs best?
The pricing options vary based on user requirements and access needs. Individual users may opt for single-user licenses, while businesses requiring broader access may choose multi-user or enterprise licenses for cost-effective access to the report.
13. Are there any additional resources or data provided in the Affective Computing Industry report?
While the report offers comprehensive insights, it's advisable to review the specific contents or supplementary materials provided to ascertain if additional resources or data are available.
14. How can I stay updated on further developments or reports in the Affective Computing Industry?
To stay informed about further developments, trends, and reports in the Affective Computing Industry, consider subscribing to industry newsletters, following relevant companies and organizations, or regularly checking reputable industry news sources and publications.
Methodology
Step 1 - Identification of Relevant Samples Size from Population Database


Step 2 - Approaches for Defining Global Market Size (Value, Volume* & Price*)

Note*: In applicable scenarios
Step 3 - Data Sources
Primary Research
- Web Analytics
- Survey Reports
- Research Institute
- Latest Research Reports
- Opinion Leaders
Secondary Research
- Annual Reports
- White Paper
- Latest Press Release
- Industry Association
- Paid Database
- Investor Presentations

Step 4 - Data Triangulation
Involves using different sources of information in order to increase the validity of a study
These sources are likely to be stakeholders in a program - participants, other researchers, program staff, other community members, and so on.
Then we put all data in single framework & apply various statistical tools to find out the dynamic on the market.
During the analysis stage, feedback from the stakeholder groups would be compared to determine areas of agreement as well as areas of divergence


