
Key Insights
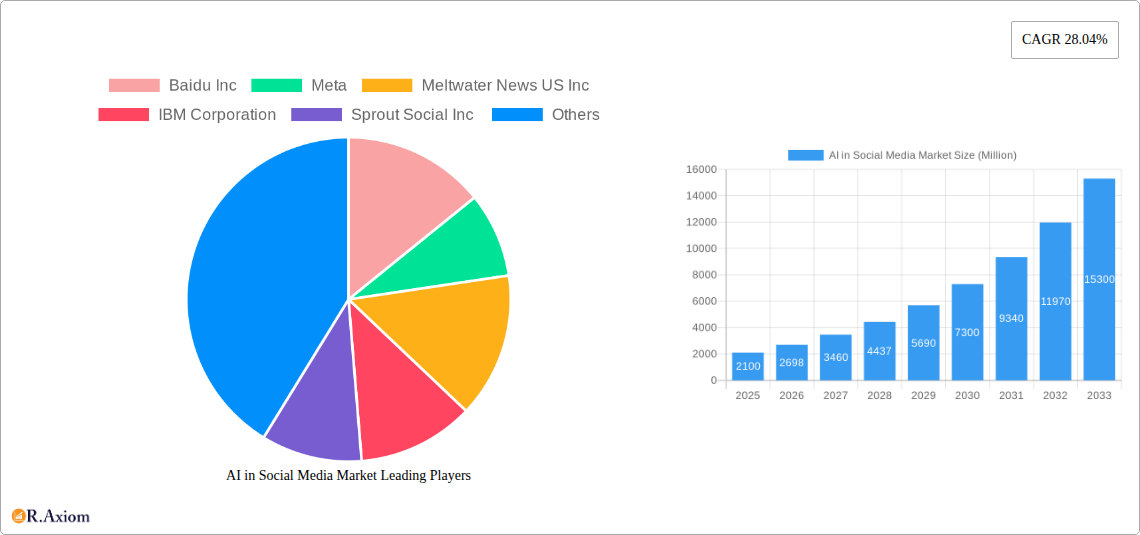
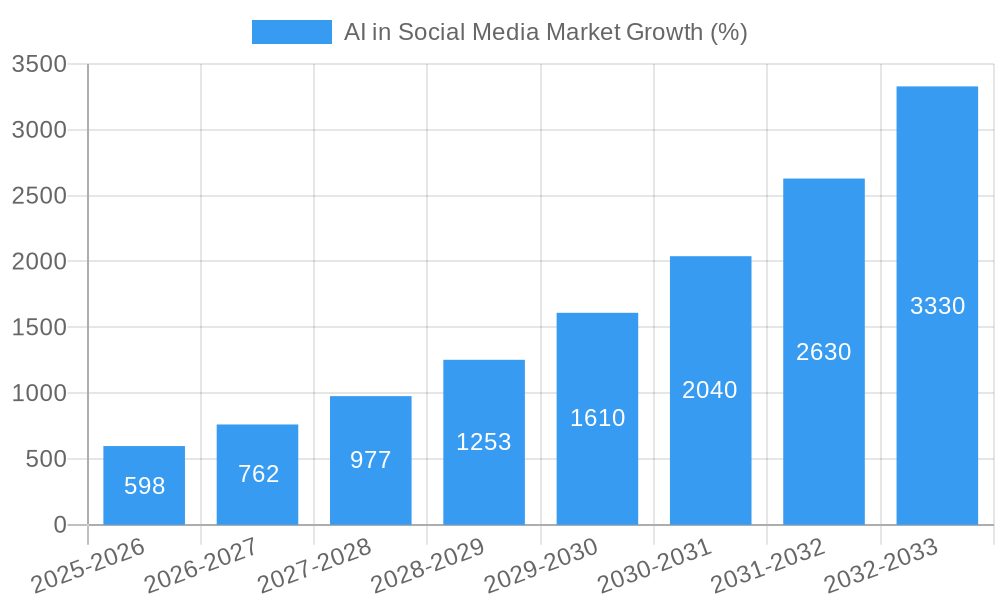
The AI in Social Media market is experiencing explosive growth, projected to reach \$2.10 billion in 2025 and maintain a robust Compound Annual Growth Rate (CAGR) of 28.04% from 2025 to 2033. This expansion is fueled by several key drivers. Firstly, the increasing volume of social media data necessitates AI-powered tools for efficient analysis and insights extraction. Businesses leverage these tools for improved customer experience management, targeted marketing campaigns, and proactive risk assessment. The rise of sophisticated technologies like machine learning, deep learning, and natural language processing (NLP) are significantly enhancing the capabilities of these platforms. Furthermore, the growing adoption of AI-driven solutions across diverse sectors, including retail, e-commerce, banking, and media, contributes significantly to market growth. The availability of managed and professional services further simplifies AI adoption for businesses of all sizes, from SMEs to large enterprises.
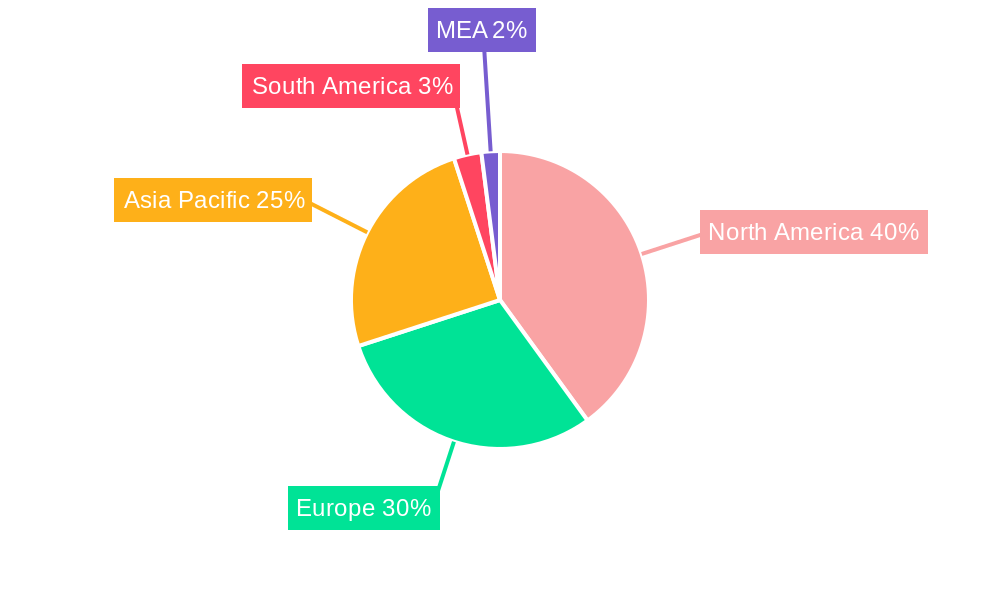
The market segmentation reveals a dynamic landscape. Customer experience management and sales & marketing applications are currently dominant, but image recognition and predictive risk assessment are exhibiting rapid growth, indicating evolving business priorities. Geographically, North America currently holds a significant market share due to early adoption and technological advancements. However, the Asia-Pacific region, particularly China and India, is poised for substantial growth given the burgeoning social media user base and increasing investment in AI technologies. While data security and privacy concerns represent potential restraints, the continuous innovation in AI algorithms and the development of robust security protocols are mitigating these challenges, ensuring sustained market growth over the forecast period.
AI in Social Media Market: A Comprehensive Report (2019-2033)
This in-depth report provides a comprehensive analysis of the AI in Social Media Market, covering market size, segmentation, key players, growth drivers, challenges, and future opportunities. The study period spans from 2019 to 2033, with 2025 serving as both the base and estimated year. The report offers actionable insights for industry stakeholders, including technology providers, end-users, and investors. The total market value is projected to reach xx Million by 2033.
AI in Social Media Market Market Concentration & Innovation
The AI in social media market exhibits a moderately concentrated landscape, with a few dominant players holding significant market share. While companies like Google LLC, Meta, and Microsoft Corporation lead, a diverse range of smaller companies and startups contribute to market innovation. Market share data for 2024 suggests Google holds approximately 25%, Meta holds 20%, and Microsoft holds 15%, with the remaining 40% fragmented across other players including Salesforce com Inc, IBM Corporation, and others.
Several factors drive innovation within the market:
- Technological advancements: Continuous improvements in machine learning, deep learning, and natural language processing (NLP) fuel the development of sophisticated AI-powered social media tools.
- Growing data volumes: The exponential growth of social media data provides rich datasets for training and refining AI algorithms.
- Increased demand for automation: Businesses increasingly seek AI solutions to automate social media management tasks, improving efficiency and ROI.
Regulatory frameworks, such as data privacy regulations (GDPR, CCPA), influence market dynamics. Product substitutes, like manual social media management, are becoming less competitive due to AI's efficiency gains. End-user trends show a strong preference for AI-powered tools offering personalized experiences and insightful analytics. M&A activity has been significant, with deal values exceeding xx Million in the last five years, driven by consolidation efforts and the acquisition of specialized AI technologies. For example, the average deal value in 2024 was approximately xx Million.
AI in Social Media Market Industry Trends & Insights
The AI in social media market is experiencing robust growth, driven by several key factors. The Compound Annual Growth Rate (CAGR) from 2025 to 2033 is projected to be xx%, indicating substantial expansion. Market penetration is currently at xx%, expected to reach xx% by 2033. Increased adoption of AI across various social media applications, including customer service, marketing, and advertising, is a major driver.
Technological disruptions, particularly advancements in NLP and computer vision, are enhancing the capabilities of AI-powered social media tools. Consumers increasingly value personalized content and automated services, leading to growing demand for AI-driven solutions. The competitive landscape is characterized by intense rivalry, with companies continuously innovating to offer superior features and functionalities. This includes the integration of AI with other technologies like blockchain for enhanced security and transparency in social media interactions.
Dominant Markets & Segments in AI in Social Media Market
Leading Regions/Countries: North America and Europe currently dominate the AI in social media market, driven by high technology adoption rates and a robust digital infrastructure. However, Asia-Pacific is experiencing rapid growth, fuelled by increasing internet penetration and a large social media user base.
Dominant Segments:
- Technology: Machine learning and deep learning are the most prevalent technologies, owing to their ability to process vast amounts of social media data. NLP is crucial for sentiment analysis and content understanding.
- Application: Customer experience management and sales and marketing are the leading applications, as businesses leverage AI for improved customer engagement and targeted advertising. Image recognition plays a significant role in content moderation and brand monitoring.
- Service: Managed services are popular, offering businesses access to expert AI capabilities without significant internal investment.
- Organization Size: Large enterprises are the largest adopters due to their greater resources and sophisticated needs. However, SMEs are rapidly adopting AI-powered solutions to enhance their social media presence.
- End-User Industry: The retail, e-commerce, and BFSI sectors are leading adopters, using AI for customer service, fraud detection, and targeted campaigns. Media and advertising heavily utilize AI for audience segmentation and ad optimization.
Key Drivers:
- Strong economic growth in developed economies.
- Robust digital infrastructure and high internet penetration.
- Favorable government policies supporting AI adoption.
AI in Social Media Market Product Developments
Recent product innovations focus on enhancing the accuracy, efficiency, and personalization of AI-powered social media tools. This includes advancements in sentiment analysis, predictive modeling, and content creation capabilities. Several companies are integrating AI with other technologies, such as blockchain, to address challenges like data privacy and security. The competitive advantage stems from offering unique functionalities, such as improved personalization algorithms, advanced analytics dashboards, and seamless integration with existing social media platforms.
Report Scope & Segmentation Analysis
This report segments the AI in social media market by technology (Machine Learning & Deep Learning, NLP), application (Customer Experience Management, Sales & Marketing, Image Recognition, Predictive Risk Assessment, Other Applications), service (Managed Service, Professional Service), organization size (Small & Medium Enterprises, Large Enterprises), and end-user industry (Retail, E-commerce, Banking, BFSI, Media & Advertising, Education, Other End-user Industries). Each segment's growth projections, market sizes, and competitive dynamics are analyzed in detail. For instance, the Customer Experience Management segment is projected to experience the highest CAGR due to increasing customer expectations for personalized and efficient service.
Key Drivers of AI in Social Media Market Growth
The AI in social media market is driven by several factors:
- Technological advancements: Continued improvements in machine learning and NLP algorithms are enhancing the capabilities of AI-powered tools.
- Growing demand for personalized experiences: Consumers value tailored content and recommendations, driving the adoption of AI-powered personalization tools.
- Increased focus on data-driven decision-making: Businesses increasingly rely on social media analytics to understand customer preferences and optimize campaigns.
Challenges in the AI in Social Media Market Sector
The market faces certain challenges:
- Data privacy and security concerns: Regulations like GDPR impose stringent requirements for handling social media data, adding complexity and cost.
- High implementation costs: Implementing AI-powered solutions can be expensive, particularly for SMEs with limited resources.
- Competition from established players: The market is highly competitive, with large technology companies vying for market share. This often translates into a price war, impacting profit margins.
Emerging Opportunities in AI in Social Media Market
Several emerging opportunities exist:
- Expansion into new markets: Developing economies with increasing internet penetration present significant growth potential.
- Integration with emerging technologies: Combining AI with blockchain, IoT, and VR/AR could unlock new functionalities and capabilities.
- Focus on ethical AI: Addressing bias and transparency in AI algorithms will build consumer trust and increase adoption.
Leading Players in the AI in Social Media Market Market
- Baidu Inc
- Meta
- Meltwater News US Inc
- IBM Corporation
- Sprout Social Inc
- Clarabridge Inc
- Google LLC
- Snap Inc
- Crimson Hexagon Inc
- Salesforce com Inc
- Microsoft Corporation
- Adobe Systems Incorporated
- Amazon Web Services Inc
- HootSuite Media Inc
Key Developments in AI in Social Media Market Industry
- October 2022: Meta announced a collaboration with Microsoft to integrate Microsoft 365 apps into Meta Quest devices, enhancing user experiences in VR. This strategic partnership expanded the reach of both companies into the metaverse and workplace collaboration.
- October 2022: Adobe unveiled new AI features in Creative Cloud and Adobe Express, focusing on enhanced creativity and content authenticity. These advancements improved content creation efficiency and user experience.
Strategic Outlook for AI in Social Media Market Market
The AI in social media market is poised for continued growth, driven by technological advancements, increased consumer demand for personalized experiences, and the growing adoption of AI across various industries. The focus on ethical AI and the integration of AI with other emerging technologies will shape future market dynamics. The market is expected to see increased consolidation through mergers and acquisitions, leading to a more concentrated landscape.
AI in Social Media Market Segmentation
-
1. Technology
- 1.1. Machine Learning and Deep Learning
- 1.2. Natural Language Processing (NLP)
-
2. Application
- 2.1. Customer Experience Management
- 2.2. Sales and Marketing
- 2.3. Image Recognition
- 2.4. Predictive Risk Assessment
- 2.5. Other Applications
-
3. Service
- 3.1. Managed Service
- 3.2. Professional Service
-
4. Organization Size
- 4.1. Small and Medium Enterprises
- 4.2. Large Enterprises
-
5. End-User Industry
- 5.1. Retail
- 5.2. E-commerce
- 5.3. Banking, Financial Services and Insurance (BFSI)
- 5.4. Media and Advertising
- 5.5. Education
- 5.6. Other End-user Industries
AI in Social Media Market Segmentation By Geography
-
1. North America
- 1.1. US
- 1.2. Canada
-
2. Europe
- 2.1. UK
- 2.2. Germany
- 2.3. France
- 2.4. Spain
- 2.5. Rest of Europe
-
3. Asia Pacific
- 3.1. China
- 3.2. Japan
- 3.3. India
- 3.4. South Korea
- 3.5. Rest of Asia Pacific
- 4. Latin America
- 5. Middle East and Africa
AI in Social Media Market REPORT HIGHLIGHTS
| Aspects | Details |
|---|---|
| Study Period | 2019-2033 |
| Base Year | 2024 |
| Estimated Year | 2025 |
| Forecast Period | 2025-2033 |
| Historical Period | 2019-2024 |
| Growth Rate | CAGR of 28.04% from 2019-2033 |
| Segmentation |
|
Table of Contents
- 1. Introduction
- 1.1. Research Scope
- 1.2. Market Segmentation
- 1.3. Research Methodology
- 1.4. Definitions and Assumptions
- 2. Executive Summary
- 2.1. Introduction
- 3. Market Dynamics
- 3.1. Introduction
- 3.2. Market Drivers
- 3.2.1. Integration of Artificial Intelligence Technology with Social Media for Effective Advertising; Increase in User Engagement on Social Media by Using Smartphones; Rise in Use of AI in Understanding Market Trends and Gaining Competitive Edge
- 3.3. Market Restrains
- 3.3.1. Limited Number of Artificial Intelligence Technology Experts; Low Adoption of AI in Developing Economies
- 3.4. Market Trends
- 3.4.1. Retail Industry to Witness a Significant Growth
- 4. Market Factor Analysis
- 4.1. Porters Five Forces
- 4.2. Supply/Value Chain
- 4.3. PESTEL analysis
- 4.4. Market Entropy
- 4.5. Patent/Trademark Analysis
- 5. Global AI in Social Media Market Analysis, Insights and Forecast, 2019-2031
- 5.1. Market Analysis, Insights and Forecast - by Technology
- 5.1.1. Machine Learning and Deep Learning
- 5.1.2. Natural Language Processing (NLP)
- 5.2. Market Analysis, Insights and Forecast - by Application
- 5.2.1. Customer Experience Management
- 5.2.2. Sales and Marketing
- 5.2.3. Image Recognition
- 5.2.4. Predictive Risk Assessment
- 5.2.5. Other Applications
- 5.3. Market Analysis, Insights and Forecast - by Service
- 5.3.1. Managed Service
- 5.3.2. Professional Service
- 5.4. Market Analysis, Insights and Forecast - by Organization Size
- 5.4.1. Small and Medium Enterprises
- 5.4.2. Large Enterprises
- 5.5. Market Analysis, Insights and Forecast - by End-User Industry
- 5.5.1. Retail
- 5.5.2. E-commerce
- 5.5.3. Banking, Financial Services and Insurance (BFSI)
- 5.5.4. Media and Advertising
- 5.5.5. Education
- 5.5.6. Other End-user Industries
- 5.6. Market Analysis, Insights and Forecast - by Region
- 5.6.1. North America
- 5.6.2. Europe
- 5.6.3. Asia Pacific
- 5.6.4. Latin America
- 5.6.5. Middle East and Africa
- 5.1. Market Analysis, Insights and Forecast - by Technology
- 6. North America AI in Social Media Market Analysis, Insights and Forecast, 2019-2031
- 6.1. Market Analysis, Insights and Forecast - by Technology
- 6.1.1. Machine Learning and Deep Learning
- 6.1.2. Natural Language Processing (NLP)
- 6.2. Market Analysis, Insights and Forecast - by Application
- 6.2.1. Customer Experience Management
- 6.2.2. Sales and Marketing
- 6.2.3. Image Recognition
- 6.2.4. Predictive Risk Assessment
- 6.2.5. Other Applications
- 6.3. Market Analysis, Insights and Forecast - by Service
- 6.3.1. Managed Service
- 6.3.2. Professional Service
- 6.4. Market Analysis, Insights and Forecast - by Organization Size
- 6.4.1. Small and Medium Enterprises
- 6.4.2. Large Enterprises
- 6.5. Market Analysis, Insights and Forecast - by End-User Industry
- 6.5.1. Retail
- 6.5.2. E-commerce
- 6.5.3. Banking, Financial Services and Insurance (BFSI)
- 6.5.4. Media and Advertising
- 6.5.5. Education
- 6.5.6. Other End-user Industries
- 6.1. Market Analysis, Insights and Forecast - by Technology
- 7. Europe AI in Social Media Market Analysis, Insights and Forecast, 2019-2031
- 7.1. Market Analysis, Insights and Forecast - by Technology
- 7.1.1. Machine Learning and Deep Learning
- 7.1.2. Natural Language Processing (NLP)
- 7.2. Market Analysis, Insights and Forecast - by Application
- 7.2.1. Customer Experience Management
- 7.2.2. Sales and Marketing
- 7.2.3. Image Recognition
- 7.2.4. Predictive Risk Assessment
- 7.2.5. Other Applications
- 7.3. Market Analysis, Insights and Forecast - by Service
- 7.3.1. Managed Service
- 7.3.2. Professional Service
- 7.4. Market Analysis, Insights and Forecast - by Organization Size
- 7.4.1. Small and Medium Enterprises
- 7.4.2. Large Enterprises
- 7.5. Market Analysis, Insights and Forecast - by End-User Industry
- 7.5.1. Retail
- 7.5.2. E-commerce
- 7.5.3. Banking, Financial Services and Insurance (BFSI)
- 7.5.4. Media and Advertising
- 7.5.5. Education
- 7.5.6. Other End-user Industries
- 7.1. Market Analysis, Insights and Forecast - by Technology
- 8. Asia Pacific AI in Social Media Market Analysis, Insights and Forecast, 2019-2031
- 8.1. Market Analysis, Insights and Forecast - by Technology
- 8.1.1. Machine Learning and Deep Learning
- 8.1.2. Natural Language Processing (NLP)
- 8.2. Market Analysis, Insights and Forecast - by Application
- 8.2.1. Customer Experience Management
- 8.2.2. Sales and Marketing
- 8.2.3. Image Recognition
- 8.2.4. Predictive Risk Assessment
- 8.2.5. Other Applications
- 8.3. Market Analysis, Insights and Forecast - by Service
- 8.3.1. Managed Service
- 8.3.2. Professional Service
- 8.4. Market Analysis, Insights and Forecast - by Organization Size
- 8.4.1. Small and Medium Enterprises
- 8.4.2. Large Enterprises
- 8.5. Market Analysis, Insights and Forecast - by End-User Industry
- 8.5.1. Retail
- 8.5.2. E-commerce
- 8.5.3. Banking, Financial Services and Insurance (BFSI)
- 8.5.4. Media and Advertising
- 8.5.5. Education
- 8.5.6. Other End-user Industries
- 8.1. Market Analysis, Insights and Forecast - by Technology
- 9. Latin America AI in Social Media Market Analysis, Insights and Forecast, 2019-2031
- 9.1. Market Analysis, Insights and Forecast - by Technology
- 9.1.1. Machine Learning and Deep Learning
- 9.1.2. Natural Language Processing (NLP)
- 9.2. Market Analysis, Insights and Forecast - by Application
- 9.2.1. Customer Experience Management
- 9.2.2. Sales and Marketing
- 9.2.3. Image Recognition
- 9.2.4. Predictive Risk Assessment
- 9.2.5. Other Applications
- 9.3. Market Analysis, Insights and Forecast - by Service
- 9.3.1. Managed Service
- 9.3.2. Professional Service
- 9.4. Market Analysis, Insights and Forecast - by Organization Size
- 9.4.1. Small and Medium Enterprises
- 9.4.2. Large Enterprises
- 9.5. Market Analysis, Insights and Forecast - by End-User Industry
- 9.5.1. Retail
- 9.5.2. E-commerce
- 9.5.3. Banking, Financial Services and Insurance (BFSI)
- 9.5.4. Media and Advertising
- 9.5.5. Education
- 9.5.6. Other End-user Industries
- 9.1. Market Analysis, Insights and Forecast - by Technology
- 10. Middle East and Africa AI in Social Media Market Analysis, Insights and Forecast, 2019-2031
- 10.1. Market Analysis, Insights and Forecast - by Technology
- 10.1.1. Machine Learning and Deep Learning
- 10.1.2. Natural Language Processing (NLP)
- 10.2. Market Analysis, Insights and Forecast - by Application
- 10.2.1. Customer Experience Management
- 10.2.2. Sales and Marketing
- 10.2.3. Image Recognition
- 10.2.4. Predictive Risk Assessment
- 10.2.5. Other Applications
- 10.3. Market Analysis, Insights and Forecast - by Service
- 10.3.1. Managed Service
- 10.3.2. Professional Service
- 10.4. Market Analysis, Insights and Forecast - by Organization Size
- 10.4.1. Small and Medium Enterprises
- 10.4.2. Large Enterprises
- 10.5. Market Analysis, Insights and Forecast - by End-User Industry
- 10.5.1. Retail
- 10.5.2. E-commerce
- 10.5.3. Banking, Financial Services and Insurance (BFSI)
- 10.5.4. Media and Advertising
- 10.5.5. Education
- 10.5.6. Other End-user Industries
- 10.1. Market Analysis, Insights and Forecast - by Technology
- 11. North America AI in Social Media Market Analysis, Insights and Forecast, 2019-2031
- 11.1. Market Analysis, Insights and Forecast - By Country/Sub-region
- 11.1.1 United States
- 11.1.2 Canada
- 11.1.3 Mexico
- 12. Europe AI in Social Media Market Analysis, Insights and Forecast, 2019-2031
- 12.1. Market Analysis, Insights and Forecast - By Country/Sub-region
- 12.1.1 Germany
- 12.1.2 United Kingdom
- 12.1.3 France
- 12.1.4 Spain
- 12.1.5 Italy
- 12.1.6 Spain
- 12.1.7 Belgium
- 12.1.8 Netherland
- 12.1.9 Nordics
- 12.1.10 Rest of Europe
- 13. Asia Pacific AI in Social Media Market Analysis, Insights and Forecast, 2019-2031
- 13.1. Market Analysis, Insights and Forecast - By Country/Sub-region
- 13.1.1 China
- 13.1.2 Japan
- 13.1.3 India
- 13.1.4 South Korea
- 13.1.5 Southeast Asia
- 13.1.6 Australia
- 13.1.7 Indonesia
- 13.1.8 Phillipes
- 13.1.9 Singapore
- 13.1.10 Thailandc
- 13.1.11 Rest of Asia Pacific
- 14. South America AI in Social Media Market Analysis, Insights and Forecast, 2019-2031
- 14.1. Market Analysis, Insights and Forecast - By Country/Sub-region
- 14.1.1 Brazil
- 14.1.2 Argentina
- 14.1.3 Peru
- 14.1.4 Chile
- 14.1.5 Colombia
- 14.1.6 Ecuador
- 14.1.7 Venezuela
- 14.1.8 Rest of South America
- 15. North America AI in Social Media Market Analysis, Insights and Forecast, 2019-2031
- 15.1. Market Analysis, Insights and Forecast - By Country/Sub-region
- 15.1.1 United States
- 15.1.2 Canada
- 15.1.3 Mexico
- 16. MEA AI in Social Media Market Analysis, Insights and Forecast, 2019-2031
- 16.1. Market Analysis, Insights and Forecast - By Country/Sub-region
- 16.1.1 United Arab Emirates
- 16.1.2 Saudi Arabia
- 16.1.3 South Africa
- 16.1.4 Rest of Middle East and Africa
- 17. Competitive Analysis
- 17.1. Global Market Share Analysis 2024
- 17.2. Company Profiles
- 17.2.1 Baidu Inc
- 17.2.1.1. Overview
- 17.2.1.2. Products
- 17.2.1.3. SWOT Analysis
- 17.2.1.4. Recent Developments
- 17.2.1.5. Financials (Based on Availability)
- 17.2.2 Meta
- 17.2.2.1. Overview
- 17.2.2.2. Products
- 17.2.2.3. SWOT Analysis
- 17.2.2.4. Recent Developments
- 17.2.2.5. Financials (Based on Availability)
- 17.2.3 Meltwater News US Inc
- 17.2.3.1. Overview
- 17.2.3.2. Products
- 17.2.3.3. SWOT Analysis
- 17.2.3.4. Recent Developments
- 17.2.3.5. Financials (Based on Availability)
- 17.2.4 IBM Corporation
- 17.2.4.1. Overview
- 17.2.4.2. Products
- 17.2.4.3. SWOT Analysis
- 17.2.4.4. Recent Developments
- 17.2.4.5. Financials (Based on Availability)
- 17.2.5 Sprout Social Inc
- 17.2.5.1. Overview
- 17.2.5.2. Products
- 17.2.5.3. SWOT Analysis
- 17.2.5.4. Recent Developments
- 17.2.5.5. Financials (Based on Availability)
- 17.2.6 Clarabridge Inc
- 17.2.6.1. Overview
- 17.2.6.2. Products
- 17.2.6.3. SWOT Analysis
- 17.2.6.4. Recent Developments
- 17.2.6.5. Financials (Based on Availability)
- 17.2.7 Google LLC
- 17.2.7.1. Overview
- 17.2.7.2. Products
- 17.2.7.3. SWOT Analysis
- 17.2.7.4. Recent Developments
- 17.2.7.5. Financials (Based on Availability)
- 17.2.8 Snap Inc
- 17.2.8.1. Overview
- 17.2.8.2. Products
- 17.2.8.3. SWOT Analysis
- 17.2.8.4. Recent Developments
- 17.2.8.5. Financials (Based on Availability)
- 17.2.9 Crimson Hexagon Inc
- 17.2.9.1. Overview
- 17.2.9.2. Products
- 17.2.9.3. SWOT Analysis
- 17.2.9.4. Recent Developments
- 17.2.9.5. Financials (Based on Availability)
- 17.2.10 Salesforce com Inc
- 17.2.10.1. Overview
- 17.2.10.2. Products
- 17.2.10.3. SWOT Analysis
- 17.2.10.4. Recent Developments
- 17.2.10.5. Financials (Based on Availability)
- 17.2.11 Microsoft Corporation
- 17.2.11.1. Overview
- 17.2.11.2. Products
- 17.2.11.3. SWOT Analysis
- 17.2.11.4. Recent Developments
- 17.2.11.5. Financials (Based on Availability)
- 17.2.12 Adobe Systems Incorporated
- 17.2.12.1. Overview
- 17.2.12.2. Products
- 17.2.12.3. SWOT Analysis
- 17.2.12.4. Recent Developments
- 17.2.12.5. Financials (Based on Availability)
- 17.2.13 Amazon Web Services Inc
- 17.2.13.1. Overview
- 17.2.13.2. Products
- 17.2.13.3. SWOT Analysis
- 17.2.13.4. Recent Developments
- 17.2.13.5. Financials (Based on Availability)
- 17.2.14 HootSuite Media Inc
- 17.2.14.1. Overview
- 17.2.14.2. Products
- 17.2.14.3. SWOT Analysis
- 17.2.14.4. Recent Developments
- 17.2.14.5. Financials (Based on Availability)
- 17.2.1 Baidu Inc
List of Figures
- Figure 1: Global AI in Social Media Market Revenue Breakdown (Million, %) by Region 2024 & 2032
- Figure 2: Global AI in Social Media Market Volume Breakdown (K Unit, %) by Region 2024 & 2032
- Figure 3: North America AI in Social Media Market Revenue (Million), by Country 2024 & 2032
- Figure 4: North America AI in Social Media Market Volume (K Unit), by Country 2024 & 2032
- Figure 5: North America AI in Social Media Market Revenue Share (%), by Country 2024 & 2032
- Figure 6: North America AI in Social Media Market Volume Share (%), by Country 2024 & 2032
- Figure 7: Europe AI in Social Media Market Revenue (Million), by Country 2024 & 2032
- Figure 8: Europe AI in Social Media Market Volume (K Unit), by Country 2024 & 2032
- Figure 9: Europe AI in Social Media Market Revenue Share (%), by Country 2024 & 2032
- Figure 10: Europe AI in Social Media Market Volume Share (%), by Country 2024 & 2032
- Figure 11: Asia Pacific AI in Social Media Market Revenue (Million), by Country 2024 & 2032
- Figure 12: Asia Pacific AI in Social Media Market Volume (K Unit), by Country 2024 & 2032
- Figure 13: Asia Pacific AI in Social Media Market Revenue Share (%), by Country 2024 & 2032
- Figure 14: Asia Pacific AI in Social Media Market Volume Share (%), by Country 2024 & 2032
- Figure 15: South America AI in Social Media Market Revenue (Million), by Country 2024 & 2032
- Figure 16: South America AI in Social Media Market Volume (K Unit), by Country 2024 & 2032
- Figure 17: South America AI in Social Media Market Revenue Share (%), by Country 2024 & 2032
- Figure 18: South America AI in Social Media Market Volume Share (%), by Country 2024 & 2032
- Figure 19: North America AI in Social Media Market Revenue (Million), by Country 2024 & 2032
- Figure 20: North America AI in Social Media Market Volume (K Unit), by Country 2024 & 2032
- Figure 21: North America AI in Social Media Market Revenue Share (%), by Country 2024 & 2032
- Figure 22: North America AI in Social Media Market Volume Share (%), by Country 2024 & 2032
- Figure 23: MEA AI in Social Media Market Revenue (Million), by Country 2024 & 2032
- Figure 24: MEA AI in Social Media Market Volume (K Unit), by Country 2024 & 2032
- Figure 25: MEA AI in Social Media Market Revenue Share (%), by Country 2024 & 2032
- Figure 26: MEA AI in Social Media Market Volume Share (%), by Country 2024 & 2032
- Figure 27: North America AI in Social Media Market Revenue (Million), by Technology 2024 & 2032
- Figure 28: North America AI in Social Media Market Volume (K Unit), by Technology 2024 & 2032
- Figure 29: North America AI in Social Media Market Revenue Share (%), by Technology 2024 & 2032
- Figure 30: North America AI in Social Media Market Volume Share (%), by Technology 2024 & 2032
- Figure 31: North America AI in Social Media Market Revenue (Million), by Application 2024 & 2032
- Figure 32: North America AI in Social Media Market Volume (K Unit), by Application 2024 & 2032
- Figure 33: North America AI in Social Media Market Revenue Share (%), by Application 2024 & 2032
- Figure 34: North America AI in Social Media Market Volume Share (%), by Application 2024 & 2032
- Figure 35: North America AI in Social Media Market Revenue (Million), by Service 2024 & 2032
- Figure 36: North America AI in Social Media Market Volume (K Unit), by Service 2024 & 2032
- Figure 37: North America AI in Social Media Market Revenue Share (%), by Service 2024 & 2032
- Figure 38: North America AI in Social Media Market Volume Share (%), by Service 2024 & 2032
- Figure 39: North America AI in Social Media Market Revenue (Million), by Organization Size 2024 & 2032
- Figure 40: North America AI in Social Media Market Volume (K Unit), by Organization Size 2024 & 2032
- Figure 41: North America AI in Social Media Market Revenue Share (%), by Organization Size 2024 & 2032
- Figure 42: North America AI in Social Media Market Volume Share (%), by Organization Size 2024 & 2032
- Figure 43: North America AI in Social Media Market Revenue (Million), by End-User Industry 2024 & 2032
- Figure 44: North America AI in Social Media Market Volume (K Unit), by End-User Industry 2024 & 2032
- Figure 45: North America AI in Social Media Market Revenue Share (%), by End-User Industry 2024 & 2032
- Figure 46: North America AI in Social Media Market Volume Share (%), by End-User Industry 2024 & 2032
- Figure 47: North America AI in Social Media Market Revenue (Million), by Country 2024 & 2032
- Figure 48: North America AI in Social Media Market Volume (K Unit), by Country 2024 & 2032
- Figure 49: North America AI in Social Media Market Revenue Share (%), by Country 2024 & 2032
- Figure 50: North America AI in Social Media Market Volume Share (%), by Country 2024 & 2032
- Figure 51: Europe AI in Social Media Market Revenue (Million), by Technology 2024 & 2032
- Figure 52: Europe AI in Social Media Market Volume (K Unit), by Technology 2024 & 2032
- Figure 53: Europe AI in Social Media Market Revenue Share (%), by Technology 2024 & 2032
- Figure 54: Europe AI in Social Media Market Volume Share (%), by Technology 2024 & 2032
- Figure 55: Europe AI in Social Media Market Revenue (Million), by Application 2024 & 2032
- Figure 56: Europe AI in Social Media Market Volume (K Unit), by Application 2024 & 2032
- Figure 57: Europe AI in Social Media Market Revenue Share (%), by Application 2024 & 2032
- Figure 58: Europe AI in Social Media Market Volume Share (%), by Application 2024 & 2032
- Figure 59: Europe AI in Social Media Market Revenue (Million), by Service 2024 & 2032
- Figure 60: Europe AI in Social Media Market Volume (K Unit), by Service 2024 & 2032
- Figure 61: Europe AI in Social Media Market Revenue Share (%), by Service 2024 & 2032
- Figure 62: Europe AI in Social Media Market Volume Share (%), by Service 2024 & 2032
- Figure 63: Europe AI in Social Media Market Revenue (Million), by Organization Size 2024 & 2032
- Figure 64: Europe AI in Social Media Market Volume (K Unit), by Organization Size 2024 & 2032
- Figure 65: Europe AI in Social Media Market Revenue Share (%), by Organization Size 2024 & 2032
- Figure 66: Europe AI in Social Media Market Volume Share (%), by Organization Size 2024 & 2032
- Figure 67: Europe AI in Social Media Market Revenue (Million), by End-User Industry 2024 & 2032
- Figure 68: Europe AI in Social Media Market Volume (K Unit), by End-User Industry 2024 & 2032
- Figure 69: Europe AI in Social Media Market Revenue Share (%), by End-User Industry 2024 & 2032
- Figure 70: Europe AI in Social Media Market Volume Share (%), by End-User Industry 2024 & 2032
- Figure 71: Europe AI in Social Media Market Revenue (Million), by Country 2024 & 2032
- Figure 72: Europe AI in Social Media Market Volume (K Unit), by Country 2024 & 2032
- Figure 73: Europe AI in Social Media Market Revenue Share (%), by Country 2024 & 2032
- Figure 74: Europe AI in Social Media Market Volume Share (%), by Country 2024 & 2032
- Figure 75: Asia Pacific AI in Social Media Market Revenue (Million), by Technology 2024 & 2032
- Figure 76: Asia Pacific AI in Social Media Market Volume (K Unit), by Technology 2024 & 2032
- Figure 77: Asia Pacific AI in Social Media Market Revenue Share (%), by Technology 2024 & 2032
- Figure 78: Asia Pacific AI in Social Media Market Volume Share (%), by Technology 2024 & 2032
- Figure 79: Asia Pacific AI in Social Media Market Revenue (Million), by Application 2024 & 2032
- Figure 80: Asia Pacific AI in Social Media Market Volume (K Unit), by Application 2024 & 2032
- Figure 81: Asia Pacific AI in Social Media Market Revenue Share (%), by Application 2024 & 2032
- Figure 82: Asia Pacific AI in Social Media Market Volume Share (%), by Application 2024 & 2032
- Figure 83: Asia Pacific AI in Social Media Market Revenue (Million), by Service 2024 & 2032
- Figure 84: Asia Pacific AI in Social Media Market Volume (K Unit), by Service 2024 & 2032
- Figure 85: Asia Pacific AI in Social Media Market Revenue Share (%), by Service 2024 & 2032
- Figure 86: Asia Pacific AI in Social Media Market Volume Share (%), by Service 2024 & 2032
- Figure 87: Asia Pacific AI in Social Media Market Revenue (Million), by Organization Size 2024 & 2032
- Figure 88: Asia Pacific AI in Social Media Market Volume (K Unit), by Organization Size 2024 & 2032
- Figure 89: Asia Pacific AI in Social Media Market Revenue Share (%), by Organization Size 2024 & 2032
- Figure 90: Asia Pacific AI in Social Media Market Volume Share (%), by Organization Size 2024 & 2032
- Figure 91: Asia Pacific AI in Social Media Market Revenue (Million), by End-User Industry 2024 & 2032
- Figure 92: Asia Pacific AI in Social Media Market Volume (K Unit), by End-User Industry 2024 & 2032
- Figure 93: Asia Pacific AI in Social Media Market Revenue Share (%), by End-User Industry 2024 & 2032
- Figure 94: Asia Pacific AI in Social Media Market Volume Share (%), by End-User Industry 2024 & 2032
- Figure 95: Asia Pacific AI in Social Media Market Revenue (Million), by Country 2024 & 2032
- Figure 96: Asia Pacific AI in Social Media Market Volume (K Unit), by Country 2024 & 2032
- Figure 97: Asia Pacific AI in Social Media Market Revenue Share (%), by Country 2024 & 2032
- Figure 98: Asia Pacific AI in Social Media Market Volume Share (%), by Country 2024 & 2032
- Figure 99: Latin America AI in Social Media Market Revenue (Million), by Technology 2024 & 2032
- Figure 100: Latin America AI in Social Media Market Volume (K Unit), by Technology 2024 & 2032
- Figure 101: Latin America AI in Social Media Market Revenue Share (%), by Technology 2024 & 2032
- Figure 102: Latin America AI in Social Media Market Volume Share (%), by Technology 2024 & 2032
- Figure 103: Latin America AI in Social Media Market Revenue (Million), by Application 2024 & 2032
- Figure 104: Latin America AI in Social Media Market Volume (K Unit), by Application 2024 & 2032
- Figure 105: Latin America AI in Social Media Market Revenue Share (%), by Application 2024 & 2032
- Figure 106: Latin America AI in Social Media Market Volume Share (%), by Application 2024 & 2032
- Figure 107: Latin America AI in Social Media Market Revenue (Million), by Service 2024 & 2032
- Figure 108: Latin America AI in Social Media Market Volume (K Unit), by Service 2024 & 2032
- Figure 109: Latin America AI in Social Media Market Revenue Share (%), by Service 2024 & 2032
- Figure 110: Latin America AI in Social Media Market Volume Share (%), by Service 2024 & 2032
- Figure 111: Latin America AI in Social Media Market Revenue (Million), by Organization Size 2024 & 2032
- Figure 112: Latin America AI in Social Media Market Volume (K Unit), by Organization Size 2024 & 2032
- Figure 113: Latin America AI in Social Media Market Revenue Share (%), by Organization Size 2024 & 2032
- Figure 114: Latin America AI in Social Media Market Volume Share (%), by Organization Size 2024 & 2032
- Figure 115: Latin America AI in Social Media Market Revenue (Million), by End-User Industry 2024 & 2032
- Figure 116: Latin America AI in Social Media Market Volume (K Unit), by End-User Industry 2024 & 2032
- Figure 117: Latin America AI in Social Media Market Revenue Share (%), by End-User Industry 2024 & 2032
- Figure 118: Latin America AI in Social Media Market Volume Share (%), by End-User Industry 2024 & 2032
- Figure 119: Latin America AI in Social Media Market Revenue (Million), by Country 2024 & 2032
- Figure 120: Latin America AI in Social Media Market Volume (K Unit), by Country 2024 & 2032
- Figure 121: Latin America AI in Social Media Market Revenue Share (%), by Country 2024 & 2032
- Figure 122: Latin America AI in Social Media Market Volume Share (%), by Country 2024 & 2032
- Figure 123: Middle East and Africa AI in Social Media Market Revenue (Million), by Technology 2024 & 2032
- Figure 124: Middle East and Africa AI in Social Media Market Volume (K Unit), by Technology 2024 & 2032
- Figure 125: Middle East and Africa AI in Social Media Market Revenue Share (%), by Technology 2024 & 2032
- Figure 126: Middle East and Africa AI in Social Media Market Volume Share (%), by Technology 2024 & 2032
- Figure 127: Middle East and Africa AI in Social Media Market Revenue (Million), by Application 2024 & 2032
- Figure 128: Middle East and Africa AI in Social Media Market Volume (K Unit), by Application 2024 & 2032
- Figure 129: Middle East and Africa AI in Social Media Market Revenue Share (%), by Application 2024 & 2032
- Figure 130: Middle East and Africa AI in Social Media Market Volume Share (%), by Application 2024 & 2032
- Figure 131: Middle East and Africa AI in Social Media Market Revenue (Million), by Service 2024 & 2032
- Figure 132: Middle East and Africa AI in Social Media Market Volume (K Unit), by Service 2024 & 2032
- Figure 133: Middle East and Africa AI in Social Media Market Revenue Share (%), by Service 2024 & 2032
- Figure 134: Middle East and Africa AI in Social Media Market Volume Share (%), by Service 2024 & 2032
- Figure 135: Middle East and Africa AI in Social Media Market Revenue (Million), by Organization Size 2024 & 2032
- Figure 136: Middle East and Africa AI in Social Media Market Volume (K Unit), by Organization Size 2024 & 2032
- Figure 137: Middle East and Africa AI in Social Media Market Revenue Share (%), by Organization Size 2024 & 2032
- Figure 138: Middle East and Africa AI in Social Media Market Volume Share (%), by Organization Size 2024 & 2032
- Figure 139: Middle East and Africa AI in Social Media Market Revenue (Million), by End-User Industry 2024 & 2032
- Figure 140: Middle East and Africa AI in Social Media Market Volume (K Unit), by End-User Industry 2024 & 2032
- Figure 141: Middle East and Africa AI in Social Media Market Revenue Share (%), by End-User Industry 2024 & 2032
- Figure 142: Middle East and Africa AI in Social Media Market Volume Share (%), by End-User Industry 2024 & 2032
- Figure 143: Middle East and Africa AI in Social Media Market Revenue (Million), by Country 2024 & 2032
- Figure 144: Middle East and Africa AI in Social Media Market Volume (K Unit), by Country 2024 & 2032
- Figure 145: Middle East and Africa AI in Social Media Market Revenue Share (%), by Country 2024 & 2032
- Figure 146: Middle East and Africa AI in Social Media Market Volume Share (%), by Country 2024 & 2032
List of Tables
- Table 1: Global AI in Social Media Market Revenue Million Forecast, by Region 2019 & 2032
- Table 2: Global AI in Social Media Market Volume K Unit Forecast, by Region 2019 & 2032
- Table 3: Global AI in Social Media Market Revenue Million Forecast, by Technology 2019 & 2032
- Table 4: Global AI in Social Media Market Volume K Unit Forecast, by Technology 2019 & 2032
- Table 5: Global AI in Social Media Market Revenue Million Forecast, by Application 2019 & 2032
- Table 6: Global AI in Social Media Market Volume K Unit Forecast, by Application 2019 & 2032
- Table 7: Global AI in Social Media Market Revenue Million Forecast, by Service 2019 & 2032
- Table 8: Global AI in Social Media Market Volume K Unit Forecast, by Service 2019 & 2032
- Table 9: Global AI in Social Media Market Revenue Million Forecast, by Organization Size 2019 & 2032
- Table 10: Global AI in Social Media Market Volume K Unit Forecast, by Organization Size 2019 & 2032
- Table 11: Global AI in Social Media Market Revenue Million Forecast, by End-User Industry 2019 & 2032
- Table 12: Global AI in Social Media Market Volume K Unit Forecast, by End-User Industry 2019 & 2032
- Table 13: Global AI in Social Media Market Revenue Million Forecast, by Region 2019 & 2032
- Table 14: Global AI in Social Media Market Volume K Unit Forecast, by Region 2019 & 2032
- Table 15: Global AI in Social Media Market Revenue Million Forecast, by Country 2019 & 2032
- Table 16: Global AI in Social Media Market Volume K Unit Forecast, by Country 2019 & 2032
- Table 17: United States AI in Social Media Market Revenue (Million) Forecast, by Application 2019 & 2032
- Table 18: United States AI in Social Media Market Volume (K Unit) Forecast, by Application 2019 & 2032
- Table 19: Canada AI in Social Media Market Revenue (Million) Forecast, by Application 2019 & 2032
- Table 20: Canada AI in Social Media Market Volume (K Unit) Forecast, by Application 2019 & 2032
- Table 21: Mexico AI in Social Media Market Revenue (Million) Forecast, by Application 2019 & 2032
- Table 22: Mexico AI in Social Media Market Volume (K Unit) Forecast, by Application 2019 & 2032
- Table 23: Global AI in Social Media Market Revenue Million Forecast, by Country 2019 & 2032
- Table 24: Global AI in Social Media Market Volume K Unit Forecast, by Country 2019 & 2032
- Table 25: Germany AI in Social Media Market Revenue (Million) Forecast, by Application 2019 & 2032
- Table 26: Germany AI in Social Media Market Volume (K Unit) Forecast, by Application 2019 & 2032
- Table 27: United Kingdom AI in Social Media Market Revenue (Million) Forecast, by Application 2019 & 2032
- Table 28: United Kingdom AI in Social Media Market Volume (K Unit) Forecast, by Application 2019 & 2032
- Table 29: France AI in Social Media Market Revenue (Million) Forecast, by Application 2019 & 2032
- Table 30: France AI in Social Media Market Volume (K Unit) Forecast, by Application 2019 & 2032
- Table 31: Spain AI in Social Media Market Revenue (Million) Forecast, by Application 2019 & 2032
- Table 32: Spain AI in Social Media Market Volume (K Unit) Forecast, by Application 2019 & 2032
- Table 33: Italy AI in Social Media Market Revenue (Million) Forecast, by Application 2019 & 2032
- Table 34: Italy AI in Social Media Market Volume (K Unit) Forecast, by Application 2019 & 2032
- Table 35: Spain AI in Social Media Market Revenue (Million) Forecast, by Application 2019 & 2032
- Table 36: Spain AI in Social Media Market Volume (K Unit) Forecast, by Application 2019 & 2032
- Table 37: Belgium AI in Social Media Market Revenue (Million) Forecast, by Application 2019 & 2032
- Table 38: Belgium AI in Social Media Market Volume (K Unit) Forecast, by Application 2019 & 2032
- Table 39: Netherland AI in Social Media Market Revenue (Million) Forecast, by Application 2019 & 2032
- Table 40: Netherland AI in Social Media Market Volume (K Unit) Forecast, by Application 2019 & 2032
- Table 41: Nordics AI in Social Media Market Revenue (Million) Forecast, by Application 2019 & 2032
- Table 42: Nordics AI in Social Media Market Volume (K Unit) Forecast, by Application 2019 & 2032
- Table 43: Rest of Europe AI in Social Media Market Revenue (Million) Forecast, by Application 2019 & 2032
- Table 44: Rest of Europe AI in Social Media Market Volume (K Unit) Forecast, by Application 2019 & 2032
- Table 45: Global AI in Social Media Market Revenue Million Forecast, by Country 2019 & 2032
- Table 46: Global AI in Social Media Market Volume K Unit Forecast, by Country 2019 & 2032
- Table 47: China AI in Social Media Market Revenue (Million) Forecast, by Application 2019 & 2032
- Table 48: China AI in Social Media Market Volume (K Unit) Forecast, by Application 2019 & 2032
- Table 49: Japan AI in Social Media Market Revenue (Million) Forecast, by Application 2019 & 2032
- Table 50: Japan AI in Social Media Market Volume (K Unit) Forecast, by Application 2019 & 2032
- Table 51: India AI in Social Media Market Revenue (Million) Forecast, by Application 2019 & 2032
- Table 52: India AI in Social Media Market Volume (K Unit) Forecast, by Application 2019 & 2032
- Table 53: South Korea AI in Social Media Market Revenue (Million) Forecast, by Application 2019 & 2032
- Table 54: South Korea AI in Social Media Market Volume (K Unit) Forecast, by Application 2019 & 2032
- Table 55: Southeast Asia AI in Social Media Market Revenue (Million) Forecast, by Application 2019 & 2032
- Table 56: Southeast Asia AI in Social Media Market Volume (K Unit) Forecast, by Application 2019 & 2032
- Table 57: Australia AI in Social Media Market Revenue (Million) Forecast, by Application 2019 & 2032
- Table 58: Australia AI in Social Media Market Volume (K Unit) Forecast, by Application 2019 & 2032
- Table 59: Indonesia AI in Social Media Market Revenue (Million) Forecast, by Application 2019 & 2032
- Table 60: Indonesia AI in Social Media Market Volume (K Unit) Forecast, by Application 2019 & 2032
- Table 61: Phillipes AI in Social Media Market Revenue (Million) Forecast, by Application 2019 & 2032
- Table 62: Phillipes AI in Social Media Market Volume (K Unit) Forecast, by Application 2019 & 2032
- Table 63: Singapore AI in Social Media Market Revenue (Million) Forecast, by Application 2019 & 2032
- Table 64: Singapore AI in Social Media Market Volume (K Unit) Forecast, by Application 2019 & 2032
- Table 65: Thailandc AI in Social Media Market Revenue (Million) Forecast, by Application 2019 & 2032
- Table 66: Thailandc AI in Social Media Market Volume (K Unit) Forecast, by Application 2019 & 2032
- Table 67: Rest of Asia Pacific AI in Social Media Market Revenue (Million) Forecast, by Application 2019 & 2032
- Table 68: Rest of Asia Pacific AI in Social Media Market Volume (K Unit) Forecast, by Application 2019 & 2032
- Table 69: Global AI in Social Media Market Revenue Million Forecast, by Country 2019 & 2032
- Table 70: Global AI in Social Media Market Volume K Unit Forecast, by Country 2019 & 2032
- Table 71: Brazil AI in Social Media Market Revenue (Million) Forecast, by Application 2019 & 2032
- Table 72: Brazil AI in Social Media Market Volume (K Unit) Forecast, by Application 2019 & 2032
- Table 73: Argentina AI in Social Media Market Revenue (Million) Forecast, by Application 2019 & 2032
- Table 74: Argentina AI in Social Media Market Volume (K Unit) Forecast, by Application 2019 & 2032
- Table 75: Peru AI in Social Media Market Revenue (Million) Forecast, by Application 2019 & 2032
- Table 76: Peru AI in Social Media Market Volume (K Unit) Forecast, by Application 2019 & 2032
- Table 77: Chile AI in Social Media Market Revenue (Million) Forecast, by Application 2019 & 2032
- Table 78: Chile AI in Social Media Market Volume (K Unit) Forecast, by Application 2019 & 2032
- Table 79: Colombia AI in Social Media Market Revenue (Million) Forecast, by Application 2019 & 2032
- Table 80: Colombia AI in Social Media Market Volume (K Unit) Forecast, by Application 2019 & 2032
- Table 81: Ecuador AI in Social Media Market Revenue (Million) Forecast, by Application 2019 & 2032
- Table 82: Ecuador AI in Social Media Market Volume (K Unit) Forecast, by Application 2019 & 2032
- Table 83: Venezuela AI in Social Media Market Revenue (Million) Forecast, by Application 2019 & 2032
- Table 84: Venezuela AI in Social Media Market Volume (K Unit) Forecast, by Application 2019 & 2032
- Table 85: Rest of South America AI in Social Media Market Revenue (Million) Forecast, by Application 2019 & 2032
- Table 86: Rest of South America AI in Social Media Market Volume (K Unit) Forecast, by Application 2019 & 2032
- Table 87: Global AI in Social Media Market Revenue Million Forecast, by Country 2019 & 2032
- Table 88: Global AI in Social Media Market Volume K Unit Forecast, by Country 2019 & 2032
- Table 89: United States AI in Social Media Market Revenue (Million) Forecast, by Application 2019 & 2032
- Table 90: United States AI in Social Media Market Volume (K Unit) Forecast, by Application 2019 & 2032
- Table 91: Canada AI in Social Media Market Revenue (Million) Forecast, by Application 2019 & 2032
- Table 92: Canada AI in Social Media Market Volume (K Unit) Forecast, by Application 2019 & 2032
- Table 93: Mexico AI in Social Media Market Revenue (Million) Forecast, by Application 2019 & 2032
- Table 94: Mexico AI in Social Media Market Volume (K Unit) Forecast, by Application 2019 & 2032
- Table 95: Global AI in Social Media Market Revenue Million Forecast, by Country 2019 & 2032
- Table 96: Global AI in Social Media Market Volume K Unit Forecast, by Country 2019 & 2032
- Table 97: United Arab Emirates AI in Social Media Market Revenue (Million) Forecast, by Application 2019 & 2032
- Table 98: United Arab Emirates AI in Social Media Market Volume (K Unit) Forecast, by Application 2019 & 2032
- Table 99: Saudi Arabia AI in Social Media Market Revenue (Million) Forecast, by Application 2019 & 2032
- Table 100: Saudi Arabia AI in Social Media Market Volume (K Unit) Forecast, by Application 2019 & 2032
- Table 101: South Africa AI in Social Media Market Revenue (Million) Forecast, by Application 2019 & 2032
- Table 102: South Africa AI in Social Media Market Volume (K Unit) Forecast, by Application 2019 & 2032
- Table 103: Rest of Middle East and Africa AI in Social Media Market Revenue (Million) Forecast, by Application 2019 & 2032
- Table 104: Rest of Middle East and Africa AI in Social Media Market Volume (K Unit) Forecast, by Application 2019 & 2032
- Table 105: Global AI in Social Media Market Revenue Million Forecast, by Technology 2019 & 2032
- Table 106: Global AI in Social Media Market Volume K Unit Forecast, by Technology 2019 & 2032
- Table 107: Global AI in Social Media Market Revenue Million Forecast, by Application 2019 & 2032
- Table 108: Global AI in Social Media Market Volume K Unit Forecast, by Application 2019 & 2032
- Table 109: Global AI in Social Media Market Revenue Million Forecast, by Service 2019 & 2032
- Table 110: Global AI in Social Media Market Volume K Unit Forecast, by Service 2019 & 2032
- Table 111: Global AI in Social Media Market Revenue Million Forecast, by Organization Size 2019 & 2032
- Table 112: Global AI in Social Media Market Volume K Unit Forecast, by Organization Size 2019 & 2032
- Table 113: Global AI in Social Media Market Revenue Million Forecast, by End-User Industry 2019 & 2032
- Table 114: Global AI in Social Media Market Volume K Unit Forecast, by End-User Industry 2019 & 2032
- Table 115: Global AI in Social Media Market Revenue Million Forecast, by Country 2019 & 2032
- Table 116: Global AI in Social Media Market Volume K Unit Forecast, by Country 2019 & 2032
- Table 117: US AI in Social Media Market Revenue (Million) Forecast, by Application 2019 & 2032
- Table 118: US AI in Social Media Market Volume (K Unit) Forecast, by Application 2019 & 2032
- Table 119: Canada AI in Social Media Market Revenue (Million) Forecast, by Application 2019 & 2032
- Table 120: Canada AI in Social Media Market Volume (K Unit) Forecast, by Application 2019 & 2032
- Table 121: Global AI in Social Media Market Revenue Million Forecast, by Technology 2019 & 2032
- Table 122: Global AI in Social Media Market Volume K Unit Forecast, by Technology 2019 & 2032
- Table 123: Global AI in Social Media Market Revenue Million Forecast, by Application 2019 & 2032
- Table 124: Global AI in Social Media Market Volume K Unit Forecast, by Application 2019 & 2032
- Table 125: Global AI in Social Media Market Revenue Million Forecast, by Service 2019 & 2032
- Table 126: Global AI in Social Media Market Volume K Unit Forecast, by Service 2019 & 2032
- Table 127: Global AI in Social Media Market Revenue Million Forecast, by Organization Size 2019 & 2032
- Table 128: Global AI in Social Media Market Volume K Unit Forecast, by Organization Size 2019 & 2032
- Table 129: Global AI in Social Media Market Revenue Million Forecast, by End-User Industry 2019 & 2032
- Table 130: Global AI in Social Media Market Volume K Unit Forecast, by End-User Industry 2019 & 2032
- Table 131: Global AI in Social Media Market Revenue Million Forecast, by Country 2019 & 2032
- Table 132: Global AI in Social Media Market Volume K Unit Forecast, by Country 2019 & 2032
- Table 133: UK AI in Social Media Market Revenue (Million) Forecast, by Application 2019 & 2032
- Table 134: UK AI in Social Media Market Volume (K Unit) Forecast, by Application 2019 & 2032
- Table 135: Germany AI in Social Media Market Revenue (Million) Forecast, by Application 2019 & 2032
- Table 136: Germany AI in Social Media Market Volume (K Unit) Forecast, by Application 2019 & 2032
- Table 137: France AI in Social Media Market Revenue (Million) Forecast, by Application 2019 & 2032
- Table 138: France AI in Social Media Market Volume (K Unit) Forecast, by Application 2019 & 2032
- Table 139: Spain AI in Social Media Market Revenue (Million) Forecast, by Application 2019 & 2032
- Table 140: Spain AI in Social Media Market Volume (K Unit) Forecast, by Application 2019 & 2032
- Table 141: Rest of Europe AI in Social Media Market Revenue (Million) Forecast, by Application 2019 & 2032
- Table 142: Rest of Europe AI in Social Media Market Volume (K Unit) Forecast, by Application 2019 & 2032
- Table 143: Global AI in Social Media Market Revenue Million Forecast, by Technology 2019 & 2032
- Table 144: Global AI in Social Media Market Volume K Unit Forecast, by Technology 2019 & 2032
- Table 145: Global AI in Social Media Market Revenue Million Forecast, by Application 2019 & 2032
- Table 146: Global AI in Social Media Market Volume K Unit Forecast, by Application 2019 & 2032
- Table 147: Global AI in Social Media Market Revenue Million Forecast, by Service 2019 & 2032
- Table 148: Global AI in Social Media Market Volume K Unit Forecast, by Service 2019 & 2032
- Table 149: Global AI in Social Media Market Revenue Million Forecast, by Organization Size 2019 & 2032
- Table 150: Global AI in Social Media Market Volume K Unit Forecast, by Organization Size 2019 & 2032
- Table 151: Global AI in Social Media Market Revenue Million Forecast, by End-User Industry 2019 & 2032
- Table 152: Global AI in Social Media Market Volume K Unit Forecast, by End-User Industry 2019 & 2032
- Table 153: Global AI in Social Media Market Revenue Million Forecast, by Country 2019 & 2032
- Table 154: Global AI in Social Media Market Volume K Unit Forecast, by Country 2019 & 2032
- Table 155: China AI in Social Media Market Revenue (Million) Forecast, by Application 2019 & 2032
- Table 156: China AI in Social Media Market Volume (K Unit) Forecast, by Application 2019 & 2032
- Table 157: Japan AI in Social Media Market Revenue (Million) Forecast, by Application 2019 & 2032
- Table 158: Japan AI in Social Media Market Volume (K Unit) Forecast, by Application 2019 & 2032
- Table 159: India AI in Social Media Market Revenue (Million) Forecast, by Application 2019 & 2032
- Table 160: India AI in Social Media Market Volume (K Unit) Forecast, by Application 2019 & 2032
- Table 161: South Korea AI in Social Media Market Revenue (Million) Forecast, by Application 2019 & 2032
- Table 162: South Korea AI in Social Media Market Volume (K Unit) Forecast, by Application 2019 & 2032
- Table 163: Rest of Asia Pacific AI in Social Media Market Revenue (Million) Forecast, by Application 2019 & 2032
- Table 164: Rest of Asia Pacific AI in Social Media Market Volume (K Unit) Forecast, by Application 2019 & 2032
- Table 165: Global AI in Social Media Market Revenue Million Forecast, by Technology 2019 & 2032
- Table 166: Global AI in Social Media Market Volume K Unit Forecast, by Technology 2019 & 2032
- Table 167: Global AI in Social Media Market Revenue Million Forecast, by Application 2019 & 2032
- Table 168: Global AI in Social Media Market Volume K Unit Forecast, by Application 2019 & 2032
- Table 169: Global AI in Social Media Market Revenue Million Forecast, by Service 2019 & 2032
- Table 170: Global AI in Social Media Market Volume K Unit Forecast, by Service 2019 & 2032
- Table 171: Global AI in Social Media Market Revenue Million Forecast, by Organization Size 2019 & 2032
- Table 172: Global AI in Social Media Market Volume K Unit Forecast, by Organization Size 2019 & 2032
- Table 173: Global AI in Social Media Market Revenue Million Forecast, by End-User Industry 2019 & 2032
- Table 174: Global AI in Social Media Market Volume K Unit Forecast, by End-User Industry 2019 & 2032
- Table 175: Global AI in Social Media Market Revenue Million Forecast, by Country 2019 & 2032
- Table 176: Global AI in Social Media Market Volume K Unit Forecast, by Country 2019 & 2032
- Table 177: Global AI in Social Media Market Revenue Million Forecast, by Technology 2019 & 2032
- Table 178: Global AI in Social Media Market Volume K Unit Forecast, by Technology 2019 & 2032
- Table 179: Global AI in Social Media Market Revenue Million Forecast, by Application 2019 & 2032
- Table 180: Global AI in Social Media Market Volume K Unit Forecast, by Application 2019 & 2032
- Table 181: Global AI in Social Media Market Revenue Million Forecast, by Service 2019 & 2032
- Table 182: Global AI in Social Media Market Volume K Unit Forecast, by Service 2019 & 2032
- Table 183: Global AI in Social Media Market Revenue Million Forecast, by Organization Size 2019 & 2032
- Table 184: Global AI in Social Media Market Volume K Unit Forecast, by Organization Size 2019 & 2032
- Table 185: Global AI in Social Media Market Revenue Million Forecast, by End-User Industry 2019 & 2032
- Table 186: Global AI in Social Media Market Volume K Unit Forecast, by End-User Industry 2019 & 2032
- Table 187: Global AI in Social Media Market Revenue Million Forecast, by Country 2019 & 2032
- Table 188: Global AI in Social Media Market Volume K Unit Forecast, by Country 2019 & 2032
Frequently Asked Questions
1. What is the projected Compound Annual Growth Rate (CAGR) of the AI in Social Media Market?
The projected CAGR is approximately 28.04%.
2. Which companies are prominent players in the AI in Social Media Market?
Key companies in the market include Baidu Inc, Meta, Meltwater News US Inc, IBM Corporation, Sprout Social Inc , Clarabridge Inc, Google LLC, Snap Inc, Crimson Hexagon Inc, Salesforce com Inc, Microsoft Corporation, Adobe Systems Incorporated, Amazon Web Services Inc, HootSuite Media Inc.
3. What are the main segments of the AI in Social Media Market?
The market segments include Technology, Application, Service, Organization Size, End-User Industry.
4. Can you provide details about the market size?
The market size is estimated to be USD 2.10 Million as of 2022.
5. What are some drivers contributing to market growth?
Integration of Artificial Intelligence Technology with Social Media for Effective Advertising; Increase in User Engagement on Social Media by Using Smartphones; Rise in Use of AI in Understanding Market Trends and Gaining Competitive Edge.
6. What are the notable trends driving market growth?
Retail Industry to Witness a Significant Growth.
7. Are there any restraints impacting market growth?
Limited Number of Artificial Intelligence Technology Experts; Low Adoption of AI in Developing Economies.
8. Can you provide examples of recent developments in the market?
October 2022: Meta announced a collaboration with Microsoft to provide consumers with unique experiences in various sectors, including gaming and the future of work. Microsoft will introduce Microsoft 365 apps to Meta Quest devices as part of this collaboration, allowing individuals to interact with content from productivity programs such as Excel, Word, Outlook, PowerPoint, and SharePoint within virtual reality (VR). It also wants to bring Windows 365 to devices so that users can stream their whole Windows experience, including their own apps, content, and preferences, through a Windows Cloud PC.
9. What pricing options are available for accessing the report?
Pricing options include single-user, multi-user, and enterprise licenses priced at USD 4750, USD 5250, and USD 8750 respectively.
10. Is the market size provided in terms of value or volume?
The market size is provided in terms of value, measured in Million and volume, measured in K Unit.
11. Are there any specific market keywords associated with the report?
Yes, the market keyword associated with the report is "AI in Social Media Market," which aids in identifying and referencing the specific market segment covered.
12. How do I determine which pricing option suits my needs best?
The pricing options vary based on user requirements and access needs. Individual users may opt for single-user licenses, while businesses requiring broader access may choose multi-user or enterprise licenses for cost-effective access to the report.
13. Are there any additional resources or data provided in the AI in Social Media Market report?
While the report offers comprehensive insights, it's advisable to review the specific contents or supplementary materials provided to ascertain if additional resources or data are available.
14. How can I stay updated on further developments or reports in the AI in Social Media Market?
To stay informed about further developments, trends, and reports in the AI in Social Media Market, consider subscribing to industry newsletters, following relevant companies and organizations, or regularly checking reputable industry news sources and publications.
Methodology
Step 1 - Identification of Relevant Samples Size from Population Database


Step 2 - Approaches for Defining Global Market Size (Value, Volume* & Price*)

Note*: In applicable scenarios
Step 3 - Data Sources
Primary Research
- Web Analytics
- Survey Reports
- Research Institute
- Latest Research Reports
- Opinion Leaders
Secondary Research
- Annual Reports
- White Paper
- Latest Press Release
- Industry Association
- Paid Database
- Investor Presentations

Step 4 - Data Triangulation
Involves using different sources of information in order to increase the validity of a study
These sources are likely to be stakeholders in a program - participants, other researchers, program staff, other community members, and so on.
Then we put all data in single framework & apply various statistical tools to find out the dynamic on the market.
During the analysis stage, feedback from the stakeholder groups would be compared to determine areas of agreement as well as areas of divergence


