
Key Insights
The Airborne Electronic Warfare (AEW) market is experiencing robust growth, driven by escalating geopolitical tensions, advancements in technology, and the increasing demand for enhanced situational awareness and protection across military and commercial aviation. The market's Compound Annual Growth Rate (CAGR) exceeding 3.50% indicates a sustained upward trajectory projected through 2033. Key drivers include the integration of advanced sensors, artificial intelligence, and machine learning into AEW systems, resulting in improved detection capabilities, target identification, and countermeasure effectiveness. Furthermore, the rising adoption of unmanned aircraft systems (UAS) in military operations presents significant opportunities for the development of smaller, more agile, and cost-effective AEW solutions. Segmentation by aircraft type (manned vs. unmanned) and capability (electronic attack, protection, and support) reveals a diverse landscape. Manned aircraft remain dominant, but the unmanned segment is experiencing rapid expansion, driven by cost efficiencies and operational flexibility. Within capabilities, electronic protection systems are currently witnessing high demand, reflecting growing concerns about cyber threats and the need for robust defensive measures. Geographic analysis reveals that North America and Europe currently hold substantial market shares, owing to the presence of established defense industries and substantial military budgets. However, the Asia-Pacific region is expected to exhibit the fastest growth in the forecast period, fueled by increasing defense spending and modernization efforts in countries like China and India. Competition is intense, with major players like L3Harris Technologies, Raytheon Technologies, Thales, and Lockheed Martin vying for market share through continuous innovation and strategic partnerships. The market's future success hinges on continued technological advancements, effective regulatory frameworks, and sustained investment in research and development to address emerging threats and operational demands.
The restraints to market growth include the high cost of development and deployment of sophisticated AEW systems, the complexity of integrating these systems into existing platforms, and the potential for technological obsolescence. Despite these challenges, the long-term outlook for the AEW market remains positive. The increasing sophistication of electronic warfare tactics, coupled with the proliferation of advanced weapons systems, necessitate continuous investment in countermeasures, ensuring sustained growth for the industry. The market's future success will depend on the successful development and integration of cost-effective, adaptable, and readily deployable systems that address the evolving threat landscape. The emergence of hybrid warfare and the increasing use of electronic warfare in asymmetric conflicts are also driving demand for AEW systems that are capable of operating in a variety of environments and against a range of adversaries. This necessitates continued innovation and collaboration across the industry to develop advanced solutions that meet the evolving needs of military and commercial users.
This comprehensive report provides an in-depth analysis of the Airborne Electronic Warfare industry, covering market size, growth projections, key players, and emerging trends from 2019 to 2033. The study period spans from 2019-2024 (historical period), with 2025 as the base and estimated year, and a forecast period of 2025-2033. The report is essential for industry stakeholders, investors, and strategic decision-makers seeking to navigate this dynamic market. Market values are expressed in Millions of USD.
Airborne Electronic Warfare Industry Market Concentration & Innovation
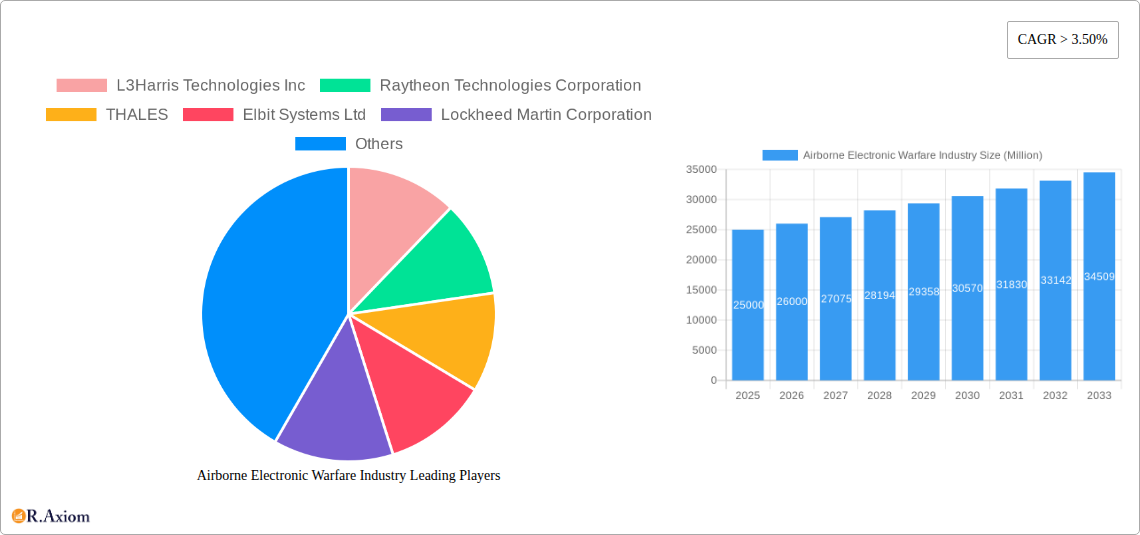
The Airborne Electronic Warfare (AEW) industry exhibits a moderately concentrated market structure, dominated by a handful of established players like L3Harris Technologies Inc, Raytheon Technologies Corporation, Thales, Elbit Systems Ltd, Lockheed Martin Corporation, and others. These companies hold significant market share, driven by substantial R&D investments, strong technological capabilities, and established customer relationships. Market share data indicates that the top 5 players collectively account for approximately xx% of the global market in 2025.
Innovation is a key driver, fueled by the constant need for advanced electronic warfare capabilities to counter evolving threats. The industry witnesses continuous advancements in areas such as AI-powered signal processing, software-defined radio technology, and miniaturization of components. Regulatory frameworks, particularly those related to export controls and military procurement, significantly impact market dynamics. Product substitutes, such as advanced jamming technologies and cyber warfare techniques, are constantly emerging, shaping competition. End-user trends, primarily focused on enhancing situational awareness, survivability, and operational effectiveness, are driving demand for advanced AEW systems. M&A activity has been significant, with notable deals exceeding USD xx Million in the past five years, aiming to consolidate market share, access new technologies, and expand product portfolios.
Airborne Electronic Warfare Industry Industry Trends & Insights
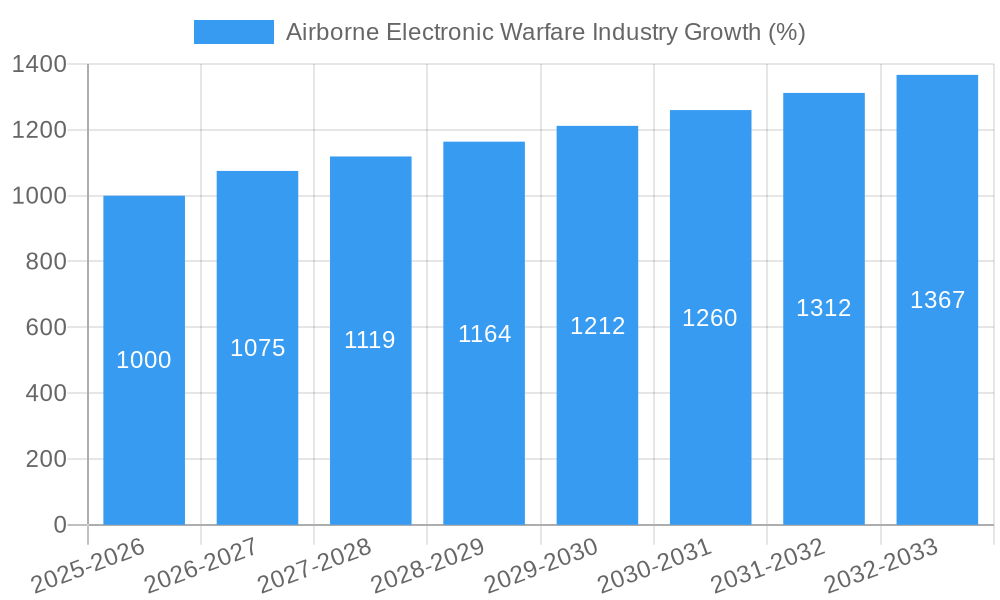
The Airborne Electronic Warfare market is experiencing robust growth, projected at a CAGR of xx% during the forecast period (2025-2033). This growth is driven primarily by increasing defense budgets globally, heightened geopolitical tensions, and the growing adoption of unmanned aerial vehicles (UAVs) in military operations. Technological disruptions, such as the integration of AI and machine learning, are revolutionizing AEW systems, enhancing their effectiveness and automation. Consumer preferences—in this context, military end-users—favor systems with improved situational awareness, enhanced survivability, and increased operational efficiency. The competitive landscape is characterized by intense rivalry among established players and emerging entrants, leading to strategic partnerships, joint ventures, and technological advancements. Market penetration for advanced AEW systems, particularly those incorporating AI and advanced signal processing capabilities, is steadily increasing, reaching an estimated xx% in 2025.
Dominant Markets & Segments in Airborne Electronic Warfare Industry
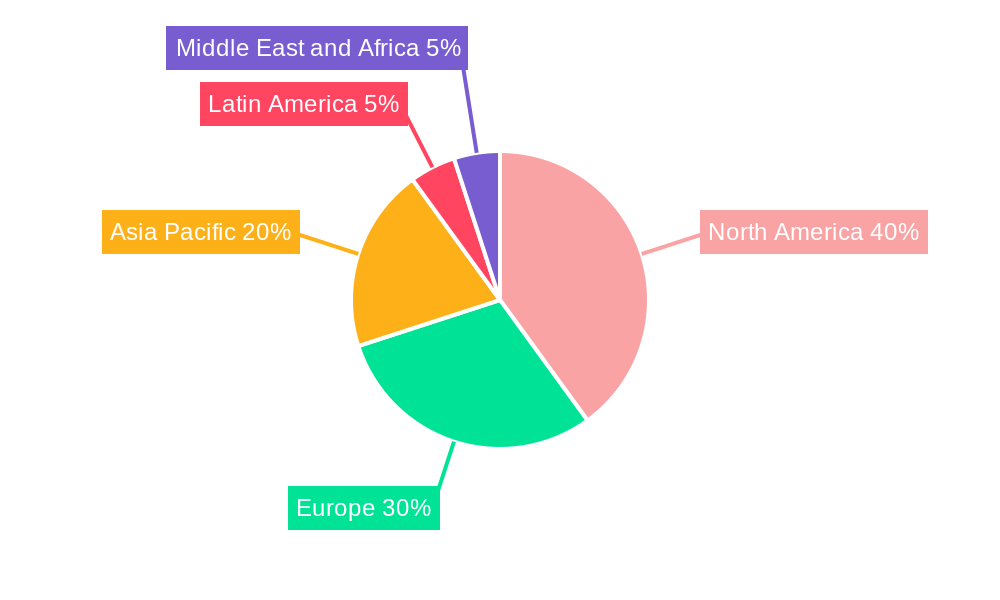
The North American region dominates the Airborne Electronic Warfare market, driven by substantial defense spending, a robust technological ecosystem, and a large number of AEW system manufacturers. This dominance is further reinforced by the strong presence of major players like L3Harris, Raytheon, and Lockheed Martin.
- Key Drivers in North America:
- High defense expenditure
- Strong technological infrastructure
- Established aerospace and defense industry
- Extensive research and development activities
- Geopolitical factors
Segment Analysis:
Type: The Manned Aircraft segment currently holds the larger market share due to its established presence and advanced capabilities. However, the Unmanned Aircraft segment is experiencing rapid growth, driven by increasing adoption of UAVs for various military operations.
Capability: The Electronic Support segment is the largest, reflecting the critical need for timely threat detection and situational awareness. The Electronic Attack and Electronic Protection segments are also significant and growing due to the need for offensive and defensive capabilities.
Airborne Electronic Warfare Industry Product Developments
Recent product innovations showcase a trend toward modular, software-defined systems that offer increased flexibility, upgradeability, and customization. This modularity allows for rapid adaptation to evolving threats and operational requirements. Advanced signal processing algorithms, AI-powered threat detection, and improved countermeasures are key features enhancing the competitive advantage of newer systems. The market is witnessing a shift towards integrated AEW suites, offering a comprehensive solution for both offensive and defensive needs. These developments improve market fit by increasing the efficiency and effectiveness of combat platforms.
Report Scope & Segmentation Analysis
The report segments the Airborne Electronic Warfare market by Type (Manned Aircraft, Unmanned Aircraft) and Capability (Electronic Attack, Electronic Protection, Electronic Support).
- Manned Aircraft: This segment is expected to experience a xx% CAGR during the forecast period, driven by continuous upgrades and modernization of existing platforms. The competitive landscape is dominated by established players with advanced technological capabilities.
- Unmanned Aircraft: This segment is projected to witness a xx% CAGR, fueled by the growing adoption of UAVs and the development of dedicated AEW payloads. Competition is increasing with both established players and new entrants developing specialized solutions.
- Electronic Attack: This segment is expected to show xx% CAGR growth due to the growing need for robust offensive capabilities.
- Electronic Protection: This segment is anticipated to have xx% CAGR due to the critical need for protecting military assets from electronic threats.
- Electronic Support: This segment is also forecast to grow at xx% CAGR due to the ever-increasing importance of situational awareness.
Key Drivers of Airborne Electronic Warfare Industry Growth
Technological advancements, particularly in AI, machine learning, and software-defined radio, are driving market growth. Increased defense budgets globally are a significant factor. Stringent regulatory frameworks promoting modernization and technological upgrades also contribute. Furthermore, geopolitical instability and the rise of asymmetric warfare are major impetus behind the demand for advanced AEW systems.
Challenges in the Airborne Electronic Warfare Industry Sector
Regulatory hurdles related to export controls and technology transfer pose significant challenges. Supply chain disruptions and the increasing complexity of systems can cause delays and cost overruns. Intense competition among established players and the emergence of new entrants create pricing pressure and limit profitability. These factors, coupled with the long lead times for procurement, affect market growth.
Emerging Opportunities in Airborne Electronic Warfare Industry
Emerging opportunities exist in the integration of AEW systems with other military platforms, like unmanned systems and cyber warfare capabilities. The development of AI-powered decision support systems is also a key area of growth. The expansion into new markets, including developing countries, presents opportunities for growth and market diversification for providers.
Leading Players in the Airborne Electronic Warfare Industry Market
- L3Harris Technologies Inc
- Raytheon Technologies Corporation
- Thales
- Elbit Systems Ltd
- Lockheed Martin Corporation
- Terma Group
- ASELSAN AS
- Israel Aerospace Industries Ltd
- Leonardo S.p.A
- BAE Systems plc
- Northrop Grumman Corporation
- Saab AB
Key Developments in Airborne Electronic Warfare Industry Industry
- March 2022: BAE Systems plc launched its versatile Storm electronic warfare modules, enhancing its product portfolio and strengthening its position in the market.
- November 2021: Lockheed Martin Corporation secured a USD 585 Million contract for F-35 AEW system integration, demonstrating substantial investment in this segment and shaping the future of AEW capabilities within the F-35 ecosystem.
Strategic Outlook for Airborne Electronic Warfare Industry Market
The Airborne Electronic Warfare market is poised for continued growth, driven by technological advancements, rising defense spending, and the escalating need for advanced electronic warfare capabilities in both manned and unmanned aerial platforms. The increasing sophistication of threats will continue to fuel demand for innovative and adaptable AEW solutions. The market will be shaped by investments in AI/ML, modular designs, and the development of integrated AEW systems. The expansion into new geographic markets and the growth of the unmanned sector will be key growth drivers.
Airborne Electronic Warfare Industry Segmentation
-
1. Capability
- 1.1. Electronic Attack
- 1.2. Electronic Protection
- 1.3. Electronic Support
-
2. Type
- 2.1. Manned Aircraft
- 2.2. Unmanned Aircraft
Airborne Electronic Warfare Industry Segmentation By Geography
-
1. North America
- 1.1. United States
- 1.2. Canada
-
2. Europe
- 2.1. United Kingdom
- 2.2. Germany
- 2.3. France
- 2.4. Russia
- 2.5. Rest of Europe
-
3. Asia Pacific
- 3.1. China
- 3.2. Japan
- 3.3. India
- 3.4. South Korea
- 3.5. Rest of Asia Pacific
-
4. Latin America
- 4.1. Mexico
- 4.2. Brazil
- 4.3. Rest of Latin America
-
5. Middle East and Africa
- 5.1. Saudi Arabia
- 5.2. United Arab Emirates
- 5.3. Israel
- 5.4. Rest of Middle East and Africa
Airborne Electronic Warfare Industry REPORT HIGHLIGHTS
| Aspects | Details |
|---|---|
| Study Period | 2019-2033 |
| Base Year | 2024 |
| Estimated Year | 2025 |
| Forecast Period | 2025-2033 |
| Historical Period | 2019-2024 |
| Growth Rate | CAGR of > 3.50% from 2019-2033 |
| Segmentation |
|
Table of Contents
- 1. Introduction
- 1.1. Research Scope
- 1.2. Market Segmentation
- 1.3. Research Methodology
- 1.4. Definitions and Assumptions
- 2. Executive Summary
- 2.1. Introduction
- 3. Market Dynamics
- 3.1. Introduction
- 3.2. Market Drivers
- 3.2.1. Increase in Internet of Things (IoT) and Autonomous Systems; Rise in Demand for Military and Defense Satellite Communication Solutions
- 3.3. Market Restrains
- 3.3.1. Cybersecurity Threats to Satellite Communication; Interference in Transmission of Data
- 3.4. Market Trends
- 3.4.1. Unmanned Aircraft Segment to Witness Rapid Growth During the Forecast Period
- 4. Market Factor Analysis
- 4.1. Porters Five Forces
- 4.2. Supply/Value Chain
- 4.3. PESTEL analysis
- 4.4. Market Entropy
- 4.5. Patent/Trademark Analysis
- 5. Global Airborne Electronic Warfare Industry Analysis, Insights and Forecast, 2019-2031
- 5.1. Market Analysis, Insights and Forecast - by Capability
- 5.1.1. Electronic Attack
- 5.1.2. Electronic Protection
- 5.1.3. Electronic Support
- 5.2. Market Analysis, Insights and Forecast - by Type
- 5.2.1. Manned Aircraft
- 5.2.2. Unmanned Aircraft
- 5.3. Market Analysis, Insights and Forecast - by Region
- 5.3.1. North America
- 5.3.2. Europe
- 5.3.3. Asia Pacific
- 5.3.4. Latin America
- 5.3.5. Middle East and Africa
- 5.1. Market Analysis, Insights and Forecast - by Capability
- 6. North America Airborne Electronic Warfare Industry Analysis, Insights and Forecast, 2019-2031
- 6.1. Market Analysis, Insights and Forecast - by Capability
- 6.1.1. Electronic Attack
- 6.1.2. Electronic Protection
- 6.1.3. Electronic Support
- 6.2. Market Analysis, Insights and Forecast - by Type
- 6.2.1. Manned Aircraft
- 6.2.2. Unmanned Aircraft
- 6.1. Market Analysis, Insights and Forecast - by Capability
- 7. Europe Airborne Electronic Warfare Industry Analysis, Insights and Forecast, 2019-2031
- 7.1. Market Analysis, Insights and Forecast - by Capability
- 7.1.1. Electronic Attack
- 7.1.2. Electronic Protection
- 7.1.3. Electronic Support
- 7.2. Market Analysis, Insights and Forecast - by Type
- 7.2.1. Manned Aircraft
- 7.2.2. Unmanned Aircraft
- 7.1. Market Analysis, Insights and Forecast - by Capability
- 8. Asia Pacific Airborne Electronic Warfare Industry Analysis, Insights and Forecast, 2019-2031
- 8.1. Market Analysis, Insights and Forecast - by Capability
- 8.1.1. Electronic Attack
- 8.1.2. Electronic Protection
- 8.1.3. Electronic Support
- 8.2. Market Analysis, Insights and Forecast - by Type
- 8.2.1. Manned Aircraft
- 8.2.2. Unmanned Aircraft
- 8.1. Market Analysis, Insights and Forecast - by Capability
- 9. Latin America Airborne Electronic Warfare Industry Analysis, Insights and Forecast, 2019-2031
- 9.1. Market Analysis, Insights and Forecast - by Capability
- 9.1.1. Electronic Attack
- 9.1.2. Electronic Protection
- 9.1.3. Electronic Support
- 9.2. Market Analysis, Insights and Forecast - by Type
- 9.2.1. Manned Aircraft
- 9.2.2. Unmanned Aircraft
- 9.1. Market Analysis, Insights and Forecast - by Capability
- 10. Middle East and Africa Airborne Electronic Warfare Industry Analysis, Insights and Forecast, 2019-2031
- 10.1. Market Analysis, Insights and Forecast - by Capability
- 10.1.1. Electronic Attack
- 10.1.2. Electronic Protection
- 10.1.3. Electronic Support
- 10.2. Market Analysis, Insights and Forecast - by Type
- 10.2.1. Manned Aircraft
- 10.2.2. Unmanned Aircraft
- 10.1. Market Analysis, Insights and Forecast - by Capability
- 11. North America Airborne Electronic Warfare Industry Analysis, Insights and Forecast, 2019-2031
- 11.1. Market Analysis, Insights and Forecast - By Country/Sub-region
- 11.1.1 United States
- 11.1.2 Canada
- 12. Europe Airborne Electronic Warfare Industry Analysis, Insights and Forecast, 2019-2031
- 12.1. Market Analysis, Insights and Forecast - By Country/Sub-region
- 12.1.1 United Kingdom
- 12.1.2 Germany
- 12.1.3 France
- 12.1.4 Russia
- 12.1.5 Rest of Europe
- 13. Asia Pacific Airborne Electronic Warfare Industry Analysis, Insights and Forecast, 2019-2031
- 13.1. Market Analysis, Insights and Forecast - By Country/Sub-region
- 13.1.1 China
- 13.1.2 Japan
- 13.1.3 India
- 13.1.4 South Korea
- 13.1.5 Rest of Asia Pacific
- 14. Latin America Airborne Electronic Warfare Industry Analysis, Insights and Forecast, 2019-2031
- 14.1. Market Analysis, Insights and Forecast - By Country/Sub-region
- 14.1.1 Mexico
- 14.1.2 Brazil
- 14.1.3 Rest of Latin America
- 15. Middle East and Africa Airborne Electronic Warfare Industry Analysis, Insights and Forecast, 2019-2031
- 15.1. Market Analysis, Insights and Forecast - By Country/Sub-region
- 15.1.1 Saudi Arabia
- 15.1.2 United Arab Emirates
- 15.1.3 Israel
- 15.1.4 Rest of Middle East and Africa
- 16. Competitive Analysis
- 16.1. Global Market Share Analysis 2024
- 16.2. Company Profiles
- 16.2.1 L3Harris Technologies Inc
- 16.2.1.1. Overview
- 16.2.1.2. Products
- 16.2.1.3. SWOT Analysis
- 16.2.1.4. Recent Developments
- 16.2.1.5. Financials (Based on Availability)
- 16.2.2 Raytheon Technologies Corporation
- 16.2.2.1. Overview
- 16.2.2.2. Products
- 16.2.2.3. SWOT Analysis
- 16.2.2.4. Recent Developments
- 16.2.2.5. Financials (Based on Availability)
- 16.2.3 THALES
- 16.2.3.1. Overview
- 16.2.3.2. Products
- 16.2.3.3. SWOT Analysis
- 16.2.3.4. Recent Developments
- 16.2.3.5. Financials (Based on Availability)
- 16.2.4 Elbit Systems Ltd
- 16.2.4.1. Overview
- 16.2.4.2. Products
- 16.2.4.3. SWOT Analysis
- 16.2.4.4. Recent Developments
- 16.2.4.5. Financials (Based on Availability)
- 16.2.5 Lockheed Martin Corporation
- 16.2.5.1. Overview
- 16.2.5.2. Products
- 16.2.5.3. SWOT Analysis
- 16.2.5.4. Recent Developments
- 16.2.5.5. Financials (Based on Availability)
- 16.2.6 Terma Grou
- 16.2.6.1. Overview
- 16.2.6.2. Products
- 16.2.6.3. SWOT Analysis
- 16.2.6.4. Recent Developments
- 16.2.6.5. Financials (Based on Availability)
- 16.2.7 ASELSAN AS
- 16.2.7.1. Overview
- 16.2.7.2. Products
- 16.2.7.3. SWOT Analysis
- 16.2.7.4. Recent Developments
- 16.2.7.5. Financials (Based on Availability)
- 16.2.8 Israel Aerospace Industries Ltd
- 16.2.8.1. Overview
- 16.2.8.2. Products
- 16.2.8.3. SWOT Analysis
- 16.2.8.4. Recent Developments
- 16.2.8.5. Financials (Based on Availability)
- 16.2.9 Leonardo S p A
- 16.2.9.1. Overview
- 16.2.9.2. Products
- 16.2.9.3. SWOT Analysis
- 16.2.9.4. Recent Developments
- 16.2.9.5. Financials (Based on Availability)
- 16.2.10 BAE Systems plc
- 16.2.10.1. Overview
- 16.2.10.2. Products
- 16.2.10.3. SWOT Analysis
- 16.2.10.4. Recent Developments
- 16.2.10.5. Financials (Based on Availability)
- 16.2.11 Northrop Grumman Corporation
- 16.2.11.1. Overview
- 16.2.11.2. Products
- 16.2.11.3. SWOT Analysis
- 16.2.11.4. Recent Developments
- 16.2.11.5. Financials (Based on Availability)
- 16.2.12 Saab AB
- 16.2.12.1. Overview
- 16.2.12.2. Products
- 16.2.12.3. SWOT Analysis
- 16.2.12.4. Recent Developments
- 16.2.12.5. Financials (Based on Availability)
- 16.2.1 L3Harris Technologies Inc
List of Figures
- Figure 1: Global Airborne Electronic Warfare Industry Revenue Breakdown (Million, %) by Region 2024 & 2032
- Figure 2: North America Airborne Electronic Warfare Industry Revenue (Million), by Country 2024 & 2032
- Figure 3: North America Airborne Electronic Warfare Industry Revenue Share (%), by Country 2024 & 2032
- Figure 4: Europe Airborne Electronic Warfare Industry Revenue (Million), by Country 2024 & 2032
- Figure 5: Europe Airborne Electronic Warfare Industry Revenue Share (%), by Country 2024 & 2032
- Figure 6: Asia Pacific Airborne Electronic Warfare Industry Revenue (Million), by Country 2024 & 2032
- Figure 7: Asia Pacific Airborne Electronic Warfare Industry Revenue Share (%), by Country 2024 & 2032
- Figure 8: Latin America Airborne Electronic Warfare Industry Revenue (Million), by Country 2024 & 2032
- Figure 9: Latin America Airborne Electronic Warfare Industry Revenue Share (%), by Country 2024 & 2032
- Figure 10: Middle East and Africa Airborne Electronic Warfare Industry Revenue (Million), by Country 2024 & 2032
- Figure 11: Middle East and Africa Airborne Electronic Warfare Industry Revenue Share (%), by Country 2024 & 2032
- Figure 12: North America Airborne Electronic Warfare Industry Revenue (Million), by Capability 2024 & 2032
- Figure 13: North America Airborne Electronic Warfare Industry Revenue Share (%), by Capability 2024 & 2032
- Figure 14: North America Airborne Electronic Warfare Industry Revenue (Million), by Type 2024 & 2032
- Figure 15: North America Airborne Electronic Warfare Industry Revenue Share (%), by Type 2024 & 2032
- Figure 16: North America Airborne Electronic Warfare Industry Revenue (Million), by Country 2024 & 2032
- Figure 17: North America Airborne Electronic Warfare Industry Revenue Share (%), by Country 2024 & 2032
- Figure 18: Europe Airborne Electronic Warfare Industry Revenue (Million), by Capability 2024 & 2032
- Figure 19: Europe Airborne Electronic Warfare Industry Revenue Share (%), by Capability 2024 & 2032
- Figure 20: Europe Airborne Electronic Warfare Industry Revenue (Million), by Type 2024 & 2032
- Figure 21: Europe Airborne Electronic Warfare Industry Revenue Share (%), by Type 2024 & 2032
- Figure 22: Europe Airborne Electronic Warfare Industry Revenue (Million), by Country 2024 & 2032
- Figure 23: Europe Airborne Electronic Warfare Industry Revenue Share (%), by Country 2024 & 2032
- Figure 24: Asia Pacific Airborne Electronic Warfare Industry Revenue (Million), by Capability 2024 & 2032
- Figure 25: Asia Pacific Airborne Electronic Warfare Industry Revenue Share (%), by Capability 2024 & 2032
- Figure 26: Asia Pacific Airborne Electronic Warfare Industry Revenue (Million), by Type 2024 & 2032
- Figure 27: Asia Pacific Airborne Electronic Warfare Industry Revenue Share (%), by Type 2024 & 2032
- Figure 28: Asia Pacific Airborne Electronic Warfare Industry Revenue (Million), by Country 2024 & 2032
- Figure 29: Asia Pacific Airborne Electronic Warfare Industry Revenue Share (%), by Country 2024 & 2032
- Figure 30: Latin America Airborne Electronic Warfare Industry Revenue (Million), by Capability 2024 & 2032
- Figure 31: Latin America Airborne Electronic Warfare Industry Revenue Share (%), by Capability 2024 & 2032
- Figure 32: Latin America Airborne Electronic Warfare Industry Revenue (Million), by Type 2024 & 2032
- Figure 33: Latin America Airborne Electronic Warfare Industry Revenue Share (%), by Type 2024 & 2032
- Figure 34: Latin America Airborne Electronic Warfare Industry Revenue (Million), by Country 2024 & 2032
- Figure 35: Latin America Airborne Electronic Warfare Industry Revenue Share (%), by Country 2024 & 2032
- Figure 36: Middle East and Africa Airborne Electronic Warfare Industry Revenue (Million), by Capability 2024 & 2032
- Figure 37: Middle East and Africa Airborne Electronic Warfare Industry Revenue Share (%), by Capability 2024 & 2032
- Figure 38: Middle East and Africa Airborne Electronic Warfare Industry Revenue (Million), by Type 2024 & 2032
- Figure 39: Middle East and Africa Airborne Electronic Warfare Industry Revenue Share (%), by Type 2024 & 2032
- Figure 40: Middle East and Africa Airborne Electronic Warfare Industry Revenue (Million), by Country 2024 & 2032
- Figure 41: Middle East and Africa Airborne Electronic Warfare Industry Revenue Share (%), by Country 2024 & 2032
List of Tables
- Table 1: Global Airborne Electronic Warfare Industry Revenue Million Forecast, by Region 2019 & 2032
- Table 2: Global Airborne Electronic Warfare Industry Revenue Million Forecast, by Capability 2019 & 2032
- Table 3: Global Airborne Electronic Warfare Industry Revenue Million Forecast, by Type 2019 & 2032
- Table 4: Global Airborne Electronic Warfare Industry Revenue Million Forecast, by Region 2019 & 2032
- Table 5: Global Airborne Electronic Warfare Industry Revenue Million Forecast, by Country 2019 & 2032
- Table 6: United States Airborne Electronic Warfare Industry Revenue (Million) Forecast, by Application 2019 & 2032
- Table 7: Canada Airborne Electronic Warfare Industry Revenue (Million) Forecast, by Application 2019 & 2032
- Table 8: Global Airborne Electronic Warfare Industry Revenue Million Forecast, by Country 2019 & 2032
- Table 9: United Kingdom Airborne Electronic Warfare Industry Revenue (Million) Forecast, by Application 2019 & 2032
- Table 10: Germany Airborne Electronic Warfare Industry Revenue (Million) Forecast, by Application 2019 & 2032
- Table 11: France Airborne Electronic Warfare Industry Revenue (Million) Forecast, by Application 2019 & 2032
- Table 12: Russia Airborne Electronic Warfare Industry Revenue (Million) Forecast, by Application 2019 & 2032
- Table 13: Rest of Europe Airborne Electronic Warfare Industry Revenue (Million) Forecast, by Application 2019 & 2032
- Table 14: Global Airborne Electronic Warfare Industry Revenue Million Forecast, by Country 2019 & 2032
- Table 15: China Airborne Electronic Warfare Industry Revenue (Million) Forecast, by Application 2019 & 2032
- Table 16: Japan Airborne Electronic Warfare Industry Revenue (Million) Forecast, by Application 2019 & 2032
- Table 17: India Airborne Electronic Warfare Industry Revenue (Million) Forecast, by Application 2019 & 2032
- Table 18: South Korea Airborne Electronic Warfare Industry Revenue (Million) Forecast, by Application 2019 & 2032
- Table 19: Rest of Asia Pacific Airborne Electronic Warfare Industry Revenue (Million) Forecast, by Application 2019 & 2032
- Table 20: Global Airborne Electronic Warfare Industry Revenue Million Forecast, by Country 2019 & 2032
- Table 21: Mexico Airborne Electronic Warfare Industry Revenue (Million) Forecast, by Application 2019 & 2032
- Table 22: Brazil Airborne Electronic Warfare Industry Revenue (Million) Forecast, by Application 2019 & 2032
- Table 23: Rest of Latin America Airborne Electronic Warfare Industry Revenue (Million) Forecast, by Application 2019 & 2032
- Table 24: Global Airborne Electronic Warfare Industry Revenue Million Forecast, by Country 2019 & 2032
- Table 25: Saudi Arabia Airborne Electronic Warfare Industry Revenue (Million) Forecast, by Application 2019 & 2032
- Table 26: United Arab Emirates Airborne Electronic Warfare Industry Revenue (Million) Forecast, by Application 2019 & 2032
- Table 27: Israel Airborne Electronic Warfare Industry Revenue (Million) Forecast, by Application 2019 & 2032
- Table 28: Rest of Middle East and Africa Airborne Electronic Warfare Industry Revenue (Million) Forecast, by Application 2019 & 2032
- Table 29: Global Airborne Electronic Warfare Industry Revenue Million Forecast, by Capability 2019 & 2032
- Table 30: Global Airborne Electronic Warfare Industry Revenue Million Forecast, by Type 2019 & 2032
- Table 31: Global Airborne Electronic Warfare Industry Revenue Million Forecast, by Country 2019 & 2032
- Table 32: United States Airborne Electronic Warfare Industry Revenue (Million) Forecast, by Application 2019 & 2032
- Table 33: Canada Airborne Electronic Warfare Industry Revenue (Million) Forecast, by Application 2019 & 2032
- Table 34: Global Airborne Electronic Warfare Industry Revenue Million Forecast, by Capability 2019 & 2032
- Table 35: Global Airborne Electronic Warfare Industry Revenue Million Forecast, by Type 2019 & 2032
- Table 36: Global Airborne Electronic Warfare Industry Revenue Million Forecast, by Country 2019 & 2032
- Table 37: United Kingdom Airborne Electronic Warfare Industry Revenue (Million) Forecast, by Application 2019 & 2032
- Table 38: Germany Airborne Electronic Warfare Industry Revenue (Million) Forecast, by Application 2019 & 2032
- Table 39: France Airborne Electronic Warfare Industry Revenue (Million) Forecast, by Application 2019 & 2032
- Table 40: Russia Airborne Electronic Warfare Industry Revenue (Million) Forecast, by Application 2019 & 2032
- Table 41: Rest of Europe Airborne Electronic Warfare Industry Revenue (Million) Forecast, by Application 2019 & 2032
- Table 42: Global Airborne Electronic Warfare Industry Revenue Million Forecast, by Capability 2019 & 2032
- Table 43: Global Airborne Electronic Warfare Industry Revenue Million Forecast, by Type 2019 & 2032
- Table 44: Global Airborne Electronic Warfare Industry Revenue Million Forecast, by Country 2019 & 2032
- Table 45: China Airborne Electronic Warfare Industry Revenue (Million) Forecast, by Application 2019 & 2032
- Table 46: Japan Airborne Electronic Warfare Industry Revenue (Million) Forecast, by Application 2019 & 2032
- Table 47: India Airborne Electronic Warfare Industry Revenue (Million) Forecast, by Application 2019 & 2032
- Table 48: South Korea Airborne Electronic Warfare Industry Revenue (Million) Forecast, by Application 2019 & 2032
- Table 49: Rest of Asia Pacific Airborne Electronic Warfare Industry Revenue (Million) Forecast, by Application 2019 & 2032
- Table 50: Global Airborne Electronic Warfare Industry Revenue Million Forecast, by Capability 2019 & 2032
- Table 51: Global Airborne Electronic Warfare Industry Revenue Million Forecast, by Type 2019 & 2032
- Table 52: Global Airborne Electronic Warfare Industry Revenue Million Forecast, by Country 2019 & 2032
- Table 53: Mexico Airborne Electronic Warfare Industry Revenue (Million) Forecast, by Application 2019 & 2032
- Table 54: Brazil Airborne Electronic Warfare Industry Revenue (Million) Forecast, by Application 2019 & 2032
- Table 55: Rest of Latin America Airborne Electronic Warfare Industry Revenue (Million) Forecast, by Application 2019 & 2032
- Table 56: Global Airborne Electronic Warfare Industry Revenue Million Forecast, by Capability 2019 & 2032
- Table 57: Global Airborne Electronic Warfare Industry Revenue Million Forecast, by Type 2019 & 2032
- Table 58: Global Airborne Electronic Warfare Industry Revenue Million Forecast, by Country 2019 & 2032
- Table 59: Saudi Arabia Airborne Electronic Warfare Industry Revenue (Million) Forecast, by Application 2019 & 2032
- Table 60: United Arab Emirates Airborne Electronic Warfare Industry Revenue (Million) Forecast, by Application 2019 & 2032
- Table 61: Israel Airborne Electronic Warfare Industry Revenue (Million) Forecast, by Application 2019 & 2032
- Table 62: Rest of Middle East and Africa Airborne Electronic Warfare Industry Revenue (Million) Forecast, by Application 2019 & 2032
Frequently Asked Questions
1. What is the projected Compound Annual Growth Rate (CAGR) of the Airborne Electronic Warfare Industry?
The projected CAGR is approximately > 3.50%.
2. Which companies are prominent players in the Airborne Electronic Warfare Industry?
Key companies in the market include L3Harris Technologies Inc, Raytheon Technologies Corporation, THALES, Elbit Systems Ltd, Lockheed Martin Corporation, Terma Grou, ASELSAN AS, Israel Aerospace Industries Ltd, Leonardo S p A, BAE Systems plc, Northrop Grumman Corporation, Saab AB.
3. What are the main segments of the Airborne Electronic Warfare Industry?
The market segments include Capability, Type.
4. Can you provide details about the market size?
The market size is estimated to be USD XX Million as of 2022.
5. What are some drivers contributing to market growth?
Increase in Internet of Things (IoT) and Autonomous Systems; Rise in Demand for Military and Defense Satellite Communication Solutions.
6. What are the notable trends driving market growth?
Unmanned Aircraft Segment to Witness Rapid Growth During the Forecast Period.
7. Are there any restraints impacting market growth?
Cybersecurity Threats to Satellite Communication; Interference in Transmission of Data.
8. Can you provide examples of recent developments in the market?
March 2022: BAE Systems plc launched its versatile Storm electronic warfare modules designed to provide customized, state-of-the-art offensive and defense electronic warfare mission systems for combat platforms for the broader United States and allied fleets. Storm electronic warfare modules use a proven common core architecture to accelerate the delivery of software-based electronic warfare capabilities, providing warfighters with the situational awareness, survivability, and electromagnetic capabilities needed for today's complex missions.
9. What pricing options are available for accessing the report?
Pricing options include single-user, multi-user, and enterprise licenses priced at USD 4750, USD 5250, and USD 8750 respectively.
10. Is the market size provided in terms of value or volume?
The market size is provided in terms of value, measured in Million.
11. Are there any specific market keywords associated with the report?
Yes, the market keyword associated with the report is "Airborne Electronic Warfare Industry," which aids in identifying and referencing the specific market segment covered.
12. How do I determine which pricing option suits my needs best?
The pricing options vary based on user requirements and access needs. Individual users may opt for single-user licenses, while businesses requiring broader access may choose multi-user or enterprise licenses for cost-effective access to the report.
13. Are there any additional resources or data provided in the Airborne Electronic Warfare Industry report?
While the report offers comprehensive insights, it's advisable to review the specific contents or supplementary materials provided to ascertain if additional resources or data are available.
14. How can I stay updated on further developments or reports in the Airborne Electronic Warfare Industry?
To stay informed about further developments, trends, and reports in the Airborne Electronic Warfare Industry, consider subscribing to industry newsletters, following relevant companies and organizations, or regularly checking reputable industry news sources and publications.
Methodology
Step 1 - Identification of Relevant Samples Size from Population Database


Step 2 - Approaches for Defining Global Market Size (Value, Volume* & Price*)

Note*: In applicable scenarios
Step 3 - Data Sources
Primary Research
- Web Analytics
- Survey Reports
- Research Institute
- Latest Research Reports
- Opinion Leaders
Secondary Research
- Annual Reports
- White Paper
- Latest Press Release
- Industry Association
- Paid Database
- Investor Presentations

Step 4 - Data Triangulation
Involves using different sources of information in order to increase the validity of a study
These sources are likely to be stakeholders in a program - participants, other researchers, program staff, other community members, and so on.
Then we put all data in single framework & apply various statistical tools to find out the dynamic on the market.
During the analysis stage, feedback from the stakeholder groups would be compared to determine areas of agreement as well as areas of divergence


