
Key Insights
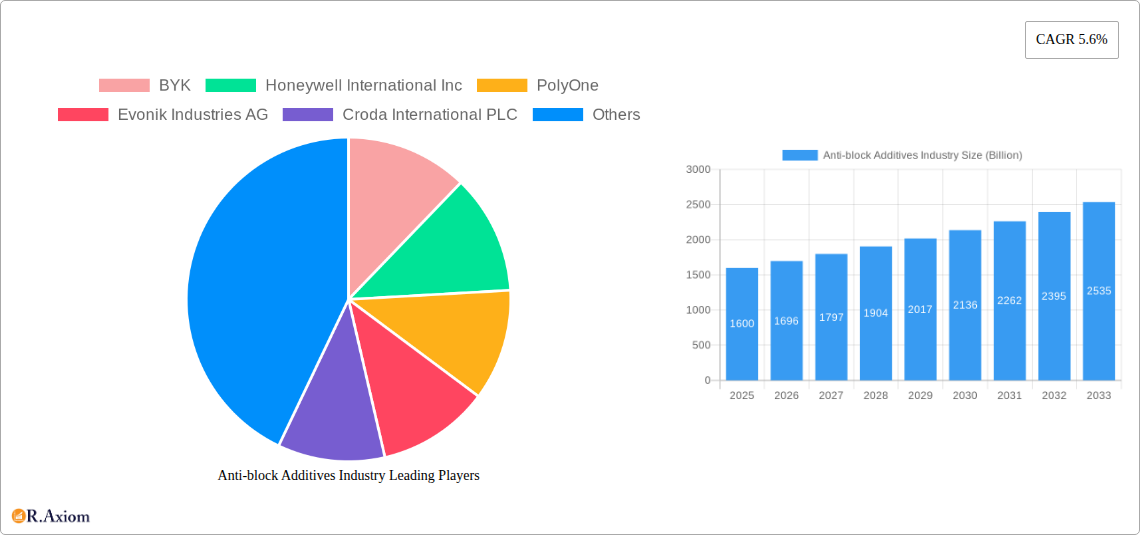
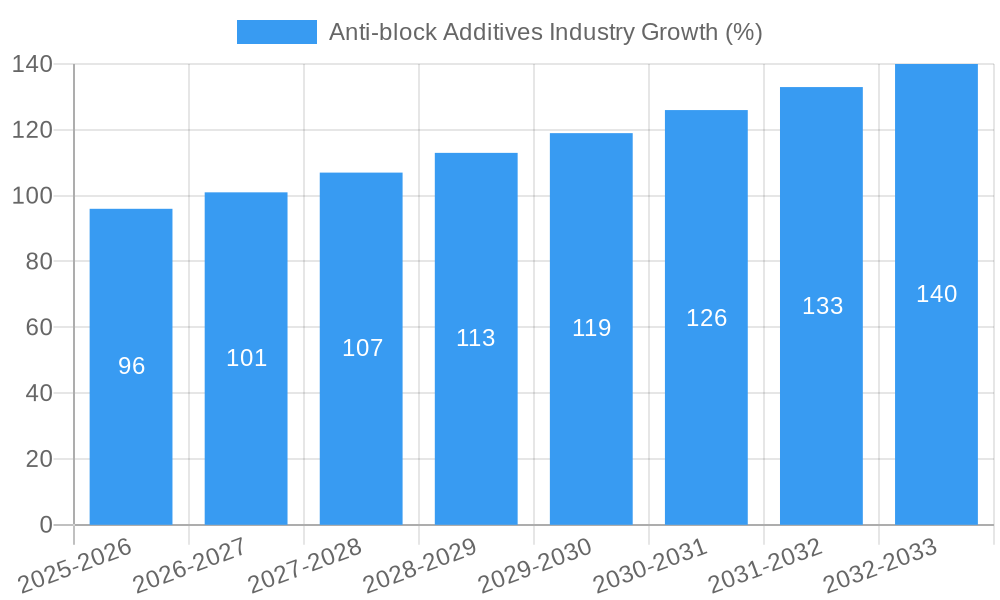
The global anti-block additives market, valued at $1.6 billion in 2025, is projected to experience robust growth, driven by a Compound Annual Growth Rate (CAGR) of 5.6% from 2025 to 2033. This expansion is fueled by several key factors. The increasing demand for flexible packaging across various industries, including food and pharmaceuticals, is a primary driver. Consumers are increasingly prioritizing convenience and extended shelf life, leading to a surge in demand for flexible packaging materials that require effective anti-blocking agents to prevent sticking. Furthermore, stringent regulatory requirements regarding food safety and packaging materials are pushing manufacturers to adopt high-performance anti-block additives that ensure product integrity and consumer safety. Technological advancements in additive formulations are also contributing to market growth, with the development of more sustainable and efficient options catering to the growing environmental consciousness. The diverse range of polymer types used in packaging, including LDPE, LLDPE, PVC, BOPP, and HDPE, creates a significant market for specialized anti-block additives tailored to specific material properties.
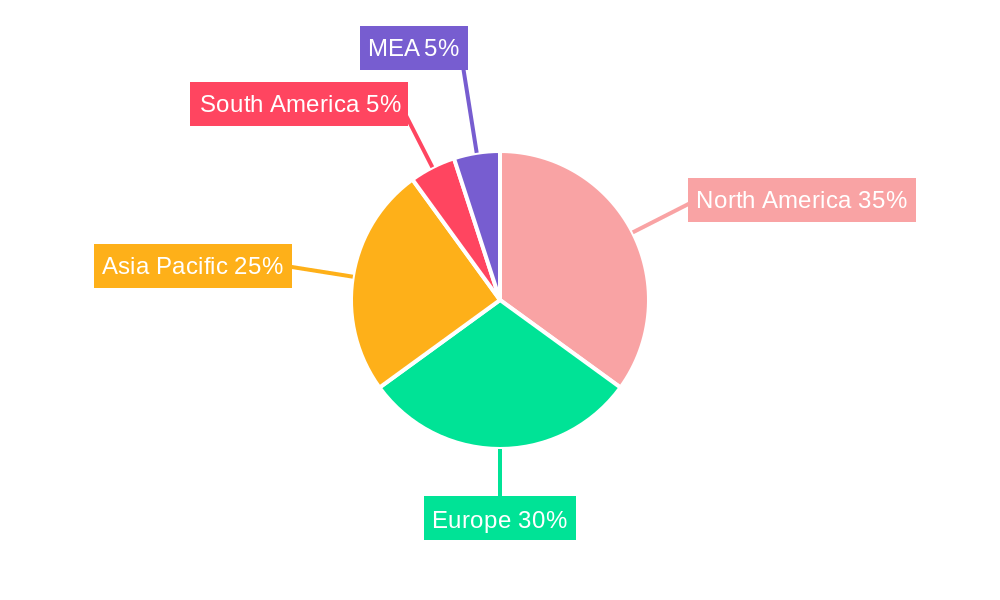
Segment-wise, the food packaging application segment is expected to dominate the market due to the high volume of flexible food packaging consumed globally. However, the pharmaceutical and industrial segments are also exhibiting significant growth potential, driven by rising demand for tamper-evident and protective packaging. Geographically, North America and Europe currently hold significant market share due to established industries and stringent regulations, but the Asia-Pacific region is anticipated to experience the fastest growth in the coming years due to rapid industrialization and increasing consumer spending. Competition in the market is intense, with key players such as BYK, Honeywell International Inc., PolyOne, and Evonik Industries AG constantly innovating to improve additive performance and expand their market reach. The market's growth trajectory is expected to remain positive throughout the forecast period, driven by ongoing industry trends and technological innovations.
Anti-block Additives Industry: A Comprehensive Market Report (2019-2033)
This comprehensive report provides a detailed analysis of the global anti-block additives industry, offering valuable insights for stakeholders, investors, and industry professionals. The report covers the period from 2019 to 2033, with a focus on the forecast period of 2025-2033 and a base year of 2025. The market is projected to reach a value of Billion USD by 2033, exhibiting a significant CAGR of xx% during the forecast period.
Anti-block Additives Industry Market Concentration & Innovation
The anti-block additives market is moderately concentrated, with several key players holding significant market share. BYK, Honeywell International Inc, PolyOne, Evonik Industries AG, and Croda International PLC are among the leading companies, collectively accounting for an estimated xx% of the global market share in 2025. Market concentration is influenced by factors such as economies of scale, R&D capabilities, and brand recognition. Innovation plays a crucial role, with companies investing heavily in developing novel anti-block additives with improved performance characteristics, such as enhanced efficiency, broader compatibility, and reduced environmental impact.
- Innovation Drivers: Stringent regulatory requirements for reducing plastic waste, the growing demand for sustainable packaging solutions, and the continuous development of new polymer types are driving innovation.
- Regulatory Frameworks: Regulations regarding the use of specific chemicals in various applications, particularly in food packaging, significantly impact the market.
- Product Substitutes: While limited, some natural alternatives are emerging, but their performance often falls short of synthetic anti-block additives.
- End-User Trends: The shift toward flexible packaging and the increasing demand for lightweight, high-performance materials are key end-user trends influencing the market.
- M&A Activities: The industry has witnessed several mergers and acquisitions (M&A) in recent years, with deal values exceeding Billion USD in the past five years. These activities aim to expand market reach, enhance product portfolios, and strengthen competitive positions.
Anti-block Additives Industry Industry Trends & Insights
The anti-block additives market is experiencing robust growth, driven by several factors. The increasing demand for flexible packaging, particularly in the food and pharmaceutical industries, is a significant growth driver. The rising consumption of packaged goods globally, coupled with the need for enhanced product protection and extended shelf life, fuels the demand for anti-block additives. Technological advancements, such as the development of more efficient and sustainable additives, are further boosting market expansion. Consumer preference for convenient, lightweight packaging is another major factor. Competitive dynamics are characterized by ongoing innovation, product differentiation, and strategic partnerships. The market penetration of bio-based anti-block additives is gradually increasing, although they currently hold a relatively small market share compared to conventional synthetic additives. The overall market is expected to register a CAGR of xx% from 2025 to 2033.
Dominant Markets & Segments in Anti-block Additives Industry
The Asia Pacific region currently dominates the anti-block additives market, driven by rapid economic growth, expanding manufacturing sectors, and increasing consumption of packaged goods. Within this region, China and India are major markets.
- Key Drivers in Asia Pacific:
- Rapid industrialization and urbanization
- Growing middle class with increased disposable income
- Favorable government policies promoting manufacturing and packaging industries
- Expanding food and beverage sector
Segment Dominance:
- Product Type: Organic anti-block additives currently hold a larger market share compared to inorganic additives due to their superior performance characteristics and broader applications.
- Polymer Type: Low-density polyethylene (LDPE) and linear low-density polyethylene (LLDPE) are the dominant polymer types, accounting for the largest share owing to their widespread use in flexible packaging.
- Application: The food packaging segment is the leading application area for anti-block additives due to the increasing demand for packaged food products.
Anti-block Additives Industry Product Developments
Recent product innovations focus on enhancing the performance of anti-block additives across various polymer types and applications. New additives are being developed to improve slip, anti-static properties, and reduce the environmental impact. This includes the development of bio-based alternatives and additives with enhanced dispersibility. The key competitive advantage lies in developing additives that offer superior performance at lower concentrations, resulting in cost savings and environmental benefits.
Report Scope & Segmentation Analysis
This report provides a comprehensive segmentation analysis of the anti-block additives market, categorized by product type (organic, inorganic), polymer type (LDPE, LLDPE, PVC, BOPP, HDPE, others), and application (food packaging, pharmaceutical, industrial, agriculture, others). Each segment's growth projections, market size, and competitive dynamics are detailed in the full report. The report includes a detailed analysis of the organic and inorganic segments, which is projected to reach Billion USD and Billion USD, respectively, by 2033. Similarly, the market is segmented by polymer types and applications, with respective market sizes and growth projections provided within the full report.
Key Drivers of Anti-block Additives Industry Growth
The growth of the anti-block additives market is primarily fueled by several factors: the increasing demand for flexible packaging solutions driven by the rising consumption of packaged goods globally; the need for enhanced product protection and extended shelf life; and technological advancements leading to the development of more efficient and sustainable additives. Furthermore, stringent regulations regarding food safety and hygiene are pushing the demand for high-quality anti-block additives.
Challenges in the Anti-block Additives Industry Sector
The anti-block additives industry faces challenges such as fluctuating raw material prices, stringent regulatory compliance requirements, and intense competition from established players. Supply chain disruptions can also impact production and availability, leading to price fluctuations. Furthermore, the development and adoption of sustainable alternatives poses both an opportunity and a challenge to incumbents.
Emerging Opportunities in Anti-block Additives Industry
Emerging opportunities lie in the development of bio-based and sustainable anti-block additives, catering to the growing demand for eco-friendly packaging solutions. The expansion into new and emerging markets, particularly in developing economies, presents significant growth potential. Furthermore, advancements in additive technology, offering enhanced performance characteristics, represent a key opportunity for industry players.
Leading Players in the Anti-block Additives Industry Market
- BYK
- Honeywell International Inc
- PolyOne
- Evonik Industries AG
- Croda International PLC
- Tosaf Benelux
- Momentive
- W R Grace & Co -Conn
- Imerys Performance Additives
- Plastics Color Corporation
- Ampacet Corporation
- A Schulman Inc (LyondellBasell)
Key Developments in Anti-block Additives Industry Industry
- 2022-Q4: Evonik Industries AG launched a new range of sustainable anti-block additives.
- 2023-Q1: PolyOne acquired a smaller anti-block additive producer, expanding its market share.
- 2023-Q3: New regulations regarding the use of certain chemicals in food packaging came into effect in several regions. (Further developments will be added in the final report)
Strategic Outlook for Anti-block Additives Industry Market
The future of the anti-block additives market looks promising, driven by sustained growth in the packaging industry, coupled with the ongoing development of innovative and sustainable products. The increasing focus on eco-friendly and biodegradable alternatives will shape the industry's trajectory. Companies that invest in R&D, adopt sustainable practices, and effectively navigate the evolving regulatory landscape are well-positioned to capture significant market share in the coming years.
Anti-block Additives Industry Segmentation
-
1. Product Type
- 1.1. Organic
- 1.2. Inorganic
-
2. Polymer Type
- 2.1. Low Density Polyethylene (LDPE)
- 2.2. Linear Low-density Polyethylene (LLDPE)
- 2.3. Polyvinyl Chloride (PVC)
- 2.4. Biaxially-oriented Polypropylene (BOPP)
- 2.5. High-density polyethylene (HDPE)
- 2.6. Others
-
3. Application
- 3.1. Food Packaging
- 3.2. Pharmaceutical
- 3.3. Industrial
- 3.4. Agriculture
- 3.5. Others
Anti-block Additives Industry Segmentation By Geography
-
1. Asia Pacific
- 1.1. China
- 1.2. India
- 1.3. Japan
- 1.4. South Korea
- 1.5. Rest of Asia Pacific
-
2. North America
- 2.1. United States
- 2.2. Canada
- 2.3. Mexico
-
3. Europe
- 3.1. Germany
- 3.2. United Kingdom
- 3.3. France
- 3.4. Italy
- 3.5. Rest of Europe
-
4. South America
- 4.1. Brazil
- 4.2. Argentina
- 4.3. Rest of South America
-
5. Middle East and Africa
- 5.1. Saudi Arabia
- 5.2. South Africa
- 5.3. Rest of Middle East and Africa
Anti-block Additives Industry REPORT HIGHLIGHTS
| Aspects | Details |
|---|---|
| Study Period | 2019-2033 |
| Base Year | 2024 |
| Estimated Year | 2025 |
| Forecast Period | 2025-2033 |
| Historical Period | 2019-2024 |
| Growth Rate | CAGR of 5.6% from 2019-2033 |
| Segmentation |
|
Table of Contents
- 1. Introduction
- 1.1. Research Scope
- 1.2. Market Segmentation
- 1.3. Research Methodology
- 1.4. Definitions and Assumptions
- 2. Executive Summary
- 2.1. Introduction
- 3. Market Dynamics
- 3.1. Introduction
- 3.2. Market Drivers
- 3.2.1. ; Growing Food Packaging Sector; Rising Demand for Greenhouse Protected Cultivation
- 3.3. Market Restrains
- 3.3.1. ; Negative Affect on the Optical Properties of Plastic Film; Unfavorable Conditions Arising Due to COVID-19 Outbreak
- 3.4. Market Trends
- 3.4.1. The Food Packaging Sector to Dominate the Market
- 4. Market Factor Analysis
- 4.1. Porters Five Forces
- 4.2. Supply/Value Chain
- 4.3. PESTEL analysis
- 4.4. Market Entropy
- 4.5. Patent/Trademark Analysis
- 5. Global Anti-block Additives Industry Analysis, Insights and Forecast, 2019-2031
- 5.1. Market Analysis, Insights and Forecast - by Product Type
- 5.1.1. Organic
- 5.1.2. Inorganic
- 5.2. Market Analysis, Insights and Forecast - by Polymer Type
- 5.2.1. Low Density Polyethylene (LDPE)
- 5.2.2. Linear Low-density Polyethylene (LLDPE)
- 5.2.3. Polyvinyl Chloride (PVC)
- 5.2.4. Biaxially-oriented Polypropylene (BOPP)
- 5.2.5. High-density polyethylene (HDPE)
- 5.2.6. Others
- 5.3. Market Analysis, Insights and Forecast - by Application
- 5.3.1. Food Packaging
- 5.3.2. Pharmaceutical
- 5.3.3. Industrial
- 5.3.4. Agriculture
- 5.3.5. Others
- 5.4. Market Analysis, Insights and Forecast - by Region
- 5.4.1. Asia Pacific
- 5.4.2. North America
- 5.4.3. Europe
- 5.4.4. South America
- 5.4.5. Middle East and Africa
- 5.1. Market Analysis, Insights and Forecast - by Product Type
- 6. Asia Pacific Anti-block Additives Industry Analysis, Insights and Forecast, 2019-2031
- 6.1. Market Analysis, Insights and Forecast - by Product Type
- 6.1.1. Organic
- 6.1.2. Inorganic
- 6.2. Market Analysis, Insights and Forecast - by Polymer Type
- 6.2.1. Low Density Polyethylene (LDPE)
- 6.2.2. Linear Low-density Polyethylene (LLDPE)
- 6.2.3. Polyvinyl Chloride (PVC)
- 6.2.4. Biaxially-oriented Polypropylene (BOPP)
- 6.2.5. High-density polyethylene (HDPE)
- 6.2.6. Others
- 6.3. Market Analysis, Insights and Forecast - by Application
- 6.3.1. Food Packaging
- 6.3.2. Pharmaceutical
- 6.3.3. Industrial
- 6.3.4. Agriculture
- 6.3.5. Others
- 6.1. Market Analysis, Insights and Forecast - by Product Type
- 7. North America Anti-block Additives Industry Analysis, Insights and Forecast, 2019-2031
- 7.1. Market Analysis, Insights and Forecast - by Product Type
- 7.1.1. Organic
- 7.1.2. Inorganic
- 7.2. Market Analysis, Insights and Forecast - by Polymer Type
- 7.2.1. Low Density Polyethylene (LDPE)
- 7.2.2. Linear Low-density Polyethylene (LLDPE)
- 7.2.3. Polyvinyl Chloride (PVC)
- 7.2.4. Biaxially-oriented Polypropylene (BOPP)
- 7.2.5. High-density polyethylene (HDPE)
- 7.2.6. Others
- 7.3. Market Analysis, Insights and Forecast - by Application
- 7.3.1. Food Packaging
- 7.3.2. Pharmaceutical
- 7.3.3. Industrial
- 7.3.4. Agriculture
- 7.3.5. Others
- 7.1. Market Analysis, Insights and Forecast - by Product Type
- 8. Europe Anti-block Additives Industry Analysis, Insights and Forecast, 2019-2031
- 8.1. Market Analysis, Insights and Forecast - by Product Type
- 8.1.1. Organic
- 8.1.2. Inorganic
- 8.2. Market Analysis, Insights and Forecast - by Polymer Type
- 8.2.1. Low Density Polyethylene (LDPE)
- 8.2.2. Linear Low-density Polyethylene (LLDPE)
- 8.2.3. Polyvinyl Chloride (PVC)
- 8.2.4. Biaxially-oriented Polypropylene (BOPP)
- 8.2.5. High-density polyethylene (HDPE)
- 8.2.6. Others
- 8.3. Market Analysis, Insights and Forecast - by Application
- 8.3.1. Food Packaging
- 8.3.2. Pharmaceutical
- 8.3.3. Industrial
- 8.3.4. Agriculture
- 8.3.5. Others
- 8.1. Market Analysis, Insights and Forecast - by Product Type
- 9. South America Anti-block Additives Industry Analysis, Insights and Forecast, 2019-2031
- 9.1. Market Analysis, Insights and Forecast - by Product Type
- 9.1.1. Organic
- 9.1.2. Inorganic
- 9.2. Market Analysis, Insights and Forecast - by Polymer Type
- 9.2.1. Low Density Polyethylene (LDPE)
- 9.2.2. Linear Low-density Polyethylene (LLDPE)
- 9.2.3. Polyvinyl Chloride (PVC)
- 9.2.4. Biaxially-oriented Polypropylene (BOPP)
- 9.2.5. High-density polyethylene (HDPE)
- 9.2.6. Others
- 9.3. Market Analysis, Insights and Forecast - by Application
- 9.3.1. Food Packaging
- 9.3.2. Pharmaceutical
- 9.3.3. Industrial
- 9.3.4. Agriculture
- 9.3.5. Others
- 9.1. Market Analysis, Insights and Forecast - by Product Type
- 10. Middle East and Africa Anti-block Additives Industry Analysis, Insights and Forecast, 2019-2031
- 10.1. Market Analysis, Insights and Forecast - by Product Type
- 10.1.1. Organic
- 10.1.2. Inorganic
- 10.2. Market Analysis, Insights and Forecast - by Polymer Type
- 10.2.1. Low Density Polyethylene (LDPE)
- 10.2.2. Linear Low-density Polyethylene (LLDPE)
- 10.2.3. Polyvinyl Chloride (PVC)
- 10.2.4. Biaxially-oriented Polypropylene (BOPP)
- 10.2.5. High-density polyethylene (HDPE)
- 10.2.6. Others
- 10.3. Market Analysis, Insights and Forecast - by Application
- 10.3.1. Food Packaging
- 10.3.2. Pharmaceutical
- 10.3.3. Industrial
- 10.3.4. Agriculture
- 10.3.5. Others
- 10.1. Market Analysis, Insights and Forecast - by Product Type
- 11. North America Anti-block Additives Industry Analysis, Insights and Forecast, 2019-2031
- 11.1. Market Analysis, Insights and Forecast - By Country/Sub-region
- 11.1.1 United States
- 11.1.2 Canada
- 11.1.3 Mexico
- 12. Europe Anti-block Additives Industry Analysis, Insights and Forecast, 2019-2031
- 12.1. Market Analysis, Insights and Forecast - By Country/Sub-region
- 12.1.1 Germany
- 12.1.2 France
- 12.1.3 Italy
- 12.1.4 United Kingdom
- 12.1.5 Netherlands
- 12.1.6 Rest of Europe
- 13. Asia Pacific Anti-block Additives Industry Analysis, Insights and Forecast, 2019-2031
- 13.1. Market Analysis, Insights and Forecast - By Country/Sub-region
- 13.1.1 China
- 13.1.2 Japan
- 13.1.3 India
- 13.1.4 South Korea
- 13.1.5 Taiwan
- 13.1.6 Australia
- 13.1.7 Rest of Asia-Pacific
- 14. South America Anti-block Additives Industry Analysis, Insights and Forecast, 2019-2031
- 14.1. Market Analysis, Insights and Forecast - By Country/Sub-region
- 14.1.1 Brazil
- 14.1.2 Argentina
- 14.1.3 Rest of South America
- 15. MEA Anti-block Additives Industry Analysis, Insights and Forecast, 2019-2031
- 15.1. Market Analysis, Insights and Forecast - By Country/Sub-region
- 15.1.1 Middle East
- 15.1.2 Africa
- 16. Competitive Analysis
- 16.1. Global Market Share Analysis 2024
- 16.2. Company Profiles
- 16.2.1 BYK
- 16.2.1.1. Overview
- 16.2.1.2. Products
- 16.2.1.3. SWOT Analysis
- 16.2.1.4. Recent Developments
- 16.2.1.5. Financials (Based on Availability)
- 16.2.2 Honeywell International Inc
- 16.2.2.1. Overview
- 16.2.2.2. Products
- 16.2.2.3. SWOT Analysis
- 16.2.2.4. Recent Developments
- 16.2.2.5. Financials (Based on Availability)
- 16.2.3 PolyOne
- 16.2.3.1. Overview
- 16.2.3.2. Products
- 16.2.3.3. SWOT Analysis
- 16.2.3.4. Recent Developments
- 16.2.3.5. Financials (Based on Availability)
- 16.2.4 Evonik Industries AG
- 16.2.4.1. Overview
- 16.2.4.2. Products
- 16.2.4.3. SWOT Analysis
- 16.2.4.4. Recent Developments
- 16.2.4.5. Financials (Based on Availability)
- 16.2.5 Croda International PLC
- 16.2.5.1. Overview
- 16.2.5.2. Products
- 16.2.5.3. SWOT Analysis
- 16.2.5.4. Recent Developments
- 16.2.5.5. Financials (Based on Availability)
- 16.2.6 Tosaf Benelux
- 16.2.6.1. Overview
- 16.2.6.2. Products
- 16.2.6.3. SWOT Analysis
- 16.2.6.4. Recent Developments
- 16.2.6.5. Financials (Based on Availability)
- 16.2.7 Momentive
- 16.2.7.1. Overview
- 16.2.7.2. Products
- 16.2.7.3. SWOT Analysis
- 16.2.7.4. Recent Developments
- 16.2.7.5. Financials (Based on Availability)
- 16.2.8 W R Grace & Co -Conn
- 16.2.8.1. Overview
- 16.2.8.2. Products
- 16.2.8.3. SWOT Analysis
- 16.2.8.4. Recent Developments
- 16.2.8.5. Financials (Based on Availability)
- 16.2.9 Imerys Performance Additives
- 16.2.9.1. Overview
- 16.2.9.2. Products
- 16.2.9.3. SWOT Analysis
- 16.2.9.4. Recent Developments
- 16.2.9.5. Financials (Based on Availability)
- 16.2.10 Plastics Color Corporation
- 16.2.10.1. Overview
- 16.2.10.2. Products
- 16.2.10.3. SWOT Analysis
- 16.2.10.4. Recent Developments
- 16.2.10.5. Financials (Based on Availability)
- 16.2.11 Ampacet Corporation
- 16.2.11.1. Overview
- 16.2.11.2. Products
- 16.2.11.3. SWOT Analysis
- 16.2.11.4. Recent Developments
- 16.2.11.5. Financials (Based on Availability)
- 16.2.12 A Schulman Inc (LyondellBasell)
- 16.2.12.1. Overview
- 16.2.12.2. Products
- 16.2.12.3. SWOT Analysis
- 16.2.12.4. Recent Developments
- 16.2.12.5. Financials (Based on Availability)
- 16.2.1 BYK
List of Figures
- Figure 1: Global Anti-block Additives Industry Revenue Breakdown (Billion, %) by Region 2024 & 2032
- Figure 2: Global Anti-block Additives Industry Volume Breakdown (K Tons, %) by Region 2024 & 2032
- Figure 3: North America Anti-block Additives Industry Revenue (Billion), by Country 2024 & 2032
- Figure 4: North America Anti-block Additives Industry Volume (K Tons), by Country 2024 & 2032
- Figure 5: North America Anti-block Additives Industry Revenue Share (%), by Country 2024 & 2032
- Figure 6: North America Anti-block Additives Industry Volume Share (%), by Country 2024 & 2032
- Figure 7: Europe Anti-block Additives Industry Revenue (Billion), by Country 2024 & 2032
- Figure 8: Europe Anti-block Additives Industry Volume (K Tons), by Country 2024 & 2032
- Figure 9: Europe Anti-block Additives Industry Revenue Share (%), by Country 2024 & 2032
- Figure 10: Europe Anti-block Additives Industry Volume Share (%), by Country 2024 & 2032
- Figure 11: Asia Pacific Anti-block Additives Industry Revenue (Billion), by Country 2024 & 2032
- Figure 12: Asia Pacific Anti-block Additives Industry Volume (K Tons), by Country 2024 & 2032
- Figure 13: Asia Pacific Anti-block Additives Industry Revenue Share (%), by Country 2024 & 2032
- Figure 14: Asia Pacific Anti-block Additives Industry Volume Share (%), by Country 2024 & 2032
- Figure 15: South America Anti-block Additives Industry Revenue (Billion), by Country 2024 & 2032
- Figure 16: South America Anti-block Additives Industry Volume (K Tons), by Country 2024 & 2032
- Figure 17: South America Anti-block Additives Industry Revenue Share (%), by Country 2024 & 2032
- Figure 18: South America Anti-block Additives Industry Volume Share (%), by Country 2024 & 2032
- Figure 19: MEA Anti-block Additives Industry Revenue (Billion), by Country 2024 & 2032
- Figure 20: MEA Anti-block Additives Industry Volume (K Tons), by Country 2024 & 2032
- Figure 21: MEA Anti-block Additives Industry Revenue Share (%), by Country 2024 & 2032
- Figure 22: MEA Anti-block Additives Industry Volume Share (%), by Country 2024 & 2032
- Figure 23: Asia Pacific Anti-block Additives Industry Revenue (Billion), by Product Type 2024 & 2032
- Figure 24: Asia Pacific Anti-block Additives Industry Volume (K Tons), by Product Type 2024 & 2032
- Figure 25: Asia Pacific Anti-block Additives Industry Revenue Share (%), by Product Type 2024 & 2032
- Figure 26: Asia Pacific Anti-block Additives Industry Volume Share (%), by Product Type 2024 & 2032
- Figure 27: Asia Pacific Anti-block Additives Industry Revenue (Billion), by Polymer Type 2024 & 2032
- Figure 28: Asia Pacific Anti-block Additives Industry Volume (K Tons), by Polymer Type 2024 & 2032
- Figure 29: Asia Pacific Anti-block Additives Industry Revenue Share (%), by Polymer Type 2024 & 2032
- Figure 30: Asia Pacific Anti-block Additives Industry Volume Share (%), by Polymer Type 2024 & 2032
- Figure 31: Asia Pacific Anti-block Additives Industry Revenue (Billion), by Application 2024 & 2032
- Figure 32: Asia Pacific Anti-block Additives Industry Volume (K Tons), by Application 2024 & 2032
- Figure 33: Asia Pacific Anti-block Additives Industry Revenue Share (%), by Application 2024 & 2032
- Figure 34: Asia Pacific Anti-block Additives Industry Volume Share (%), by Application 2024 & 2032
- Figure 35: Asia Pacific Anti-block Additives Industry Revenue (Billion), by Country 2024 & 2032
- Figure 36: Asia Pacific Anti-block Additives Industry Volume (K Tons), by Country 2024 & 2032
- Figure 37: Asia Pacific Anti-block Additives Industry Revenue Share (%), by Country 2024 & 2032
- Figure 38: Asia Pacific Anti-block Additives Industry Volume Share (%), by Country 2024 & 2032
- Figure 39: North America Anti-block Additives Industry Revenue (Billion), by Product Type 2024 & 2032
- Figure 40: North America Anti-block Additives Industry Volume (K Tons), by Product Type 2024 & 2032
- Figure 41: North America Anti-block Additives Industry Revenue Share (%), by Product Type 2024 & 2032
- Figure 42: North America Anti-block Additives Industry Volume Share (%), by Product Type 2024 & 2032
- Figure 43: North America Anti-block Additives Industry Revenue (Billion), by Polymer Type 2024 & 2032
- Figure 44: North America Anti-block Additives Industry Volume (K Tons), by Polymer Type 2024 & 2032
- Figure 45: North America Anti-block Additives Industry Revenue Share (%), by Polymer Type 2024 & 2032
- Figure 46: North America Anti-block Additives Industry Volume Share (%), by Polymer Type 2024 & 2032
- Figure 47: North America Anti-block Additives Industry Revenue (Billion), by Application 2024 & 2032
- Figure 48: North America Anti-block Additives Industry Volume (K Tons), by Application 2024 & 2032
- Figure 49: North America Anti-block Additives Industry Revenue Share (%), by Application 2024 & 2032
- Figure 50: North America Anti-block Additives Industry Volume Share (%), by Application 2024 & 2032
- Figure 51: North America Anti-block Additives Industry Revenue (Billion), by Country 2024 & 2032
- Figure 52: North America Anti-block Additives Industry Volume (K Tons), by Country 2024 & 2032
- Figure 53: North America Anti-block Additives Industry Revenue Share (%), by Country 2024 & 2032
- Figure 54: North America Anti-block Additives Industry Volume Share (%), by Country 2024 & 2032
- Figure 55: Europe Anti-block Additives Industry Revenue (Billion), by Product Type 2024 & 2032
- Figure 56: Europe Anti-block Additives Industry Volume (K Tons), by Product Type 2024 & 2032
- Figure 57: Europe Anti-block Additives Industry Revenue Share (%), by Product Type 2024 & 2032
- Figure 58: Europe Anti-block Additives Industry Volume Share (%), by Product Type 2024 & 2032
- Figure 59: Europe Anti-block Additives Industry Revenue (Billion), by Polymer Type 2024 & 2032
- Figure 60: Europe Anti-block Additives Industry Volume (K Tons), by Polymer Type 2024 & 2032
- Figure 61: Europe Anti-block Additives Industry Revenue Share (%), by Polymer Type 2024 & 2032
- Figure 62: Europe Anti-block Additives Industry Volume Share (%), by Polymer Type 2024 & 2032
- Figure 63: Europe Anti-block Additives Industry Revenue (Billion), by Application 2024 & 2032
- Figure 64: Europe Anti-block Additives Industry Volume (K Tons), by Application 2024 & 2032
- Figure 65: Europe Anti-block Additives Industry Revenue Share (%), by Application 2024 & 2032
- Figure 66: Europe Anti-block Additives Industry Volume Share (%), by Application 2024 & 2032
- Figure 67: Europe Anti-block Additives Industry Revenue (Billion), by Country 2024 & 2032
- Figure 68: Europe Anti-block Additives Industry Volume (K Tons), by Country 2024 & 2032
- Figure 69: Europe Anti-block Additives Industry Revenue Share (%), by Country 2024 & 2032
- Figure 70: Europe Anti-block Additives Industry Volume Share (%), by Country 2024 & 2032
- Figure 71: South America Anti-block Additives Industry Revenue (Billion), by Product Type 2024 & 2032
- Figure 72: South America Anti-block Additives Industry Volume (K Tons), by Product Type 2024 & 2032
- Figure 73: South America Anti-block Additives Industry Revenue Share (%), by Product Type 2024 & 2032
- Figure 74: South America Anti-block Additives Industry Volume Share (%), by Product Type 2024 & 2032
- Figure 75: South America Anti-block Additives Industry Revenue (Billion), by Polymer Type 2024 & 2032
- Figure 76: South America Anti-block Additives Industry Volume (K Tons), by Polymer Type 2024 & 2032
- Figure 77: South America Anti-block Additives Industry Revenue Share (%), by Polymer Type 2024 & 2032
- Figure 78: South America Anti-block Additives Industry Volume Share (%), by Polymer Type 2024 & 2032
- Figure 79: South America Anti-block Additives Industry Revenue (Billion), by Application 2024 & 2032
- Figure 80: South America Anti-block Additives Industry Volume (K Tons), by Application 2024 & 2032
- Figure 81: South America Anti-block Additives Industry Revenue Share (%), by Application 2024 & 2032
- Figure 82: South America Anti-block Additives Industry Volume Share (%), by Application 2024 & 2032
- Figure 83: South America Anti-block Additives Industry Revenue (Billion), by Country 2024 & 2032
- Figure 84: South America Anti-block Additives Industry Volume (K Tons), by Country 2024 & 2032
- Figure 85: South America Anti-block Additives Industry Revenue Share (%), by Country 2024 & 2032
- Figure 86: South America Anti-block Additives Industry Volume Share (%), by Country 2024 & 2032
- Figure 87: Middle East and Africa Anti-block Additives Industry Revenue (Billion), by Product Type 2024 & 2032
- Figure 88: Middle East and Africa Anti-block Additives Industry Volume (K Tons), by Product Type 2024 & 2032
- Figure 89: Middle East and Africa Anti-block Additives Industry Revenue Share (%), by Product Type 2024 & 2032
- Figure 90: Middle East and Africa Anti-block Additives Industry Volume Share (%), by Product Type 2024 & 2032
- Figure 91: Middle East and Africa Anti-block Additives Industry Revenue (Billion), by Polymer Type 2024 & 2032
- Figure 92: Middle East and Africa Anti-block Additives Industry Volume (K Tons), by Polymer Type 2024 & 2032
- Figure 93: Middle East and Africa Anti-block Additives Industry Revenue Share (%), by Polymer Type 2024 & 2032
- Figure 94: Middle East and Africa Anti-block Additives Industry Volume Share (%), by Polymer Type 2024 & 2032
- Figure 95: Middle East and Africa Anti-block Additives Industry Revenue (Billion), by Application 2024 & 2032
- Figure 96: Middle East and Africa Anti-block Additives Industry Volume (K Tons), by Application 2024 & 2032
- Figure 97: Middle East and Africa Anti-block Additives Industry Revenue Share (%), by Application 2024 & 2032
- Figure 98: Middle East and Africa Anti-block Additives Industry Volume Share (%), by Application 2024 & 2032
- Figure 99: Middle East and Africa Anti-block Additives Industry Revenue (Billion), by Country 2024 & 2032
- Figure 100: Middle East and Africa Anti-block Additives Industry Volume (K Tons), by Country 2024 & 2032
- Figure 101: Middle East and Africa Anti-block Additives Industry Revenue Share (%), by Country 2024 & 2032
- Figure 102: Middle East and Africa Anti-block Additives Industry Volume Share (%), by Country 2024 & 2032
List of Tables
- Table 1: Global Anti-block Additives Industry Revenue Billion Forecast, by Region 2019 & 2032
- Table 2: Global Anti-block Additives Industry Volume K Tons Forecast, by Region 2019 & 2032
- Table 3: Global Anti-block Additives Industry Revenue Billion Forecast, by Product Type 2019 & 2032
- Table 4: Global Anti-block Additives Industry Volume K Tons Forecast, by Product Type 2019 & 2032
- Table 5: Global Anti-block Additives Industry Revenue Billion Forecast, by Polymer Type 2019 & 2032
- Table 6: Global Anti-block Additives Industry Volume K Tons Forecast, by Polymer Type 2019 & 2032
- Table 7: Global Anti-block Additives Industry Revenue Billion Forecast, by Application 2019 & 2032
- Table 8: Global Anti-block Additives Industry Volume K Tons Forecast, by Application 2019 & 2032
- Table 9: Global Anti-block Additives Industry Revenue Billion Forecast, by Region 2019 & 2032
- Table 10: Global Anti-block Additives Industry Volume K Tons Forecast, by Region 2019 & 2032
- Table 11: Global Anti-block Additives Industry Revenue Billion Forecast, by Country 2019 & 2032
- Table 12: Global Anti-block Additives Industry Volume K Tons Forecast, by Country 2019 & 2032
- Table 13: United States Anti-block Additives Industry Revenue (Billion) Forecast, by Application 2019 & 2032
- Table 14: United States Anti-block Additives Industry Volume (K Tons) Forecast, by Application 2019 & 2032
- Table 15: Canada Anti-block Additives Industry Revenue (Billion) Forecast, by Application 2019 & 2032
- Table 16: Canada Anti-block Additives Industry Volume (K Tons) Forecast, by Application 2019 & 2032
- Table 17: Mexico Anti-block Additives Industry Revenue (Billion) Forecast, by Application 2019 & 2032
- Table 18: Mexico Anti-block Additives Industry Volume (K Tons) Forecast, by Application 2019 & 2032
- Table 19: Global Anti-block Additives Industry Revenue Billion Forecast, by Country 2019 & 2032
- Table 20: Global Anti-block Additives Industry Volume K Tons Forecast, by Country 2019 & 2032
- Table 21: Germany Anti-block Additives Industry Revenue (Billion) Forecast, by Application 2019 & 2032
- Table 22: Germany Anti-block Additives Industry Volume (K Tons) Forecast, by Application 2019 & 2032
- Table 23: France Anti-block Additives Industry Revenue (Billion) Forecast, by Application 2019 & 2032
- Table 24: France Anti-block Additives Industry Volume (K Tons) Forecast, by Application 2019 & 2032
- Table 25: Italy Anti-block Additives Industry Revenue (Billion) Forecast, by Application 2019 & 2032
- Table 26: Italy Anti-block Additives Industry Volume (K Tons) Forecast, by Application 2019 & 2032
- Table 27: United Kingdom Anti-block Additives Industry Revenue (Billion) Forecast, by Application 2019 & 2032
- Table 28: United Kingdom Anti-block Additives Industry Volume (K Tons) Forecast, by Application 2019 & 2032
- Table 29: Netherlands Anti-block Additives Industry Revenue (Billion) Forecast, by Application 2019 & 2032
- Table 30: Netherlands Anti-block Additives Industry Volume (K Tons) Forecast, by Application 2019 & 2032
- Table 31: Rest of Europe Anti-block Additives Industry Revenue (Billion) Forecast, by Application 2019 & 2032
- Table 32: Rest of Europe Anti-block Additives Industry Volume (K Tons) Forecast, by Application 2019 & 2032
- Table 33: Global Anti-block Additives Industry Revenue Billion Forecast, by Country 2019 & 2032
- Table 34: Global Anti-block Additives Industry Volume K Tons Forecast, by Country 2019 & 2032
- Table 35: China Anti-block Additives Industry Revenue (Billion) Forecast, by Application 2019 & 2032
- Table 36: China Anti-block Additives Industry Volume (K Tons) Forecast, by Application 2019 & 2032
- Table 37: Japan Anti-block Additives Industry Revenue (Billion) Forecast, by Application 2019 & 2032
- Table 38: Japan Anti-block Additives Industry Volume (K Tons) Forecast, by Application 2019 & 2032
- Table 39: India Anti-block Additives Industry Revenue (Billion) Forecast, by Application 2019 & 2032
- Table 40: India Anti-block Additives Industry Volume (K Tons) Forecast, by Application 2019 & 2032
- Table 41: South Korea Anti-block Additives Industry Revenue (Billion) Forecast, by Application 2019 & 2032
- Table 42: South Korea Anti-block Additives Industry Volume (K Tons) Forecast, by Application 2019 & 2032
- Table 43: Taiwan Anti-block Additives Industry Revenue (Billion) Forecast, by Application 2019 & 2032
- Table 44: Taiwan Anti-block Additives Industry Volume (K Tons) Forecast, by Application 2019 & 2032
- Table 45: Australia Anti-block Additives Industry Revenue (Billion) Forecast, by Application 2019 & 2032
- Table 46: Australia Anti-block Additives Industry Volume (K Tons) Forecast, by Application 2019 & 2032
- Table 47: Rest of Asia-Pacific Anti-block Additives Industry Revenue (Billion) Forecast, by Application 2019 & 2032
- Table 48: Rest of Asia-Pacific Anti-block Additives Industry Volume (K Tons) Forecast, by Application 2019 & 2032
- Table 49: Global Anti-block Additives Industry Revenue Billion Forecast, by Country 2019 & 2032
- Table 50: Global Anti-block Additives Industry Volume K Tons Forecast, by Country 2019 & 2032
- Table 51: Brazil Anti-block Additives Industry Revenue (Billion) Forecast, by Application 2019 & 2032
- Table 52: Brazil Anti-block Additives Industry Volume (K Tons) Forecast, by Application 2019 & 2032
- Table 53: Argentina Anti-block Additives Industry Revenue (Billion) Forecast, by Application 2019 & 2032
- Table 54: Argentina Anti-block Additives Industry Volume (K Tons) Forecast, by Application 2019 & 2032
- Table 55: Rest of South America Anti-block Additives Industry Revenue (Billion) Forecast, by Application 2019 & 2032
- Table 56: Rest of South America Anti-block Additives Industry Volume (K Tons) Forecast, by Application 2019 & 2032
- Table 57: Global Anti-block Additives Industry Revenue Billion Forecast, by Country 2019 & 2032
- Table 58: Global Anti-block Additives Industry Volume K Tons Forecast, by Country 2019 & 2032
- Table 59: Middle East Anti-block Additives Industry Revenue (Billion) Forecast, by Application 2019 & 2032
- Table 60: Middle East Anti-block Additives Industry Volume (K Tons) Forecast, by Application 2019 & 2032
- Table 61: Africa Anti-block Additives Industry Revenue (Billion) Forecast, by Application 2019 & 2032
- Table 62: Africa Anti-block Additives Industry Volume (K Tons) Forecast, by Application 2019 & 2032
- Table 63: Global Anti-block Additives Industry Revenue Billion Forecast, by Product Type 2019 & 2032
- Table 64: Global Anti-block Additives Industry Volume K Tons Forecast, by Product Type 2019 & 2032
- Table 65: Global Anti-block Additives Industry Revenue Billion Forecast, by Polymer Type 2019 & 2032
- Table 66: Global Anti-block Additives Industry Volume K Tons Forecast, by Polymer Type 2019 & 2032
- Table 67: Global Anti-block Additives Industry Revenue Billion Forecast, by Application 2019 & 2032
- Table 68: Global Anti-block Additives Industry Volume K Tons Forecast, by Application 2019 & 2032
- Table 69: Global Anti-block Additives Industry Revenue Billion Forecast, by Country 2019 & 2032
- Table 70: Global Anti-block Additives Industry Volume K Tons Forecast, by Country 2019 & 2032
- Table 71: China Anti-block Additives Industry Revenue (Billion) Forecast, by Application 2019 & 2032
- Table 72: China Anti-block Additives Industry Volume (K Tons) Forecast, by Application 2019 & 2032
- Table 73: India Anti-block Additives Industry Revenue (Billion) Forecast, by Application 2019 & 2032
- Table 74: India Anti-block Additives Industry Volume (K Tons) Forecast, by Application 2019 & 2032
- Table 75: Japan Anti-block Additives Industry Revenue (Billion) Forecast, by Application 2019 & 2032
- Table 76: Japan Anti-block Additives Industry Volume (K Tons) Forecast, by Application 2019 & 2032
- Table 77: South Korea Anti-block Additives Industry Revenue (Billion) Forecast, by Application 2019 & 2032
- Table 78: South Korea Anti-block Additives Industry Volume (K Tons) Forecast, by Application 2019 & 2032
- Table 79: Rest of Asia Pacific Anti-block Additives Industry Revenue (Billion) Forecast, by Application 2019 & 2032
- Table 80: Rest of Asia Pacific Anti-block Additives Industry Volume (K Tons) Forecast, by Application 2019 & 2032
- Table 81: Global Anti-block Additives Industry Revenue Billion Forecast, by Product Type 2019 & 2032
- Table 82: Global Anti-block Additives Industry Volume K Tons Forecast, by Product Type 2019 & 2032
- Table 83: Global Anti-block Additives Industry Revenue Billion Forecast, by Polymer Type 2019 & 2032
- Table 84: Global Anti-block Additives Industry Volume K Tons Forecast, by Polymer Type 2019 & 2032
- Table 85: Global Anti-block Additives Industry Revenue Billion Forecast, by Application 2019 & 2032
- Table 86: Global Anti-block Additives Industry Volume K Tons Forecast, by Application 2019 & 2032
- Table 87: Global Anti-block Additives Industry Revenue Billion Forecast, by Country 2019 & 2032
- Table 88: Global Anti-block Additives Industry Volume K Tons Forecast, by Country 2019 & 2032
- Table 89: United States Anti-block Additives Industry Revenue (Billion) Forecast, by Application 2019 & 2032
- Table 90: United States Anti-block Additives Industry Volume (K Tons) Forecast, by Application 2019 & 2032
- Table 91: Canada Anti-block Additives Industry Revenue (Billion) Forecast, by Application 2019 & 2032
- Table 92: Canada Anti-block Additives Industry Volume (K Tons) Forecast, by Application 2019 & 2032
- Table 93: Mexico Anti-block Additives Industry Revenue (Billion) Forecast, by Application 2019 & 2032
- Table 94: Mexico Anti-block Additives Industry Volume (K Tons) Forecast, by Application 2019 & 2032
- Table 95: Global Anti-block Additives Industry Revenue Billion Forecast, by Product Type 2019 & 2032
- Table 96: Global Anti-block Additives Industry Volume K Tons Forecast, by Product Type 2019 & 2032
- Table 97: Global Anti-block Additives Industry Revenue Billion Forecast, by Polymer Type 2019 & 2032
- Table 98: Global Anti-block Additives Industry Volume K Tons Forecast, by Polymer Type 2019 & 2032
- Table 99: Global Anti-block Additives Industry Revenue Billion Forecast, by Application 2019 & 2032
- Table 100: Global Anti-block Additives Industry Volume K Tons Forecast, by Application 2019 & 2032
- Table 101: Global Anti-block Additives Industry Revenue Billion Forecast, by Country 2019 & 2032
- Table 102: Global Anti-block Additives Industry Volume K Tons Forecast, by Country 2019 & 2032
- Table 103: Germany Anti-block Additives Industry Revenue (Billion) Forecast, by Application 2019 & 2032
- Table 104: Germany Anti-block Additives Industry Volume (K Tons) Forecast, by Application 2019 & 2032
- Table 105: United Kingdom Anti-block Additives Industry Revenue (Billion) Forecast, by Application 2019 & 2032
- Table 106: United Kingdom Anti-block Additives Industry Volume (K Tons) Forecast, by Application 2019 & 2032
- Table 107: France Anti-block Additives Industry Revenue (Billion) Forecast, by Application 2019 & 2032
- Table 108: France Anti-block Additives Industry Volume (K Tons) Forecast, by Application 2019 & 2032
- Table 109: Italy Anti-block Additives Industry Revenue (Billion) Forecast, by Application 2019 & 2032
- Table 110: Italy Anti-block Additives Industry Volume (K Tons) Forecast, by Application 2019 & 2032
- Table 111: Rest of Europe Anti-block Additives Industry Revenue (Billion) Forecast, by Application 2019 & 2032
- Table 112: Rest of Europe Anti-block Additives Industry Volume (K Tons) Forecast, by Application 2019 & 2032
- Table 113: Global Anti-block Additives Industry Revenue Billion Forecast, by Product Type 2019 & 2032
- Table 114: Global Anti-block Additives Industry Volume K Tons Forecast, by Product Type 2019 & 2032
- Table 115: Global Anti-block Additives Industry Revenue Billion Forecast, by Polymer Type 2019 & 2032
- Table 116: Global Anti-block Additives Industry Volume K Tons Forecast, by Polymer Type 2019 & 2032
- Table 117: Global Anti-block Additives Industry Revenue Billion Forecast, by Application 2019 & 2032
- Table 118: Global Anti-block Additives Industry Volume K Tons Forecast, by Application 2019 & 2032
- Table 119: Global Anti-block Additives Industry Revenue Billion Forecast, by Country 2019 & 2032
- Table 120: Global Anti-block Additives Industry Volume K Tons Forecast, by Country 2019 & 2032
- Table 121: Brazil Anti-block Additives Industry Revenue (Billion) Forecast, by Application 2019 & 2032
- Table 122: Brazil Anti-block Additives Industry Volume (K Tons) Forecast, by Application 2019 & 2032
- Table 123: Argentina Anti-block Additives Industry Revenue (Billion) Forecast, by Application 2019 & 2032
- Table 124: Argentina Anti-block Additives Industry Volume (K Tons) Forecast, by Application 2019 & 2032
- Table 125: Rest of South America Anti-block Additives Industry Revenue (Billion) Forecast, by Application 2019 & 2032
- Table 126: Rest of South America Anti-block Additives Industry Volume (K Tons) Forecast, by Application 2019 & 2032
- Table 127: Global Anti-block Additives Industry Revenue Billion Forecast, by Product Type 2019 & 2032
- Table 128: Global Anti-block Additives Industry Volume K Tons Forecast, by Product Type 2019 & 2032
- Table 129: Global Anti-block Additives Industry Revenue Billion Forecast, by Polymer Type 2019 & 2032
- Table 130: Global Anti-block Additives Industry Volume K Tons Forecast, by Polymer Type 2019 & 2032
- Table 131: Global Anti-block Additives Industry Revenue Billion Forecast, by Application 2019 & 2032
- Table 132: Global Anti-block Additives Industry Volume K Tons Forecast, by Application 2019 & 2032
- Table 133: Global Anti-block Additives Industry Revenue Billion Forecast, by Country 2019 & 2032
- Table 134: Global Anti-block Additives Industry Volume K Tons Forecast, by Country 2019 & 2032
- Table 135: Saudi Arabia Anti-block Additives Industry Revenue (Billion) Forecast, by Application 2019 & 2032
- Table 136: Saudi Arabia Anti-block Additives Industry Volume (K Tons) Forecast, by Application 2019 & 2032
- Table 137: South Africa Anti-block Additives Industry Revenue (Billion) Forecast, by Application 2019 & 2032
- Table 138: South Africa Anti-block Additives Industry Volume (K Tons) Forecast, by Application 2019 & 2032
- Table 139: Rest of Middle East and Africa Anti-block Additives Industry Revenue (Billion) Forecast, by Application 2019 & 2032
- Table 140: Rest of Middle East and Africa Anti-block Additives Industry Volume (K Tons) Forecast, by Application 2019 & 2032
Frequently Asked Questions
1. What is the projected Compound Annual Growth Rate (CAGR) of the Anti-block Additives Industry?
The projected CAGR is approximately 5.6%.
2. Which companies are prominent players in the Anti-block Additives Industry?
Key companies in the market include BYK, Honeywell International Inc, PolyOne, Evonik Industries AG, Croda International PLC, Tosaf Benelux, Momentive, W R Grace & Co -Conn, Imerys Performance Additives, Plastics Color Corporation, Ampacet Corporation, A Schulman Inc (LyondellBasell).
3. What are the main segments of the Anti-block Additives Industry?
The market segments include Product Type, Polymer Type, Application.
4. Can you provide details about the market size?
The market size is estimated to be USD 1.6 Billion as of 2022.
5. What are some drivers contributing to market growth?
; Growing Food Packaging Sector; Rising Demand for Greenhouse Protected Cultivation.
6. What are the notable trends driving market growth?
The Food Packaging Sector to Dominate the Market.
7. Are there any restraints impacting market growth?
; Negative Affect on the Optical Properties of Plastic Film; Unfavorable Conditions Arising Due to COVID-19 Outbreak.
8. Can you provide examples of recent developments in the market?
N/A
9. What pricing options are available for accessing the report?
Pricing options include single-user, multi-user, and enterprise licenses priced at USD 4750, USD 5250, and USD 8750 respectively.
10. Is the market size provided in terms of value or volume?
The market size is provided in terms of value, measured in Billion and volume, measured in K Tons.
11. Are there any specific market keywords associated with the report?
Yes, the market keyword associated with the report is "Anti-block Additives Industry," which aids in identifying and referencing the specific market segment covered.
12. How do I determine which pricing option suits my needs best?
The pricing options vary based on user requirements and access needs. Individual users may opt for single-user licenses, while businesses requiring broader access may choose multi-user or enterprise licenses for cost-effective access to the report.
13. Are there any additional resources or data provided in the Anti-block Additives Industry report?
While the report offers comprehensive insights, it's advisable to review the specific contents or supplementary materials provided to ascertain if additional resources or data are available.
14. How can I stay updated on further developments or reports in the Anti-block Additives Industry?
To stay informed about further developments, trends, and reports in the Anti-block Additives Industry, consider subscribing to industry newsletters, following relevant companies and organizations, or regularly checking reputable industry news sources and publications.
Methodology
Step 1 - Identification of Relevant Samples Size from Population Database


Step 2 - Approaches for Defining Global Market Size (Value, Volume* & Price*)

Note*: In applicable scenarios
Step 3 - Data Sources
Primary Research
- Web Analytics
- Survey Reports
- Research Institute
- Latest Research Reports
- Opinion Leaders
Secondary Research
- Annual Reports
- White Paper
- Latest Press Release
- Industry Association
- Paid Database
- Investor Presentations

Step 4 - Data Triangulation
Involves using different sources of information in order to increase the validity of a study
These sources are likely to be stakeholders in a program - participants, other researchers, program staff, other community members, and so on.
Then we put all data in single framework & apply various statistical tools to find out the dynamic on the market.
During the analysis stage, feedback from the stakeholder groups would be compared to determine areas of agreement as well as areas of divergence


