
Key Insights
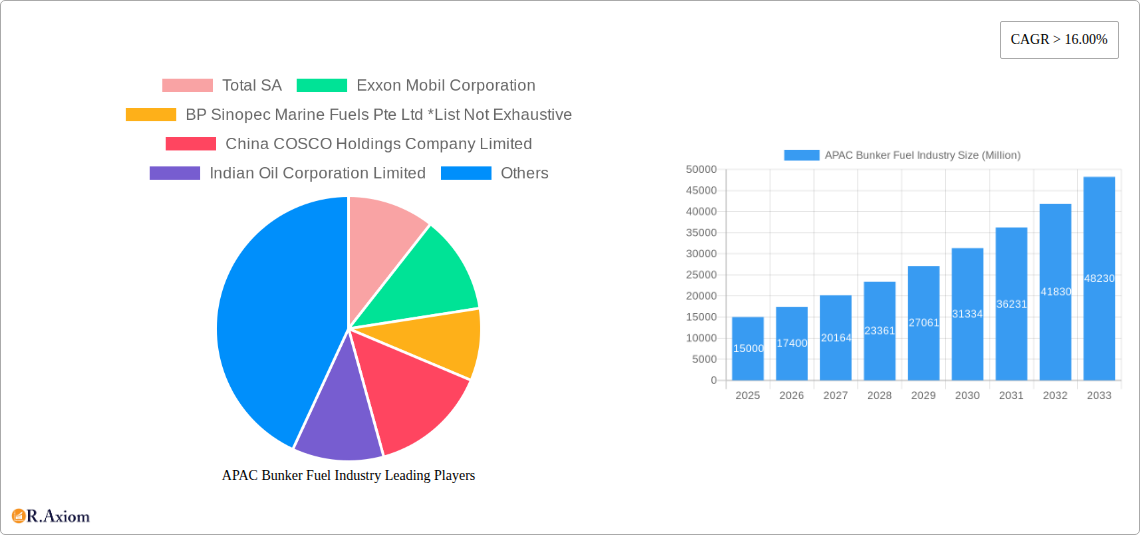
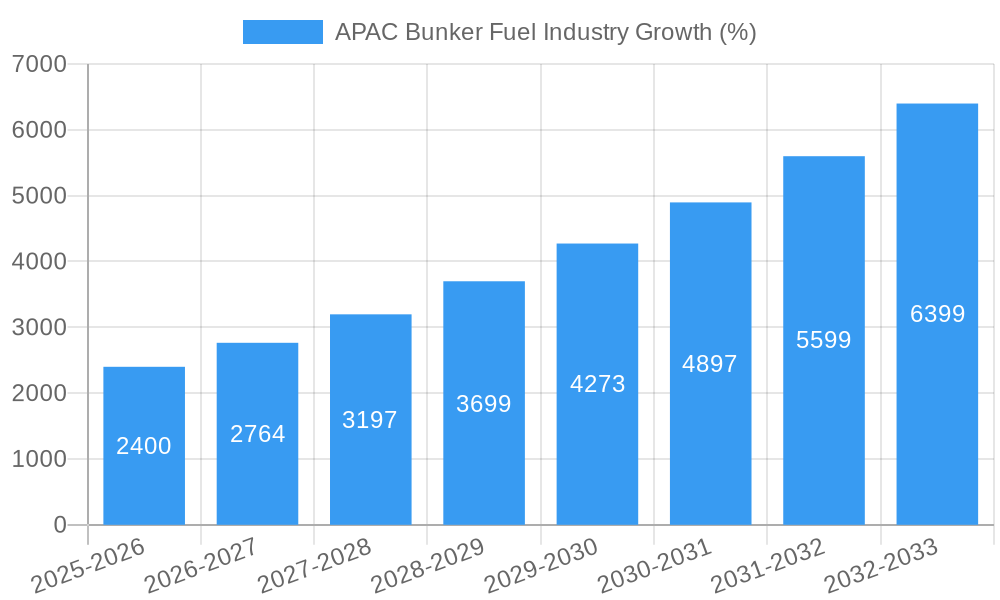
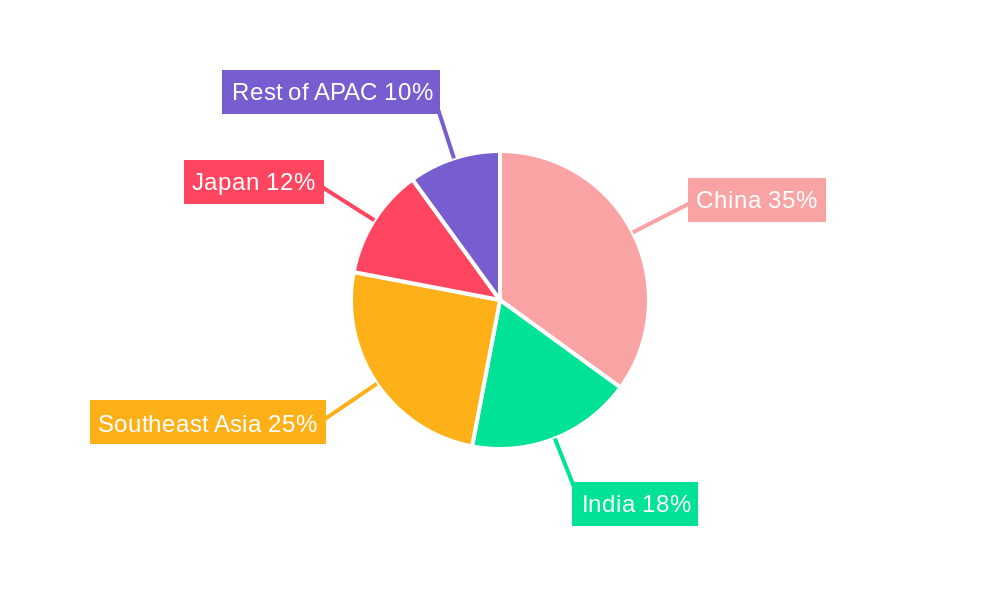
The Asia-Pacific (APAC) bunker fuel market is experiencing robust growth, driven by the region's expanding maritime trade and increasing demand for efficient and environmentally friendly fuels. The market's Compound Annual Growth Rate (CAGR) exceeding 16% signifies a significant upward trajectory, projected to continue through 2033. This growth is fueled by several factors: the rapid expansion of container shipping, particularly in China, India, and Southeast Asia; the rising energy demands of burgeoning economies within the region; and the increasing adoption of liquefied natural gas (LNG) as a cleaner alternative to traditional high-sulfur fuel oils. However, the market also faces challenges, including fluctuating oil prices, stringent environmental regulations aimed at reducing sulfur emissions, and geopolitical uncertainties impacting global trade routes. The segmentation within the APAC market reveals a strong demand for Very-Low Sulfur Fuel Oil (VLSFO) due to international maritime regulations, while LNG adoption, although growing, is still in its relatively early stages. Major players like Total SA, ExxonMobil, and BP are actively competing to capture market share, investing in infrastructure and supply chain optimization to meet this rising demand. Furthermore, the diverse vessel types operating within the region – from containerships to tankers and bulk carriers – contribute to a complex yet dynamic market landscape.
The competitive landscape in the APAC bunker fuel market is intensely competitive, with both global and regional players vying for dominance. Established international oil companies possess strong brand recognition and established distribution networks, giving them a significant advantage. However, regional players are actively investing in infrastructure and logistics to capitalize on the increasing demand. The strategic partnerships, mergers, and acquisitions observed within the industry further highlight the dynamic nature of the market. Future growth will be influenced by the adoption of alternative fuels, the effectiveness of emission reduction policies, and the overall health of the global economy. The APAC region’s economic growth and its pivotal role in global trade suggest a consistently positive outlook for the bunker fuel market in the coming years, despite the inherent challenges and fluctuations within the industry.
This in-depth report provides a comprehensive analysis of the Asia-Pacific (APAC) bunker fuel industry, covering market size, growth drivers, challenges, and opportunities from 2019 to 2033. The study encompasses key segments, leading players, and emerging trends, offering actionable insights for stakeholders across the value chain. With a focus on the forecast period (2025-2033), base year (2025), and historical period (2019-2024), this report is an essential resource for strategic decision-making.
APAC Bunker Fuel Industry Market Concentration & Innovation
This section analyzes the competitive landscape of the APAC bunker fuel industry, examining market concentration, innovation drivers, regulatory frameworks, product substitutes, end-user trends, and mergers and acquisitions (M&A) activities. The report quantifies market share held by key players such as Total SA, Exxon Mobil Corporation, BP Sinopec Marine Fuels Pte Ltd, China COSCO Holdings Company Limited, Indian Oil Corporation Limited, Royal Dutch Shell PLC, Ocean Network Express PTE Ltd, and Chimbusco Pan Nation Petro-Chemical Co Ltd (list not exhaustive). The analysis includes:
- Market Share Distribution: A detailed breakdown of market share among major players, revealing the degree of concentration and the presence of any dominant firms. For example, Total SA may hold xx% market share in 2025, while Exxon Mobil Corporation holds xx%.
- Innovation Drivers: An assessment of technological advancements, environmental regulations, and evolving consumer preferences driving innovation within the industry. This includes advancements in fuel types (e.g., LNG) and fuel efficiency technologies.
- Regulatory Landscape: A review of existing and upcoming regulations impacting the industry, including emission control areas (ECAs) and sulfur cap regulations, and their effect on market dynamics.
- Product Substitutes: An analysis of alternative fuels and their potential impact on the demand for traditional bunker fuels.
- End-User Trends: An examination of shifting demands from different vessel types (containers, tankers, etc.) and their impact on fuel consumption patterns.
- M&A Activity: An overview of significant M&A deals in the APAC bunker fuel industry during the study period, including deal values and their strategic implications (e.g., estimated total M&A deal value of xx Million in the period 2019-2024).
APAC Bunker Fuel Industry Industry Trends & Insights
This section delves into the key trends shaping the APAC bunker fuel market, including market growth drivers, technological disruptions, consumer preferences, and competitive dynamics. The report projects a Compound Annual Growth Rate (CAGR) of xx% for the forecast period (2025-2033), driven by factors such as:
- Growth in global trade and shipping activities across the APAC region.
- Increased demand for cleaner-burning fuels due to stringent environmental regulations.
- Technological advancements in fuel efficiency and alternative fuels.
- Expansion of LNG bunkering infrastructure in major ports.
- Market penetration of VLSFO exceeding xx% by 2033.
The analysis will also consider the impact of geopolitical factors, economic fluctuations, and evolving consumer behavior on the market's trajectory.
Dominant Markets & Segments in APAC Bunker Fuel Industry
This section identifies the leading regions, countries, and segments within the APAC bunker fuel market. The analysis covers fuel types (High Sulfur Fuel Oil (HSFO), Very-Low Sulfur Fuel Oil (VLSFO), Marine Gas Oil (MGO), Liquefied Natural Gas (LNG), Others) and vessel types (Containers, Tankers, General Cargo, Bulk Carrier, Others). Dominance analysis will include:
Leading Regions/Countries: Identifying the regions and countries with the highest bunker fuel consumption and market value (e.g., China, Singapore, India).
Fuel Type Segmentation: Detailed analysis of market size and growth projections for each fuel type, highlighting factors driving demand (e.g., price competitiveness of HSFO vs. VLSFO).
Vessel Type Segmentation: Analysis of bunker fuel consumption patterns across different vessel types and identifying high-growth segments.
Key Drivers:
- Economic Policies: Impact of government policies on shipping and trade.
- Infrastructure Development: Expansion of port infrastructure and bunkering facilities.
- Geopolitical Factors: Impact of regional conflicts and trade disputes.
APAC Bunker Fuel Industry Product Developments
This section summarizes recent product innovations, applications, and competitive advantages in the APAC bunker fuel industry. The focus will be on technological advancements, such as the development of alternative fuels (LNG, biofuels) and fuel efficiency technologies, and their impact on market competition and adoption rates. The analysis will highlight the increasing adoption of cleaner fuels and the resulting shift in market dynamics.
Report Scope & Segmentation Analysis
This report segments the APAC bunker fuel market by fuel type (HSFO, VLSFO, MGO, LNG, Others) and vessel type (Containers, Tankers, General Cargo, Bulk Carriers, Others). Each segment's analysis includes market size, growth projections, and competitive dynamics. For example, the VLSFO segment is projected to witness significant growth due to stricter environmental regulations. The tanker segment is expected to dominate in terms of bunker fuel consumption, followed by the container segment.
Key Drivers of APAC Bunker Fuel Industry Growth
The growth of the APAC bunker fuel industry is driven by several key factors including:
- The increasing volume of global trade and maritime transport in the APAC region.
- The expansion of port infrastructure and bunkering facilities.
- The implementation of stricter environmental regulations promoting the use of cleaner fuels.
- Technological advancements in fuel efficiency and alternative fuel technologies.
Challenges in the APAC Bunker Fuel Industry Sector
The APAC bunker fuel industry faces challenges including:
- Fluctuations in crude oil prices and their impact on bunker fuel costs.
- Stringent environmental regulations requiring significant investments in cleaner fuel infrastructure.
- Supply chain disruptions and geopolitical instability affecting fuel availability and price.
- Increased competition among bunker fuel suppliers.
Emerging Opportunities in APAC Bunker Fuel Industry
The APAC bunker fuel industry presents various opportunities, including:
- Growth in demand for LNG and other alternative fuels.
- Development of innovative bunkering technologies and solutions.
- Expansion of bunkering infrastructure in emerging markets.
- Growing adoption of digital solutions for optimizing bunker fuel management.
Leading Players in the APAC Bunker Fuel Industry Market
- TotalEnergies SE
- Exxon Mobil Corporation
- BP (Note: BP Sinopec Marine Fuels Pte Ltd is a joint venture)
- China COSCO Holdings Company Limited
- Indian Oil Corporation Limited
- Royal Dutch Shell PLC
- Ocean Network Express PTE Ltd
- Chimbusco Pan Nation Petro-Chemical Co Ltd
Key Developments in APAC Bunker Fuel Industry Industry
- 2022 Q4: Increased investments in LNG bunkering infrastructure by major players.
- 2023 Q1: Introduction of new sulfur cap regulations in several APAC ports.
- 2023 Q2: Launch of a new biofuel blend by a major bunker fuel supplier.
- (Further developments to be added based on data)
Strategic Outlook for APAC Bunker Fuel Industry Market
The APAC bunker fuel market is poised for continued growth, driven by increasing shipping activity and the adoption of cleaner fuels. Opportunities exist for companies to invest in new technologies, expand bunkering infrastructure, and develop innovative fuel solutions to meet evolving market demands and environmental regulations. The market's future trajectory will be influenced by global economic conditions, geopolitical factors, and the pace of technological innovation.
APAC Bunker Fuel Industry Segmentation
-
1. Fuel Type
- 1.1. High Sulfur Fuel Oil (HSFO)
- 1.2. Very-Low Sulfur Fuel Oil (VLSFO)
- 1.3. Marine Gas Oil (MGO)
- 1.4. Liquefied Natural Gas (MGO)
- 1.5. Others
-
2. Vessel Type
- 2.1. Containers
- 2.2. Tankers
- 2.3. General Cargo
- 2.4. Bulk Carrier
- 2.5. Others
-
3. Geography
- 3.1. China
- 3.2. India
- 3.3. Singapore
- 3.4. Rest of Asia-Pacific
APAC Bunker Fuel Industry Segmentation By Geography
- 1. China
- 2. India
- 3. Singapore
- 4. Rest of Asia Pacific
APAC Bunker Fuel Industry REPORT HIGHLIGHTS
| Aspects | Details |
|---|---|
| Study Period | 2019-2033 |
| Base Year | 2024 |
| Estimated Year | 2025 |
| Forecast Period | 2025-2033 |
| Historical Period | 2019-2024 |
| Growth Rate | CAGR of > 16.00% from 2019-2033 |
| Segmentation |
|
Table of Contents
- 1. Introduction
- 1.1. Research Scope
- 1.2. Market Segmentation
- 1.3. Research Methodology
- 1.4. Definitions and Assumptions
- 2. Executive Summary
- 2.1. Introduction
- 3. Market Dynamics
- 3.1. Introduction
- 3.2. Market Drivers
- 3.2.1. Increasing Demand for Oil and Gas4.; Presence of Proven Oil and Gas Reserves
- 3.3. Market Restrains
- 3.3.1. Volatile Oil and Gas Prices
- 3.4. Market Trends
- 3.4.1. VLSFO to Witness Significant Growth
- 4. Market Factor Analysis
- 4.1. Porters Five Forces
- 4.2. Supply/Value Chain
- 4.3. PESTEL analysis
- 4.4. Market Entropy
- 4.5. Patent/Trademark Analysis
- 5. Global APAC Bunker Fuel Industry Analysis, Insights and Forecast, 2019-2031
- 5.1. Market Analysis, Insights and Forecast - by Fuel Type
- 5.1.1. High Sulfur Fuel Oil (HSFO)
- 5.1.2. Very-Low Sulfur Fuel Oil (VLSFO)
- 5.1.3. Marine Gas Oil (MGO)
- 5.1.4. Liquefied Natural Gas (MGO)
- 5.1.5. Others
- 5.2. Market Analysis, Insights and Forecast - by Vessel Type
- 5.2.1. Containers
- 5.2.2. Tankers
- 5.2.3. General Cargo
- 5.2.4. Bulk Carrier
- 5.2.5. Others
- 5.3. Market Analysis, Insights and Forecast - by Geography
- 5.3.1. China
- 5.3.2. India
- 5.3.3. Singapore
- 5.3.4. Rest of Asia-Pacific
- 5.4. Market Analysis, Insights and Forecast - by Region
- 5.4.1. China
- 5.4.2. India
- 5.4.3. Singapore
- 5.4.4. Rest of Asia Pacific
- 5.1. Market Analysis, Insights and Forecast - by Fuel Type
- 6. China APAC Bunker Fuel Industry Analysis, Insights and Forecast, 2019-2031
- 6.1. Market Analysis, Insights and Forecast - by Fuel Type
- 6.1.1. High Sulfur Fuel Oil (HSFO)
- 6.1.2. Very-Low Sulfur Fuel Oil (VLSFO)
- 6.1.3. Marine Gas Oil (MGO)
- 6.1.4. Liquefied Natural Gas (MGO)
- 6.1.5. Others
- 6.2. Market Analysis, Insights and Forecast - by Vessel Type
- 6.2.1. Containers
- 6.2.2. Tankers
- 6.2.3. General Cargo
- 6.2.4. Bulk Carrier
- 6.2.5. Others
- 6.3. Market Analysis, Insights and Forecast - by Geography
- 6.3.1. China
- 6.3.2. India
- 6.3.3. Singapore
- 6.3.4. Rest of Asia-Pacific
- 6.1. Market Analysis, Insights and Forecast - by Fuel Type
- 7. India APAC Bunker Fuel Industry Analysis, Insights and Forecast, 2019-2031
- 7.1. Market Analysis, Insights and Forecast - by Fuel Type
- 7.1.1. High Sulfur Fuel Oil (HSFO)
- 7.1.2. Very-Low Sulfur Fuel Oil (VLSFO)
- 7.1.3. Marine Gas Oil (MGO)
- 7.1.4. Liquefied Natural Gas (MGO)
- 7.1.5. Others
- 7.2. Market Analysis, Insights and Forecast - by Vessel Type
- 7.2.1. Containers
- 7.2.2. Tankers
- 7.2.3. General Cargo
- 7.2.4. Bulk Carrier
- 7.2.5. Others
- 7.3. Market Analysis, Insights and Forecast - by Geography
- 7.3.1. China
- 7.3.2. India
- 7.3.3. Singapore
- 7.3.4. Rest of Asia-Pacific
- 7.1. Market Analysis, Insights and Forecast - by Fuel Type
- 8. Singapore APAC Bunker Fuel Industry Analysis, Insights and Forecast, 2019-2031
- 8.1. Market Analysis, Insights and Forecast - by Fuel Type
- 8.1.1. High Sulfur Fuel Oil (HSFO)
- 8.1.2. Very-Low Sulfur Fuel Oil (VLSFO)
- 8.1.3. Marine Gas Oil (MGO)
- 8.1.4. Liquefied Natural Gas (MGO)
- 8.1.5. Others
- 8.2. Market Analysis, Insights and Forecast - by Vessel Type
- 8.2.1. Containers
- 8.2.2. Tankers
- 8.2.3. General Cargo
- 8.2.4. Bulk Carrier
- 8.2.5. Others
- 8.3. Market Analysis, Insights and Forecast - by Geography
- 8.3.1. China
- 8.3.2. India
- 8.3.3. Singapore
- 8.3.4. Rest of Asia-Pacific
- 8.1. Market Analysis, Insights and Forecast - by Fuel Type
- 9. Rest of Asia Pacific APAC Bunker Fuel Industry Analysis, Insights and Forecast, 2019-2031
- 9.1. Market Analysis, Insights and Forecast - by Fuel Type
- 9.1.1. High Sulfur Fuel Oil (HSFO)
- 9.1.2. Very-Low Sulfur Fuel Oil (VLSFO)
- 9.1.3. Marine Gas Oil (MGO)
- 9.1.4. Liquefied Natural Gas (MGO)
- 9.1.5. Others
- 9.2. Market Analysis, Insights and Forecast - by Vessel Type
- 9.2.1. Containers
- 9.2.2. Tankers
- 9.2.3. General Cargo
- 9.2.4. Bulk Carrier
- 9.2.5. Others
- 9.3. Market Analysis, Insights and Forecast - by Geography
- 9.3.1. China
- 9.3.2. India
- 9.3.3. Singapore
- 9.3.4. Rest of Asia-Pacific
- 9.1. Market Analysis, Insights and Forecast - by Fuel Type
- 10. North America APAC Bunker Fuel Industry Analysis, Insights and Forecast, 2019-2031
- 10.1. Market Analysis, Insights and Forecast - By Country/Sub-region
- 10.1.1 United States
- 10.1.2 Canada
- 10.1.3 Mexico
- 11. Europe APAC Bunker Fuel Industry Analysis, Insights and Forecast, 2019-2031
- 11.1. Market Analysis, Insights and Forecast - By Country/Sub-region
- 11.1.1 Germany
- 11.1.2 United Kingdom
- 11.1.3 France
- 11.1.4 Spain
- 11.1.5 Italy
- 11.1.6 Spain
- 11.1.7 Belgium
- 11.1.8 Netherland
- 11.1.9 Nordics
- 11.1.10 Rest of Europe
- 12. Asia Pacific APAC Bunker Fuel Industry Analysis, Insights and Forecast, 2019-2031
- 12.1. Market Analysis, Insights and Forecast - By Country/Sub-region
- 12.1.1 China
- 12.1.2 Japan
- 12.1.3 India
- 12.1.4 South Korea
- 12.1.5 Southeast Asia
- 12.1.6 Australia
- 12.1.7 Indonesia
- 12.1.8 Phillipes
- 12.1.9 Singapore
- 12.1.10 Thailandc
- 12.1.11 Rest of Asia Pacific
- 13. South America APAC Bunker Fuel Industry Analysis, Insights and Forecast, 2019-2031
- 13.1. Market Analysis, Insights and Forecast - By Country/Sub-region
- 13.1.1 Brazil
- 13.1.2 Argentina
- 13.1.3 Peru
- 13.1.4 Chile
- 13.1.5 Colombia
- 13.1.6 Ecuador
- 13.1.7 Venezuela
- 13.1.8 Rest of South America
- 14. North America APAC Bunker Fuel Industry Analysis, Insights and Forecast, 2019-2031
- 14.1. Market Analysis, Insights and Forecast - By Country/Sub-region
- 14.1.1 United States
- 14.1.2 Canada
- 14.1.3 Mexico
- 15. MEA APAC Bunker Fuel Industry Analysis, Insights and Forecast, 2019-2031
- 15.1. Market Analysis, Insights and Forecast - By Country/Sub-region
- 15.1.1 United Arab Emirates
- 15.1.2 Saudi Arabia
- 15.1.3 South Africa
- 15.1.4 Rest of Middle East and Africa
- 16. Competitive Analysis
- 16.1. Global Market Share Analysis 2024
- 16.2. Company Profiles
- 16.2.1 Total SA
- 16.2.1.1. Overview
- 16.2.1.2. Products
- 16.2.1.3. SWOT Analysis
- 16.2.1.4. Recent Developments
- 16.2.1.5. Financials (Based on Availability)
- 16.2.2 Exxon Mobil Corporation
- 16.2.2.1. Overview
- 16.2.2.2. Products
- 16.2.2.3. SWOT Analysis
- 16.2.2.4. Recent Developments
- 16.2.2.5. Financials (Based on Availability)
- 16.2.3 BP Sinopec Marine Fuels Pte Ltd *List Not Exhaustive
- 16.2.3.1. Overview
- 16.2.3.2. Products
- 16.2.3.3. SWOT Analysis
- 16.2.3.4. Recent Developments
- 16.2.3.5. Financials (Based on Availability)
- 16.2.4 China COSCO Holdings Company Limited
- 16.2.4.1. Overview
- 16.2.4.2. Products
- 16.2.4.3. SWOT Analysis
- 16.2.4.4. Recent Developments
- 16.2.4.5. Financials (Based on Availability)
- 16.2.5 Indian Oil Corporation Limited
- 16.2.5.1. Overview
- 16.2.5.2. Products
- 16.2.5.3. SWOT Analysis
- 16.2.5.4. Recent Developments
- 16.2.5.5. Financials (Based on Availability)
- 16.2.6 Royal Dutch Shell PLC
- 16.2.6.1. Overview
- 16.2.6.2. Products
- 16.2.6.3. SWOT Analysis
- 16.2.6.4. Recent Developments
- 16.2.6.5. Financials (Based on Availability)
- 16.2.7 Ocean Network Express PTE Ltd
- 16.2.7.1. Overview
- 16.2.7.2. Products
- 16.2.7.3. SWOT Analysis
- 16.2.7.4. Recent Developments
- 16.2.7.5. Financials (Based on Availability)
- 16.2.8 Chimbusco Pan Nation Petro-Chemical Co Ltd
- 16.2.8.1. Overview
- 16.2.8.2. Products
- 16.2.8.3. SWOT Analysis
- 16.2.8.4. Recent Developments
- 16.2.8.5. Financials (Based on Availability)
- 16.2.1 Total SA
List of Figures
- Figure 1: Global APAC Bunker Fuel Industry Revenue Breakdown (Million, %) by Region 2024 & 2032
- Figure 2: North America APAC Bunker Fuel Industry Revenue (Million), by Country 2024 & 2032
- Figure 3: North America APAC Bunker Fuel Industry Revenue Share (%), by Country 2024 & 2032
- Figure 4: Europe APAC Bunker Fuel Industry Revenue (Million), by Country 2024 & 2032
- Figure 5: Europe APAC Bunker Fuel Industry Revenue Share (%), by Country 2024 & 2032
- Figure 6: Asia Pacific APAC Bunker Fuel Industry Revenue (Million), by Country 2024 & 2032
- Figure 7: Asia Pacific APAC Bunker Fuel Industry Revenue Share (%), by Country 2024 & 2032
- Figure 8: South America APAC Bunker Fuel Industry Revenue (Million), by Country 2024 & 2032
- Figure 9: South America APAC Bunker Fuel Industry Revenue Share (%), by Country 2024 & 2032
- Figure 10: North America APAC Bunker Fuel Industry Revenue (Million), by Country 2024 & 2032
- Figure 11: North America APAC Bunker Fuel Industry Revenue Share (%), by Country 2024 & 2032
- Figure 12: MEA APAC Bunker Fuel Industry Revenue (Million), by Country 2024 & 2032
- Figure 13: MEA APAC Bunker Fuel Industry Revenue Share (%), by Country 2024 & 2032
- Figure 14: China APAC Bunker Fuel Industry Revenue (Million), by Fuel Type 2024 & 2032
- Figure 15: China APAC Bunker Fuel Industry Revenue Share (%), by Fuel Type 2024 & 2032
- Figure 16: China APAC Bunker Fuel Industry Revenue (Million), by Vessel Type 2024 & 2032
- Figure 17: China APAC Bunker Fuel Industry Revenue Share (%), by Vessel Type 2024 & 2032
- Figure 18: China APAC Bunker Fuel Industry Revenue (Million), by Geography 2024 & 2032
- Figure 19: China APAC Bunker Fuel Industry Revenue Share (%), by Geography 2024 & 2032
- Figure 20: China APAC Bunker Fuel Industry Revenue (Million), by Country 2024 & 2032
- Figure 21: China APAC Bunker Fuel Industry Revenue Share (%), by Country 2024 & 2032
- Figure 22: India APAC Bunker Fuel Industry Revenue (Million), by Fuel Type 2024 & 2032
- Figure 23: India APAC Bunker Fuel Industry Revenue Share (%), by Fuel Type 2024 & 2032
- Figure 24: India APAC Bunker Fuel Industry Revenue (Million), by Vessel Type 2024 & 2032
- Figure 25: India APAC Bunker Fuel Industry Revenue Share (%), by Vessel Type 2024 & 2032
- Figure 26: India APAC Bunker Fuel Industry Revenue (Million), by Geography 2024 & 2032
- Figure 27: India APAC Bunker Fuel Industry Revenue Share (%), by Geography 2024 & 2032
- Figure 28: India APAC Bunker Fuel Industry Revenue (Million), by Country 2024 & 2032
- Figure 29: India APAC Bunker Fuel Industry Revenue Share (%), by Country 2024 & 2032
- Figure 30: Singapore APAC Bunker Fuel Industry Revenue (Million), by Fuel Type 2024 & 2032
- Figure 31: Singapore APAC Bunker Fuel Industry Revenue Share (%), by Fuel Type 2024 & 2032
- Figure 32: Singapore APAC Bunker Fuel Industry Revenue (Million), by Vessel Type 2024 & 2032
- Figure 33: Singapore APAC Bunker Fuel Industry Revenue Share (%), by Vessel Type 2024 & 2032
- Figure 34: Singapore APAC Bunker Fuel Industry Revenue (Million), by Geography 2024 & 2032
- Figure 35: Singapore APAC Bunker Fuel Industry Revenue Share (%), by Geography 2024 & 2032
- Figure 36: Singapore APAC Bunker Fuel Industry Revenue (Million), by Country 2024 & 2032
- Figure 37: Singapore APAC Bunker Fuel Industry Revenue Share (%), by Country 2024 & 2032
- Figure 38: Rest of Asia Pacific APAC Bunker Fuel Industry Revenue (Million), by Fuel Type 2024 & 2032
- Figure 39: Rest of Asia Pacific APAC Bunker Fuel Industry Revenue Share (%), by Fuel Type 2024 & 2032
- Figure 40: Rest of Asia Pacific APAC Bunker Fuel Industry Revenue (Million), by Vessel Type 2024 & 2032
- Figure 41: Rest of Asia Pacific APAC Bunker Fuel Industry Revenue Share (%), by Vessel Type 2024 & 2032
- Figure 42: Rest of Asia Pacific APAC Bunker Fuel Industry Revenue (Million), by Geography 2024 & 2032
- Figure 43: Rest of Asia Pacific APAC Bunker Fuel Industry Revenue Share (%), by Geography 2024 & 2032
- Figure 44: Rest of Asia Pacific APAC Bunker Fuel Industry Revenue (Million), by Country 2024 & 2032
- Figure 45: Rest of Asia Pacific APAC Bunker Fuel Industry Revenue Share (%), by Country 2024 & 2032
List of Tables
- Table 1: Global APAC Bunker Fuel Industry Revenue Million Forecast, by Region 2019 & 2032
- Table 2: Global APAC Bunker Fuel Industry Revenue Million Forecast, by Fuel Type 2019 & 2032
- Table 3: Global APAC Bunker Fuel Industry Revenue Million Forecast, by Vessel Type 2019 & 2032
- Table 4: Global APAC Bunker Fuel Industry Revenue Million Forecast, by Geography 2019 & 2032
- Table 5: Global APAC Bunker Fuel Industry Revenue Million Forecast, by Region 2019 & 2032
- Table 6: Global APAC Bunker Fuel Industry Revenue Million Forecast, by Country 2019 & 2032
- Table 7: United States APAC Bunker Fuel Industry Revenue (Million) Forecast, by Application 2019 & 2032
- Table 8: Canada APAC Bunker Fuel Industry Revenue (Million) Forecast, by Application 2019 & 2032
- Table 9: Mexico APAC Bunker Fuel Industry Revenue (Million) Forecast, by Application 2019 & 2032
- Table 10: Global APAC Bunker Fuel Industry Revenue Million Forecast, by Country 2019 & 2032
- Table 11: Germany APAC Bunker Fuel Industry Revenue (Million) Forecast, by Application 2019 & 2032
- Table 12: United Kingdom APAC Bunker Fuel Industry Revenue (Million) Forecast, by Application 2019 & 2032
- Table 13: France APAC Bunker Fuel Industry Revenue (Million) Forecast, by Application 2019 & 2032
- Table 14: Spain APAC Bunker Fuel Industry Revenue (Million) Forecast, by Application 2019 & 2032
- Table 15: Italy APAC Bunker Fuel Industry Revenue (Million) Forecast, by Application 2019 & 2032
- Table 16: Spain APAC Bunker Fuel Industry Revenue (Million) Forecast, by Application 2019 & 2032
- Table 17: Belgium APAC Bunker Fuel Industry Revenue (Million) Forecast, by Application 2019 & 2032
- Table 18: Netherland APAC Bunker Fuel Industry Revenue (Million) Forecast, by Application 2019 & 2032
- Table 19: Nordics APAC Bunker Fuel Industry Revenue (Million) Forecast, by Application 2019 & 2032
- Table 20: Rest of Europe APAC Bunker Fuel Industry Revenue (Million) Forecast, by Application 2019 & 2032
- Table 21: Global APAC Bunker Fuel Industry Revenue Million Forecast, by Country 2019 & 2032
- Table 22: China APAC Bunker Fuel Industry Revenue (Million) Forecast, by Application 2019 & 2032
- Table 23: Japan APAC Bunker Fuel Industry Revenue (Million) Forecast, by Application 2019 & 2032
- Table 24: India APAC Bunker Fuel Industry Revenue (Million) Forecast, by Application 2019 & 2032
- Table 25: South Korea APAC Bunker Fuel Industry Revenue (Million) Forecast, by Application 2019 & 2032
- Table 26: Southeast Asia APAC Bunker Fuel Industry Revenue (Million) Forecast, by Application 2019 & 2032
- Table 27: Australia APAC Bunker Fuel Industry Revenue (Million) Forecast, by Application 2019 & 2032
- Table 28: Indonesia APAC Bunker Fuel Industry Revenue (Million) Forecast, by Application 2019 & 2032
- Table 29: Phillipes APAC Bunker Fuel Industry Revenue (Million) Forecast, by Application 2019 & 2032
- Table 30: Singapore APAC Bunker Fuel Industry Revenue (Million) Forecast, by Application 2019 & 2032
- Table 31: Thailandc APAC Bunker Fuel Industry Revenue (Million) Forecast, by Application 2019 & 2032
- Table 32: Rest of Asia Pacific APAC Bunker Fuel Industry Revenue (Million) Forecast, by Application 2019 & 2032
- Table 33: Global APAC Bunker Fuel Industry Revenue Million Forecast, by Country 2019 & 2032
- Table 34: Brazil APAC Bunker Fuel Industry Revenue (Million) Forecast, by Application 2019 & 2032
- Table 35: Argentina APAC Bunker Fuel Industry Revenue (Million) Forecast, by Application 2019 & 2032
- Table 36: Peru APAC Bunker Fuel Industry Revenue (Million) Forecast, by Application 2019 & 2032
- Table 37: Chile APAC Bunker Fuel Industry Revenue (Million) Forecast, by Application 2019 & 2032
- Table 38: Colombia APAC Bunker Fuel Industry Revenue (Million) Forecast, by Application 2019 & 2032
- Table 39: Ecuador APAC Bunker Fuel Industry Revenue (Million) Forecast, by Application 2019 & 2032
- Table 40: Venezuela APAC Bunker Fuel Industry Revenue (Million) Forecast, by Application 2019 & 2032
- Table 41: Rest of South America APAC Bunker Fuel Industry Revenue (Million) Forecast, by Application 2019 & 2032
- Table 42: Global APAC Bunker Fuel Industry Revenue Million Forecast, by Country 2019 & 2032
- Table 43: United States APAC Bunker Fuel Industry Revenue (Million) Forecast, by Application 2019 & 2032
- Table 44: Canada APAC Bunker Fuel Industry Revenue (Million) Forecast, by Application 2019 & 2032
- Table 45: Mexico APAC Bunker Fuel Industry Revenue (Million) Forecast, by Application 2019 & 2032
- Table 46: Global APAC Bunker Fuel Industry Revenue Million Forecast, by Country 2019 & 2032
- Table 47: United Arab Emirates APAC Bunker Fuel Industry Revenue (Million) Forecast, by Application 2019 & 2032
- Table 48: Saudi Arabia APAC Bunker Fuel Industry Revenue (Million) Forecast, by Application 2019 & 2032
- Table 49: South Africa APAC Bunker Fuel Industry Revenue (Million) Forecast, by Application 2019 & 2032
- Table 50: Rest of Middle East and Africa APAC Bunker Fuel Industry Revenue (Million) Forecast, by Application 2019 & 2032
- Table 51: Global APAC Bunker Fuel Industry Revenue Million Forecast, by Fuel Type 2019 & 2032
- Table 52: Global APAC Bunker Fuel Industry Revenue Million Forecast, by Vessel Type 2019 & 2032
- Table 53: Global APAC Bunker Fuel Industry Revenue Million Forecast, by Geography 2019 & 2032
- Table 54: Global APAC Bunker Fuel Industry Revenue Million Forecast, by Country 2019 & 2032
- Table 55: Global APAC Bunker Fuel Industry Revenue Million Forecast, by Fuel Type 2019 & 2032
- Table 56: Global APAC Bunker Fuel Industry Revenue Million Forecast, by Vessel Type 2019 & 2032
- Table 57: Global APAC Bunker Fuel Industry Revenue Million Forecast, by Geography 2019 & 2032
- Table 58: Global APAC Bunker Fuel Industry Revenue Million Forecast, by Country 2019 & 2032
- Table 59: Global APAC Bunker Fuel Industry Revenue Million Forecast, by Fuel Type 2019 & 2032
- Table 60: Global APAC Bunker Fuel Industry Revenue Million Forecast, by Vessel Type 2019 & 2032
- Table 61: Global APAC Bunker Fuel Industry Revenue Million Forecast, by Geography 2019 & 2032
- Table 62: Global APAC Bunker Fuel Industry Revenue Million Forecast, by Country 2019 & 2032
- Table 63: Global APAC Bunker Fuel Industry Revenue Million Forecast, by Fuel Type 2019 & 2032
- Table 64: Global APAC Bunker Fuel Industry Revenue Million Forecast, by Vessel Type 2019 & 2032
- Table 65: Global APAC Bunker Fuel Industry Revenue Million Forecast, by Geography 2019 & 2032
- Table 66: Global APAC Bunker Fuel Industry Revenue Million Forecast, by Country 2019 & 2032
Frequently Asked Questions
1. What is the projected Compound Annual Growth Rate (CAGR) of the APAC Bunker Fuel Industry?
The projected CAGR is approximately > 16.00%.
2. Which companies are prominent players in the APAC Bunker Fuel Industry?
Key companies in the market include Total SA, Exxon Mobil Corporation, BP Sinopec Marine Fuels Pte Ltd *List Not Exhaustive, China COSCO Holdings Company Limited, Indian Oil Corporation Limited, Royal Dutch Shell PLC, Ocean Network Express PTE Ltd, Chimbusco Pan Nation Petro-Chemical Co Ltd.
3. What are the main segments of the APAC Bunker Fuel Industry?
The market segments include Fuel Type, Vessel Type, Geography.
4. Can you provide details about the market size?
The market size is estimated to be USD XX Million as of 2022.
5. What are some drivers contributing to market growth?
Increasing Demand for Oil and Gas4.; Presence of Proven Oil and Gas Reserves.
6. What are the notable trends driving market growth?
VLSFO to Witness Significant Growth.
7. Are there any restraints impacting market growth?
Volatile Oil and Gas Prices.
8. Can you provide examples of recent developments in the market?
N/A
9. What pricing options are available for accessing the report?
Pricing options include single-user, multi-user, and enterprise licenses priced at USD 4750, USD 5250, and USD 8750 respectively.
10. Is the market size provided in terms of value or volume?
The market size is provided in terms of value, measured in Million.
11. Are there any specific market keywords associated with the report?
Yes, the market keyword associated with the report is "APAC Bunker Fuel Industry," which aids in identifying and referencing the specific market segment covered.
12. How do I determine which pricing option suits my needs best?
The pricing options vary based on user requirements and access needs. Individual users may opt for single-user licenses, while businesses requiring broader access may choose multi-user or enterprise licenses for cost-effective access to the report.
13. Are there any additional resources or data provided in the APAC Bunker Fuel Industry report?
While the report offers comprehensive insights, it's advisable to review the specific contents or supplementary materials provided to ascertain if additional resources or data are available.
14. How can I stay updated on further developments or reports in the APAC Bunker Fuel Industry?
To stay informed about further developments, trends, and reports in the APAC Bunker Fuel Industry, consider subscribing to industry newsletters, following relevant companies and organizations, or regularly checking reputable industry news sources and publications.
Methodology
Step 1 - Identification of Relevant Samples Size from Population Database


Step 2 - Approaches for Defining Global Market Size (Value, Volume* & Price*)

Note*: In applicable scenarios
Step 3 - Data Sources
Primary Research
- Web Analytics
- Survey Reports
- Research Institute
- Latest Research Reports
- Opinion Leaders
Secondary Research
- Annual Reports
- White Paper
- Latest Press Release
- Industry Association
- Paid Database
- Investor Presentations

Step 4 - Data Triangulation
Involves using different sources of information in order to increase the validity of a study
These sources are likely to be stakeholders in a program - participants, other researchers, program staff, other community members, and so on.
Then we put all data in single framework & apply various statistical tools to find out the dynamic on the market.
During the analysis stage, feedback from the stakeholder groups would be compared to determine areas of agreement as well as areas of divergence


