

Key Insights
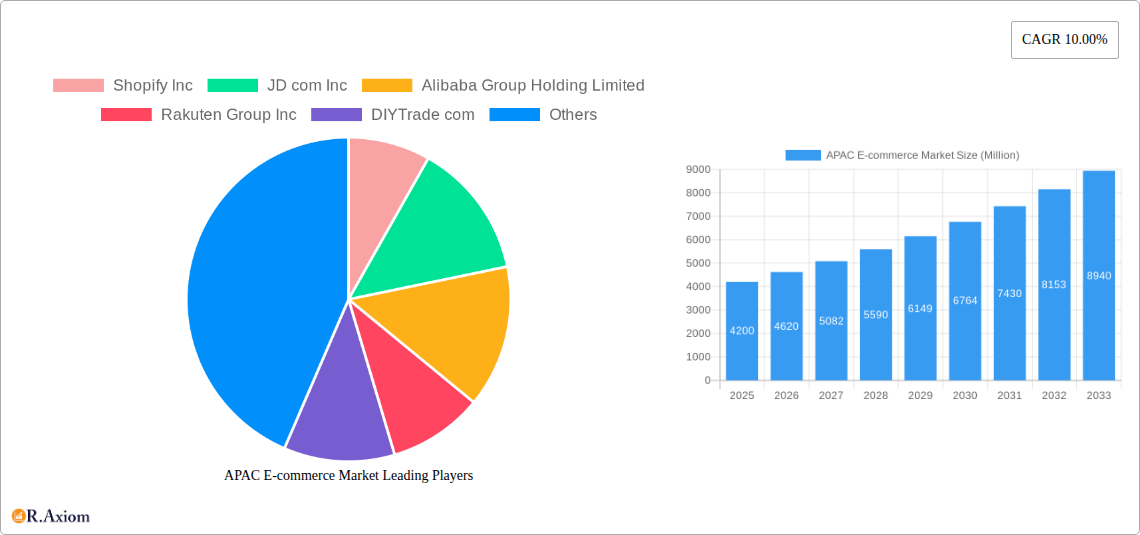
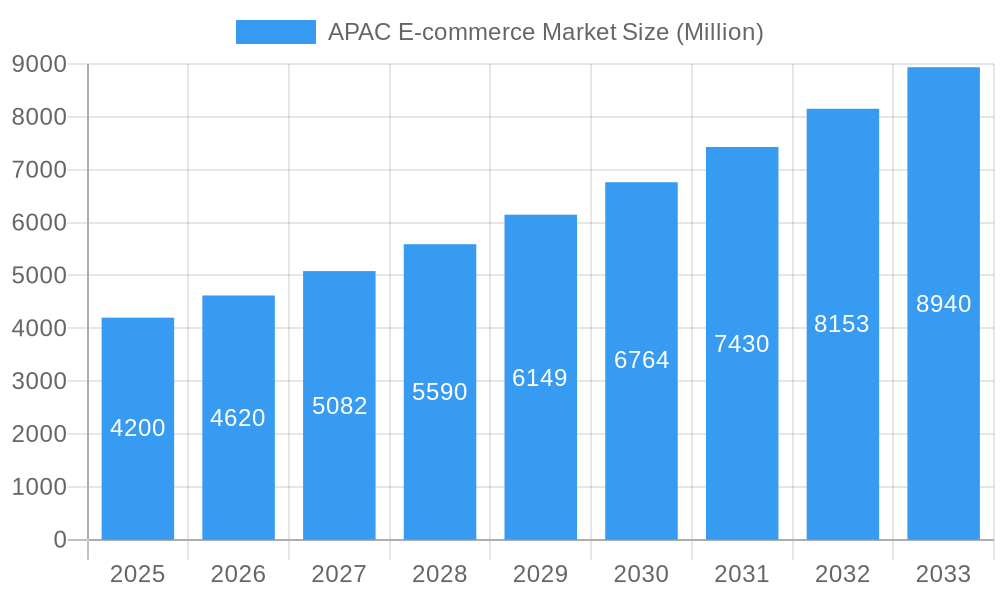
The Asia-Pacific (APAC) e-commerce market is experiencing robust growth, projected to reach $4.20 trillion in 2025 and maintain a Compound Annual Growth Rate (CAGR) of 10% through 2033. This expansion is fueled by several key factors. Firstly, the region's burgeoning middle class, coupled with increasing smartphone penetration and affordable internet access, is driving a surge in online shoppers. Secondly, the rise of mobile commerce and social commerce platforms provides convenient and accessible shopping experiences, particularly in regions with limited physical retail infrastructure. Furthermore, e-commerce giants like Alibaba, Amazon, and Shopify, along with regional players like Rakuten and JD.com, are constantly innovating with improved logistics, payment gateways, and personalized shopping experiences, further fueling market growth. Government initiatives promoting digital infrastructure and e-commerce adoption in many APAC countries also play a significant role. However, challenges remain, including concerns around data security and privacy, the digital divide in some areas limiting access to technology, and the need for robust regulatory frameworks to ensure fair competition and consumer protection.
APAC E-commerce Market Market Size (In Billion)
Despite these challenges, the long-term outlook for the APAC e-commerce market remains positive. The continued expansion of internet and mobile penetration, coupled with ongoing investments in logistics and technology, will likely accelerate market growth. Furthermore, the increasing adoption of e-commerce by small and medium-sized enterprises (SMEs) across the region will further diversify the market and drive volume. Competition among existing players and the emergence of new innovative business models will continue shaping the landscape, offering significant opportunities for growth and innovation in the coming years. Specific growth within countries like China and India, the largest markets within APAC, will be crucial to driving the overall CAGR. Other countries in the region are expected to experience more moderate, but still significant, growth, contributing to the overall market expansion.
APAC E-commerce Market Company Market Share
This detailed report provides a comprehensive analysis of the Asia-Pacific (APAC) e-commerce market, encompassing market size, growth drivers, competitive landscape, and future trends. The study period covers 2019-2033, with 2025 as the base and estimated year. The report is invaluable for businesses, investors, and stakeholders seeking actionable insights into this dynamic market. It leverages extensive data analysis and expert insights to offer a clear picture of current market conditions and future potential.
APAC E-commerce Market Market Concentration & Innovation
This section analyzes the concentration of the APAC e-commerce market, identifying key players and assessing their market share. We examine innovation drivers, such as technological advancements and evolving consumer preferences. The influence of regulatory frameworks, the presence of product substitutes, and prevailing end-user trends are also explored. Finally, we delve into merger and acquisition (M&A) activities within the industry, analyzing deal values and their implications for market dynamics.
Market Concentration: The APAC e-commerce market exhibits a moderately concentrated structure, with a few dominant players holding significant market share. Alibaba and JD.com currently command a large portion, with xx Million in revenue representing xx% combined market share in 2024. Other players, including Amazon, Rakuten, and Shopify, also hold substantial shares.
Innovation Drivers: Technological advancements, such as mobile commerce, AI-powered personalization, and the rise of social commerce, are key innovation drivers. Increased internet penetration and smartphone adoption further fuel this growth.
Regulatory Frameworks: Government regulations related to data privacy, cross-border trade, and consumer protection significantly impact market dynamics. Variations in these regulations across different APAC countries create unique challenges and opportunities.
Product Substitutes: Traditional brick-and-mortar retail remains a significant substitute, although its influence diminishes as e-commerce penetration increases. Other substitutes include direct-to-consumer (DTC) brands and social media platforms enabling direct sales.
End-User Trends: The increasing adoption of mobile devices, preference for omnichannel experiences, and demand for faster and more convenient delivery options are shaping consumer preferences.
M&A Activities: The APAC e-commerce landscape witnesses frequent M&A activities. In 2024, the total value of M&A deals involving e-commerce companies reached an estimated xx Million. These deals often aim to expand market reach, enhance technological capabilities, or diversify product offerings.
APAC E-commerce Market Industry Trends & Insights
This section analyzes the growth trajectory of the APAC e-commerce market, highlighting key trends and providing insights into its future. We examine growth drivers, explore the influence of technological disruptions, and analyze evolving consumer preferences. Competitive dynamics, including pricing strategies, marketing tactics, and product differentiation, are also evaluated. The report provides specific metrics such as compound annual growth rate (CAGR) and market penetration rates to quantify market performance.
The APAC e-commerce market exhibits robust growth, driven by factors such as rising disposable incomes, increased internet penetration, and the expanding adoption of smartphones and other mobile devices. The market is projected to experience a CAGR of xx% from 2025 to 2033, reaching a market size of xx Million by 2033. Technological disruptions, such as the integration of artificial intelligence (AI) and big data analytics, are further accelerating market expansion. Consumers increasingly prefer personalized shopping experiences, seamless omnichannel integration, and fast and reliable delivery options. These preferences are influencing the competitive landscape, pushing companies to innovate and adapt their strategies. Market penetration continues to increase, particularly in developing economies where e-commerce is expanding rapidly.
Dominant Markets & Segments in APAC E-commerce Market
This section identifies the leading regions, countries, and segments within the APAC e-commerce market based on Market Segmentation - by Application. We examine the key drivers behind their dominance, including economic policies, infrastructure development, and consumer behavior.
Dominant Markets: China and India are the most dominant markets due to their large populations, rising middle class, and increasing internet penetration. Other significant markets include Japan, South Korea, Australia, and Singapore.
Key Drivers:
- Economic Policies: Government initiatives promoting digitalization and e-commerce have played a crucial role in market growth. Tax incentives, supportive regulations, and investment in digital infrastructure contribute significantly.
- Infrastructure Development: Improvements in logistics, payment systems, and internet connectivity are essential for e-commerce expansion. Investment in these areas enhances efficiency and accessibility.
- Consumer Behavior: The changing consumer preferences towards online shopping, convenience, and value-for-money deals drive the dominance of certain segments and regions.
China's e-commerce market, driven by robust domestic demand and established players like Alibaba and JD.com, maintains its leading position. India’s market is rapidly expanding due to its large young population and increasing smartphone penetration. Japan and South Korea demonstrate high levels of e-commerce maturity with advanced technology and infrastructure.
APAC E-commerce Market Product Developments
This section summarizes recent product innovations, applications, and competitive advantages in the APAC e-commerce sector, highlighting technological trends and market fit. The increasing adoption of mobile-first strategies, personalized recommendations, and AI-powered chatbots is transforming the customer experience. The integration of augmented reality (AR) and virtual reality (VR) technologies is enhancing product discovery and engagement. The rise of social commerce and live streaming e-commerce platforms offers new opportunities for brands to connect with consumers. These developments are geared towards providing improved customer experience, driving sales, and gaining competitive advantages.
Report Scope & Segmentation Analysis
This report covers the APAC e-commerce market, segmented by application (e.g., B2C, B2B, C2C). Each segment’s growth projections, market sizes, and competitive dynamics are discussed. While a full breakdown of each application segment is provided in the main report, here is a summary:
B2C (Business-to-Consumer): This is the largest segment, encompassing transactions between businesses and individual consumers. Market growth is driven by increasing online shopping adoption and convenience.
B2B (Business-to-Business): This segment involves transactions between businesses, often focusing on wholesale and supply chain management. It experiences steady growth, driven by digital transformation initiatives.
C2C (Consumer-to-Consumer): This segment focuses on transactions between individual consumers, often facilitated through online marketplaces. It demonstrates consistent growth, influenced by trends like secondhand goods sales.
Each segment exhibits specific growth projections and competitive landscapes.
Key Drivers of APAC E-commerce Market Growth
Several factors propel the growth of the APAC e-commerce market. These include rapid technological advancements, particularly in mobile and internet infrastructure, increasing internet and smartphone penetration rates throughout the region, and a growing middle class with higher disposable incomes leading to increased consumer spending. Furthermore, supportive government policies and initiatives fostering digital economies play a crucial role. Lastly, evolving consumer preferences towards convenience and online shopping experiences significantly contribute to the market's expansion.
Challenges in the APAP E-commerce Market Sector
The APAP e-commerce market faces several challenges, including infrastructural limitations in certain areas, concerns about cybersecurity and data privacy, and the complexities of cross-border regulations. These factors can lead to delays in delivery, increased transaction costs, and difficulties in navigating diverse legal frameworks across the region. Furthermore, intense competition from established and emerging players creates significant pressure on profit margins.
Emerging Opportunities in APAC E-commerce Market
The APAP e-commerce market presents significant opportunities. The rise of mobile commerce, particularly in less-developed areas with limited fixed internet access, creates potential for significant growth. The integration of technologies such as AI and machine learning provides opportunities for enhanced customer experience and personalized marketing. The expansion of e-commerce into underserved areas and demographics presents substantial market potential. Lastly, focusing on sustainability and ethical sourcing is an emerging area of opportunity.
Leading Players in the APAC E-commerce Market Market
- Shopify Inc
- JD.com Inc
- Alibaba Group Holding Limited
- Rakuten Group Inc
- DIYTrade com
- ChinaAseanTrade com
- Amazon.com Inc
- eBay Inc
- Apple Inc
- Ali Express
Key Developments in APAC E-commerce Market Industry
February 2023: JD.com, Inc. launched "ChatJD," an AI-powered chatbot designed to enhance retail and financial services. This initiative demonstrates the increasing adoption of AI in the e-commerce sector, enhancing customer service and operational efficiency.
April 2023: TMON launched a "Sports & Leisure Special Hall," offering discounted sports and outdoor goods. This showcases the growing importance of specialized online marketplaces and the use of promotional strategies to drive sales.
Strategic Outlook for APAC E-commerce Market Market
The APAC e-commerce market is poised for continued strong growth, driven by several key factors. The expanding middle class, increasing internet and smartphone penetration, and advancements in technology will contribute to this growth. Companies focused on offering personalized experiences, seamless omnichannel integration, and efficient logistics will be best positioned to succeed. Opportunities exist in expanding into new markets and demographics, leveraging emerging technologies, and providing sustainable and ethical options.
APAC E-commerce Market Segmentation
-
1. Product Type
- 1.1. Corn
- 1.2. rice
- 1.3. wheat
- 1.4. soybean
- 1.5. vegetables
-
2. Application
- 2.1. Commercial farming
- 2.2. small-scale farming
-
3. Distribution Channel
- 3.1. Online
- 3.2. offline
-
4. Geography
- 4.1. China
- 4.2. India
- 4.3. Japan
- 4.4. South Korea
- 4.5. Other APAC countries
APAC E-commerce Market Segmentation By Geography
- 1. China
- 2. India
- 3. Japan
- 4. South Korea
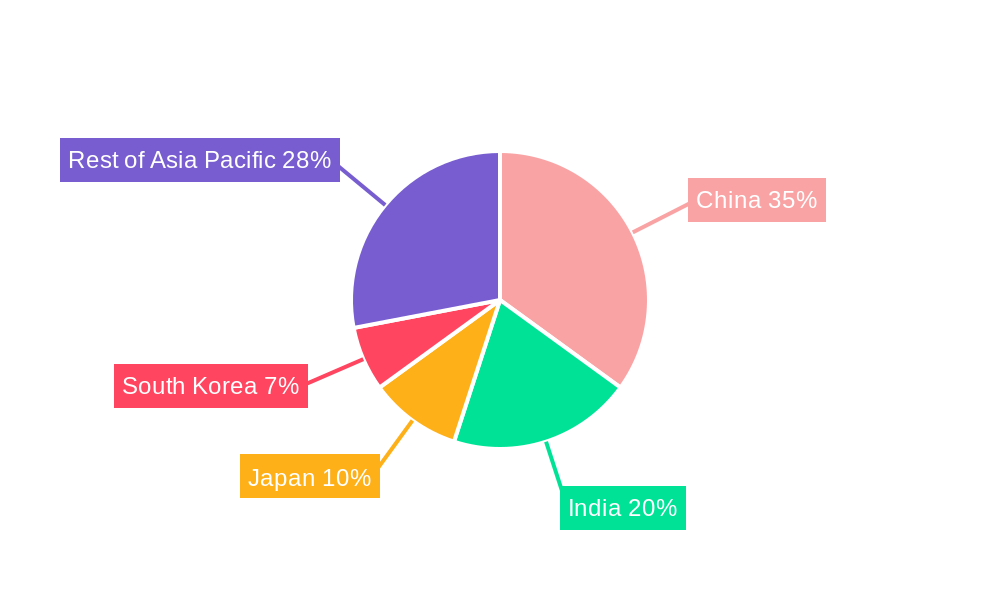
APAC E-commerce Market Regional Market Share
Geographic Coverage of APAC E-commerce Market
APAC E-commerce Market REPORT HIGHLIGHTS
| Aspects | Details |
|---|---|
| Study Period | 2020-2034 |
| Base Year | 2025 |
| Estimated Year | 2026 |
| Forecast Period | 2026-2034 |
| Historical Period | 2020-2025 |
| Growth Rate | CAGR of 10.00% from 2020-2034 |
| Segmentation |
|
Table of Contents
- 1. Introduction
- 1.1. Research Scope
- 1.2. Market Segmentation
- 1.3. Research Objective
- 1.4. Definitions and Assumptions
- 2. Executive Summary
- 2.1. Market Snapshot
- 3. Market Dynamics
- 3.1. Market Drivers
- 3.2. Market Restrains
- 3.3. Market Trends
- 3.4. Market Opportunities
- 4. Market Factor Analysis
- 4.1. Porters Five Forces
- 4.1.1. Bargaining Power of Suppliers
- 4.1.2. Bargaining Power of Buyers
- 4.1.3. Threat of New Entrants
- 4.1.4. Threat of Substitutes
- 4.1.5. Competitive Rivalry
- 4.2. PESTEL analysis
- 4.3. BCG Analysis
- 4.3.1. Stars (High Growth, High Market Share)
- 4.3.2. Cash Cows (Low Growth, High Market Share)
- 4.3.3. Question Mark (High Growth, Low Market Share)
- 4.3.4. Dogs (Low Growth, Low Market Share)
- 4.4. Ansoff Matrix Analysis
- 4.5. Supply Chain Analysis
- 4.6. Regulatory Landscape
- 4.7. Current Market Potential and Opportunity Assessment (TAM–SAM–SOM Framework)
- 4.8. RAX Analyst Note
- 4.1. Porters Five Forces
- 5. Market Analysis, Insights and Forecast 2021-2033
- 5.1. Market Analysis, Insights and Forecast - by Product Type
- 5.1.1. Corn
- 5.1.2. rice
- 5.1.3. wheat
- 5.1.4. soybean
- 5.1.5. vegetables
- 5.2. Market Analysis, Insights and Forecast - by Application
- 5.2.1. Commercial farming
- 5.2.2. small-scale farming
- 5.3. Market Analysis, Insights and Forecast - by Distribution Channel
- 5.3.1. Online
- 5.3.2. offline
- 5.4. Market Analysis, Insights and Forecast - by Geography
- 5.4.1. China
- 5.4.2. India
- 5.4.3. Japan
- 5.4.4. South Korea
- 5.4.5. Other APAC countries
- 5.5. Market Analysis, Insights and Forecast - by Region
- 5.5.1. China
- 5.5.2. India
- 5.5.3. Japan
- 5.5.4. South Korea
- 5.1. Market Analysis, Insights and Forecast - by Product Type
- 6. APAC E-commerce Market Analysis, Insights and Forecast, 2021-2033
- 6.1. Market Analysis, Insights and Forecast - by Product Type
- 6.1.1. Corn
- 6.1.2. rice
- 6.1.3. wheat
- 6.1.4. soybean
- 6.1.5. vegetables
- 6.2. Market Analysis, Insights and Forecast - by Application
- 6.2.1. Commercial farming
- 6.2.2. small-scale farming
- 6.3. Market Analysis, Insights and Forecast - by Distribution Channel
- 6.3.1. Online
- 6.3.2. offline
- 6.4. Market Analysis, Insights and Forecast - by Geography
- 6.4.1. China
- 6.4.2. India
- 6.4.3. Japan
- 6.4.4. South Korea
- 6.4.5. Other APAC countries
- 6.1. Market Analysis, Insights and Forecast - by Product Type
- 7. China APAC E-commerce Market Analysis, Insights and Forecast, 2020-2032
- 7.1. Market Analysis, Insights and Forecast - by Product Type
- 7.1.1. Corn
- 7.1.2. rice
- 7.1.3. wheat
- 7.1.4. soybean
- 7.1.5. vegetables
- 7.2. Market Analysis, Insights and Forecast - by Application
- 7.2.1. Commercial farming
- 7.2.2. small-scale farming
- 7.3. Market Analysis, Insights and Forecast - by Distribution Channel
- 7.3.1. Online
- 7.3.2. offline
- 7.4. Market Analysis, Insights and Forecast - by Geography
- 7.4.1. China
- 7.4.2. India
- 7.4.3. Japan
- 7.4.4. South Korea
- 7.4.5. Other APAC countries
- 7.1. Market Analysis, Insights and Forecast - by Product Type
- 8. India APAC E-commerce Market Analysis, Insights and Forecast, 2020-2032
- 8.1. Market Analysis, Insights and Forecast - by Product Type
- 8.1.1. Corn
- 8.1.2. rice
- 8.1.3. wheat
- 8.1.4. soybean
- 8.1.5. vegetables
- 8.2. Market Analysis, Insights and Forecast - by Application
- 8.2.1. Commercial farming
- 8.2.2. small-scale farming
- 8.3. Market Analysis, Insights and Forecast - by Distribution Channel
- 8.3.1. Online
- 8.3.2. offline
- 8.4. Market Analysis, Insights and Forecast - by Geography
- 8.4.1. China
- 8.4.2. India
- 8.4.3. Japan
- 8.4.4. South Korea
- 8.4.5. Other APAC countries
- 8.1. Market Analysis, Insights and Forecast - by Product Type
- 9. Japan APAC E-commerce Market Analysis, Insights and Forecast, 2020-2032
- 9.1. Market Analysis, Insights and Forecast - by Product Type
- 9.1.1. Corn
- 9.1.2. rice
- 9.1.3. wheat
- 9.1.4. soybean
- 9.1.5. vegetables
- 9.2. Market Analysis, Insights and Forecast - by Application
- 9.2.1. Commercial farming
- 9.2.2. small-scale farming
- 9.3. Market Analysis, Insights and Forecast - by Distribution Channel
- 9.3.1. Online
- 9.3.2. offline
- 9.4. Market Analysis, Insights and Forecast - by Geography
- 9.4.1. China
- 9.4.2. India
- 9.4.3. Japan
- 9.4.4. South Korea
- 9.4.5. Other APAC countries
- 9.1. Market Analysis, Insights and Forecast - by Product Type
- 10. South Korea APAC E-commerce Market Analysis, Insights and Forecast, 2020-2032
- 10.1. Market Analysis, Insights and Forecast - by Product Type
- 10.1.1. Corn
- 10.1.2. rice
- 10.1.3. wheat
- 10.1.4. soybean
- 10.1.5. vegetables
- 10.2. Market Analysis, Insights and Forecast - by Application
- 10.2.1. Commercial farming
- 10.2.2. small-scale farming
- 10.3. Market Analysis, Insights and Forecast - by Distribution Channel
- 10.3.1. Online
- 10.3.2. offline
- 10.4. Market Analysis, Insights and Forecast - by Geography
- 10.4.1. China
- 10.4.2. India
- 10.4.3. Japan
- 10.4.4. South Korea
- 10.4.5. Other APAC countries
- 10.1. Market Analysis, Insights and Forecast - by Product Type
- 11. Competitive Analysis
- 11.1. Company Profiles
- 11.1.1 Shopify Inc
- 11.1.1.1. Company Overview
- 11.1.1.2. Products
- 11.1.1.3. Company Financials
- 11.1.1.4. SWOT Analysis
- 11.1.2 JD com Inc
- 11.1.2.1. Company Overview
- 11.1.2.2. Products
- 11.1.2.3. Company Financials
- 11.1.2.4. SWOT Analysis
- 11.1.3 Alibaba Group Holding Limited
- 11.1.3.1. Company Overview
- 11.1.3.2. Products
- 11.1.3.3. Company Financials
- 11.1.3.4. SWOT Analysis
- 11.1.4 Rakuten Group Inc
- 11.1.4.1. Company Overview
- 11.1.4.2. Products
- 11.1.4.3. Company Financials
- 11.1.4.4. SWOT Analysis
- 11.1.5 DIYTrade com
- 11.1.5.1. Company Overview
- 11.1.5.2. Products
- 11.1.5.3. Company Financials
- 11.1.5.4. SWOT Analysis
- 11.1.6 ChinaAseanTrade com
- 11.1.6.1. Company Overview
- 11.1.6.2. Products
- 11.1.6.3. Company Financials
- 11.1.6.4. SWOT Analysis
- 11.1.7 Amazon com Inc
- 11.1.7.1. Company Overview
- 11.1.7.2. Products
- 11.1.7.3. Company Financials
- 11.1.7.4. SWOT Analysis
- 11.1.8 eBay Inc
- 11.1.8.1. Company Overview
- 11.1.8.2. Products
- 11.1.8.3. Company Financials
- 11.1.8.4. SWOT Analysis
- 11.1.9 Apple Inc
- 11.1.9.1. Company Overview
- 11.1.9.2. Products
- 11.1.9.3. Company Financials
- 11.1.9.4. SWOT Analysis
- 11.1.10 Ali Express
- 11.1.10.1. Company Overview
- 11.1.10.2. Products
- 11.1.10.3. Company Financials
- 11.1.10.4. SWOT Analysis
- 11.1.1 Shopify Inc
- 11.2. Market Entropy
- 11.2.1 Company's Key Areas Served
- 11.2.2 Recent Developments
- 11.3. Company Market Share Analysis 2025
- 11.3.1 Top 5 Companies Market Share Analysis
- 11.3.2 Top 3 Companies Market Share Analysis
- 11.4. List of Potential Customers
- 12. Research Methodology
List of Figures
- Figure 1: APAC E-commerce Market Revenue Breakdown (Million, %) by Product 2025 & 2033
- Figure 2: APAC E-commerce Market Share (%) by Company 2025
List of Tables
- Table 1: APAC E-commerce Market Revenue Million Forecast, by Product Type 2020 & 2033
- Table 2: APAC E-commerce Market Volume K Unit Forecast, by Product Type 2020 & 2033
- Table 3: APAC E-commerce Market Revenue Million Forecast, by Application 2020 & 2033
- Table 4: APAC E-commerce Market Volume K Unit Forecast, by Application 2020 & 2033
- Table 5: APAC E-commerce Market Revenue Million Forecast, by Distribution Channel 2020 & 2033
- Table 6: APAC E-commerce Market Volume K Unit Forecast, by Distribution Channel 2020 & 2033
- Table 7: APAC E-commerce Market Revenue Million Forecast, by Geography 2020 & 2033
- Table 8: APAC E-commerce Market Volume K Unit Forecast, by Geography 2020 & 2033
- Table 9: APAC E-commerce Market Revenue Million Forecast, by Region 2020 & 2033
- Table 10: APAC E-commerce Market Volume K Unit Forecast, by Region 2020 & 2033
- Table 11: APAC E-commerce Market Revenue Million Forecast, by Product Type 2020 & 2033
- Table 12: APAC E-commerce Market Volume K Unit Forecast, by Product Type 2020 & 2033
- Table 13: APAC E-commerce Market Revenue Million Forecast, by Application 2020 & 2033
- Table 14: APAC E-commerce Market Volume K Unit Forecast, by Application 2020 & 2033
- Table 15: APAC E-commerce Market Revenue Million Forecast, by Distribution Channel 2020 & 2033
- Table 16: APAC E-commerce Market Volume K Unit Forecast, by Distribution Channel 2020 & 2033
- Table 17: APAC E-commerce Market Revenue Million Forecast, by Geography 2020 & 2033
- Table 18: APAC E-commerce Market Volume K Unit Forecast, by Geography 2020 & 2033
- Table 19: APAC E-commerce Market Revenue Million Forecast, by Country 2020 & 2033
- Table 20: APAC E-commerce Market Volume K Unit Forecast, by Country 2020 & 2033
- Table 21: APAC E-commerce Market Revenue Million Forecast, by Product Type 2020 & 2033
- Table 22: APAC E-commerce Market Volume K Unit Forecast, by Product Type 2020 & 2033
- Table 23: APAC E-commerce Market Revenue Million Forecast, by Application 2020 & 2033
- Table 24: APAC E-commerce Market Volume K Unit Forecast, by Application 2020 & 2033
- Table 25: APAC E-commerce Market Revenue Million Forecast, by Distribution Channel 2020 & 2033
- Table 26: APAC E-commerce Market Volume K Unit Forecast, by Distribution Channel 2020 & 2033
- Table 27: APAC E-commerce Market Revenue Million Forecast, by Geography 2020 & 2033
- Table 28: APAC E-commerce Market Volume K Unit Forecast, by Geography 2020 & 2033
- Table 29: APAC E-commerce Market Revenue Million Forecast, by Country 2020 & 2033
- Table 30: APAC E-commerce Market Volume K Unit Forecast, by Country 2020 & 2033
- Table 31: APAC E-commerce Market Revenue Million Forecast, by Product Type 2020 & 2033
- Table 32: APAC E-commerce Market Volume K Unit Forecast, by Product Type 2020 & 2033
- Table 33: APAC E-commerce Market Revenue Million Forecast, by Application 2020 & 2033
- Table 34: APAC E-commerce Market Volume K Unit Forecast, by Application 2020 & 2033
- Table 35: APAC E-commerce Market Revenue Million Forecast, by Distribution Channel 2020 & 2033
- Table 36: APAC E-commerce Market Volume K Unit Forecast, by Distribution Channel 2020 & 2033
- Table 37: APAC E-commerce Market Revenue Million Forecast, by Geography 2020 & 2033
- Table 38: APAC E-commerce Market Volume K Unit Forecast, by Geography 2020 & 2033
- Table 39: APAC E-commerce Market Revenue Million Forecast, by Country 2020 & 2033
- Table 40: APAC E-commerce Market Volume K Unit Forecast, by Country 2020 & 2033
- Table 41: APAC E-commerce Market Revenue Million Forecast, by Product Type 2020 & 2033
- Table 42: APAC E-commerce Market Volume K Unit Forecast, by Product Type 2020 & 2033
- Table 43: APAC E-commerce Market Revenue Million Forecast, by Application 2020 & 2033
- Table 44: APAC E-commerce Market Volume K Unit Forecast, by Application 2020 & 2033
- Table 45: APAC E-commerce Market Revenue Million Forecast, by Distribution Channel 2020 & 2033
- Table 46: APAC E-commerce Market Volume K Unit Forecast, by Distribution Channel 2020 & 2033
- Table 47: APAC E-commerce Market Revenue Million Forecast, by Geography 2020 & 2033
- Table 48: APAC E-commerce Market Volume K Unit Forecast, by Geography 2020 & 2033
- Table 49: APAC E-commerce Market Revenue Million Forecast, by Country 2020 & 2033
- Table 50: APAC E-commerce Market Volume K Unit Forecast, by Country 2020 & 2033
Frequently Asked Questions
1. What is the projected Compound Annual Growth Rate (CAGR) of the APAC E-commerce Market?
The projected CAGR is approximately 10.00%.
2. Which companies are prominent players in the APAC E-commerce Market?
Key companies in the market include Shopify Inc, JD com Inc, Alibaba Group Holding Limited, Rakuten Group Inc, DIYTrade com, ChinaAseanTrade com, Amazon com Inc, eBay Inc, Apple Inc, Ali Express.
3. What are the main segments of the APAC E-commerce Market?
The market segments include Product Type, Application, Distribution Channel, Geography.
4. Can you provide details about the market size?
The market size is estimated to be USD 4.20 Million as of 2022.
5. What are some drivers contributing to market growth?
Growing Disposable Income of Consumers; Increasing Consumer Interest towards Convenient Shopping solutions; Extensive Internet Accessibility.
6. What are the notable trends driving market growth?
Fashion and Apparel to Witness the Growth.
7. Are there any restraints impacting market growth?
High Cost of Content Creation.
8. Can you provide examples of recent developments in the market?
April 2023: TMON announced that the company would open a 'Sports & Leisure Special Hall" and introduce popular sports and outdoor items at exceptional prices. An additional 8% discount was also available when paying with Kakao Pay. This is expected to help athletic people stretch in warm spring weather.
9. What pricing options are available for accessing the report?
Pricing options include single-user, multi-user, and enterprise licenses priced at USD 3800, USD 4500, and USD 5800 respectively.
10. Is the market size provided in terms of value or volume?
The market size is provided in terms of value, measured in Million and volume, measured in K Unit.
11. Are there any specific market keywords associated with the report?
Yes, the market keyword associated with the report is "APAC E-commerce Market," which aids in identifying and referencing the specific market segment covered.
12. How do I determine which pricing option suits my needs best?
The pricing options vary based on user requirements and access needs. Individual users may opt for single-user licenses, while businesses requiring broader access may choose multi-user or enterprise licenses for cost-effective access to the report.
13. Are there any additional resources or data provided in the APAC E-commerce Market report?
While the report offers comprehensive insights, it's advisable to review the specific contents or supplementary materials provided to ascertain if additional resources or data are available.
14. How can I stay updated on further developments or reports in the APAC E-commerce Market?
To stay informed about further developments, trends, and reports in the APAC E-commerce Market, consider subscribing to industry newsletters, following relevant companies and organizations, or regularly checking reputable industry news sources and publications.
Methodology
Step 1 - Identification of Relevant Samples Size from Population Database


Step 2 - Approaches for Defining Global Market Size (Value, Volume* & Price*)

Note*: In applicable scenarios
Step 3 - Data Sources
Primary Research
- Web Analytics
- Survey Reports
- Research Institute
- Latest Research Reports
- Opinion Leaders
Secondary Research
- Annual Reports
- White Paper
- Latest Press Release
- Industry Association
- Paid Database
- Investor Presentations

Step 4 - Data Triangulation
Involves using different sources of information in order to increase the validity of a study
These sources are likely to be stakeholders in a program - participants, other researchers, program staff, other community members, and so on.
Then we put all data in single framework & apply various statistical tools to find out the dynamic on the market.
During the analysis stage, feedback from the stakeholder groups would be compared to determine areas of agreement as well as areas of divergence