
Key Insights
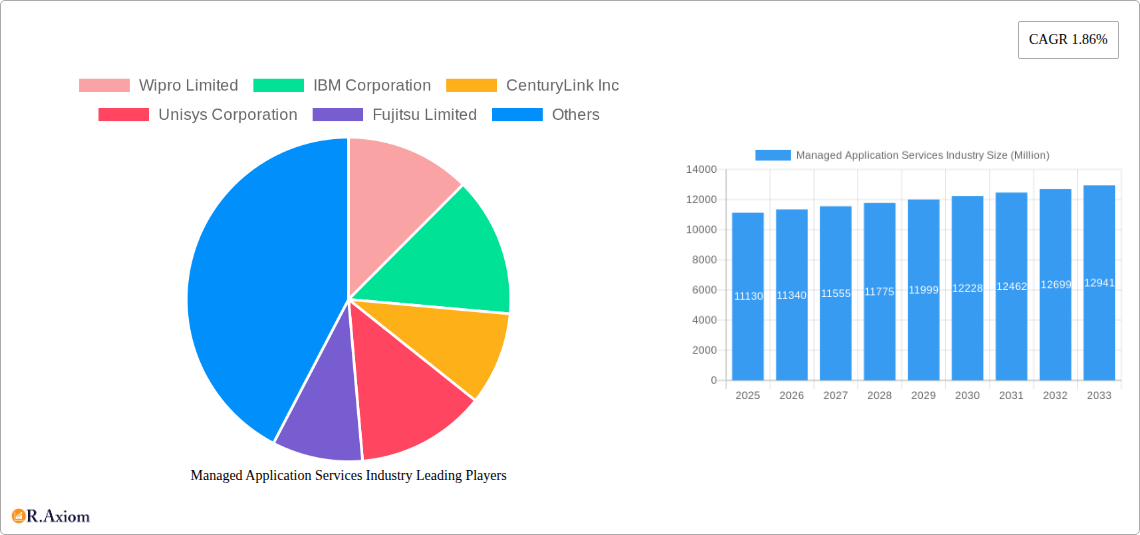
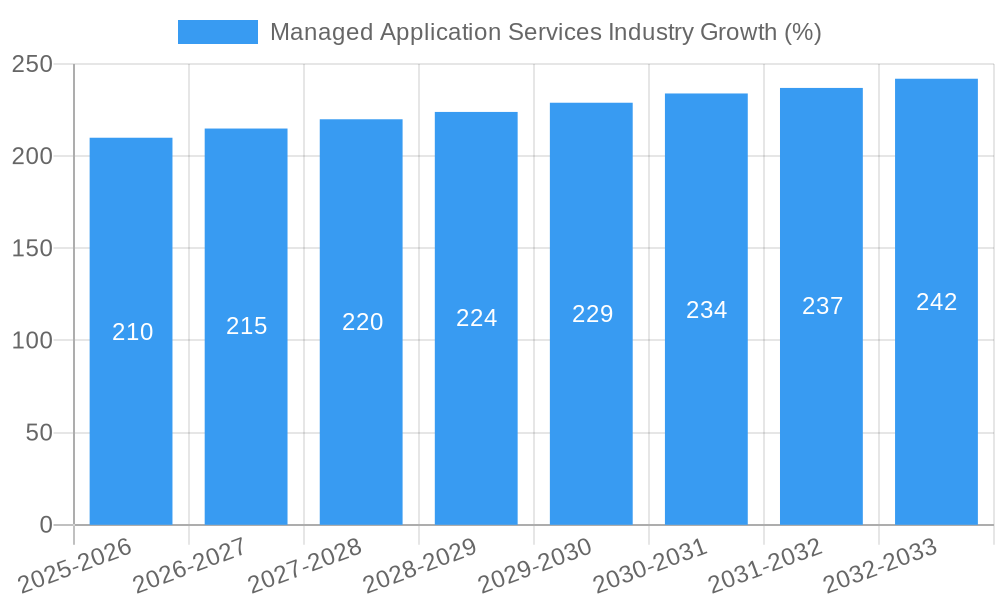
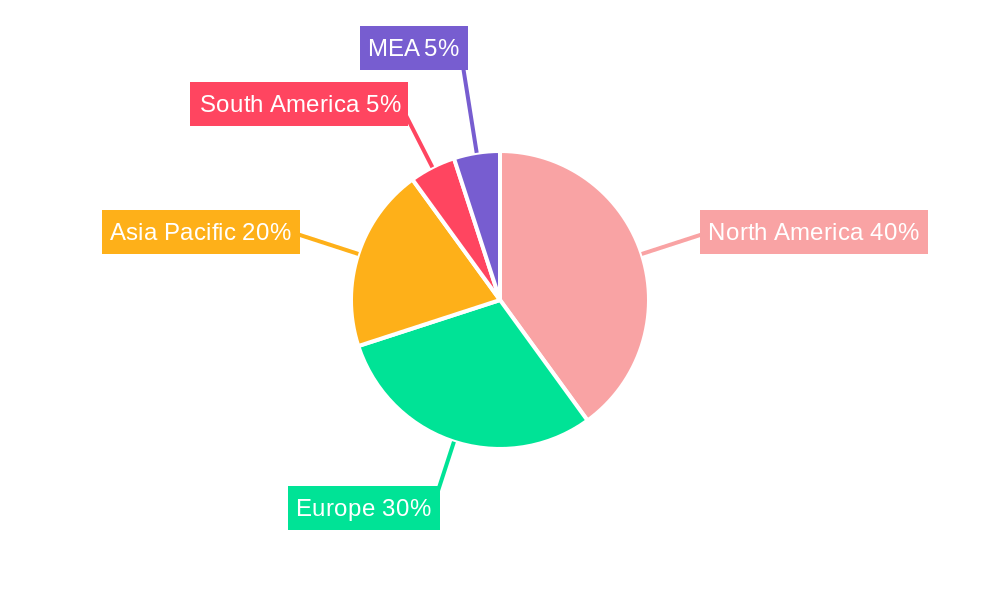
The Managed Application Services (MAS) market is experiencing steady growth, projected to reach \$11.13 billion in 2025 and maintain a Compound Annual Growth Rate (CAGR) of 1.86% from 2025 to 2033. This consistent expansion is driven by several key factors. Firstly, the increasing complexity of enterprise IT infrastructure necessitates outsourcing of application management to specialized providers. Businesses are prioritizing efficiency and cost optimization, leading them to leverage MAS providers' expertise in application maintenance, upgrades, and security. Secondly, the rising adoption of cloud technologies and digital transformation initiatives fuels demand for skilled professionals to manage these complex environments. This demand outpaces internal capabilities, further bolstering the MAS market. Finally, the stringent regulatory compliance requirements across diverse sectors, such as BFSI (Banking, Financial Services, and Insurance) and Healthcare, necessitate robust application management and security practices, propelling demand for MAS. The market is segmented by end-user vertical (BFSI, Retail & E-commerce, IT & Telecom, Manufacturing, Healthcare) and organization size (SMEs, Large Enterprises), with large enterprises currently driving a significant portion of the market due to their greater IT budgets and complex application portfolios. North America currently holds a substantial market share, however, regions like Asia-Pacific are expected to witness significant growth driven by increasing digital adoption and infrastructure investments.
While the CAGR suggests moderate growth, significant opportunities exist for MAS providers. Focusing on specialized solutions for specific industry verticals, leveraging emerging technologies like AI and automation for improved efficiency and cost-effectiveness, and expanding into high-growth regions will be crucial for market leadership. Challenges include fierce competition among established players, managing security risks associated with outsourced applications, and adapting to the ever-evolving technological landscape. Success will depend on providers’ ability to demonstrate a deep understanding of client needs, offer innovative solutions, and build robust and secure application management capabilities. The forecast period of 2025-2033 presents a significant window of opportunity for continued expansion, however, a proactive approach to adaptation and innovation is essential for navigating the market's inherent challenges and capitalizing on its potential.
Managed Application Services Industry Market Report: 2019-2033
This comprehensive report provides a detailed analysis of the Managed Application Services industry, offering actionable insights for stakeholders across the value chain. The report covers the period 2019-2033, with a focus on the estimated year 2025 and a forecast period spanning 2025-2033. Key segments analyzed include End-user Verticals (BFSI, Retail & E-Commerce, IT & Telecom, Manufacturing, Healthcare) and Organization Size (Small & Medium-scale Enterprises, Large Enterprises). Leading players like Wipro Limited, IBM Corporation, CenturyLink Inc, Unisys Corporation, Fujitsu Limited, RACKSPACE INC, DXC Technology Company, Mindtree Limited, HCL Technologies Limited, BMC Software INC, and VIRTUSTREAM INC are profiled, providing a holistic understanding of the market's dynamics and future trajectory. The total market size is predicted to reach xx Million by 2033.
Managed Application Services Industry Market Concentration & Innovation
The Managed Application Services market exhibits a moderately concentrated landscape, with the top 10 players holding an estimated xx% market share in 2025. Innovation is driven by the increasing adoption of cloud technologies, artificial intelligence (AI), and automation. Regulatory frameworks, particularly concerning data privacy and security, significantly influence market operations. Product substitutes, such as in-house application management, present a competitive challenge. End-user trends favor managed services for cost optimization and improved operational efficiency. M&A activity has been relatively robust in recent years, with deal values totaling approximately xx Million in 2024. Key examples include:
- Strategic acquisitions by large players to expand service offerings and geographic reach.
- Consolidation among smaller players to enhance competitiveness.
Managed Application Services Industry Industry Trends & Insights
The Managed Application Services market is experiencing robust growth, with a projected Compound Annual Growth Rate (CAGR) of xx% during the forecast period (2025-2033). Market penetration is steadily increasing across various end-user verticals, driven by several key factors:
- Digital Transformation: Organizations are increasingly outsourcing application management to focus on core business functions.
- Cloud Adoption: The shift to cloud-based applications fuels demand for managed services to ensure seamless operation and security.
- Automation and AI: These technologies enhance efficiency and reduce operational costs, driving adoption.
- Cybersecurity Concerns: The rising threat landscape necessitates robust application security, boosting demand for managed services with advanced security capabilities.
- Cost Optimization: Managed services provide a cost-effective alternative to in-house application management teams.
Competitive dynamics are shaped by pricing strategies, service differentiation, and strategic partnerships.
Dominant Markets & Segments in Managed Application Services Industry
The North American region is currently the dominant market for Managed Application Services, driven by high cloud adoption rates and a large base of enterprises. Within the end-user verticals, BFSI and IT & Telecom show the highest growth potential.
Key Drivers:
- BFSI: Stringent regulatory compliance requirements and the need for high application availability drive demand.
- Retail & E-commerce: The need for scalable and reliable applications to manage online transactions and customer interactions.
- IT & Telecom: The increasing complexity of network infrastructure and applications.
- Manufacturing: The adoption of smart manufacturing solutions requiring robust application management.
- Healthcare: The increasing reliance on electronic health records (EHR) and other applications, alongside stringent security and compliance regulations.
Large Enterprises: This segment dominates the market due to their greater IT budgets and higher complexity of application landscapes. However, the Small & Medium-scale Enterprises (SMEs) segment exhibits higher growth potential.
Managed Application Services Industry Product Developments
Recent product innovations focus on AI-powered automation, enhanced security features, and cloud-native application management solutions. These developments offer improved efficiency, reduced operational costs, and enhanced security, directly addressing market needs for optimized application performance and reduced risk. The key competitive advantage lies in offering comprehensive, integrated solutions that streamline application management for various cloud environments.
Report Scope & Segmentation Analysis
This report comprehensively segments the Managed Application Services market across multiple dimensions:
End-user Verticals: BFSI, Retail & E-commerce, IT & Telecom, Manufacturing, Healthcare each segment shows unique growth trajectories influenced by sector-specific factors. The BFSI sector exhibits a large market size, while Retail & E-commerce shows high growth.
Organization Size: The Large Enterprises segment currently accounts for a larger market share due to their higher IT budgets, but SMEs are predicted to have higher growth rates in the forecast period.
Key Drivers of Managed Application Services Industry Growth
The Managed Application Services market’s growth is propelled by several key factors:
- The increasing complexity of applications and IT infrastructure necessitate expert management.
- Cloud migration is driving the need for specialized managed services to ensure security and efficiency.
- The rising demand for advanced security solutions to mitigate cyber threats.
- The increasing focus on cost optimization and operational efficiency.
Challenges in the Managed Application Services Industry Sector
Several challenges hinder the industry's growth:
- Intense competition among established players and new entrants.
- Maintaining high service quality while managing diverse application environments.
- Ensuring compliance with ever-evolving regulatory frameworks.
- Skilled workforce shortages in specialized areas like cloud security and AI. This impacts service delivery and potentially increases costs.
Emerging Opportunities in Managed Application Services Industry
Emerging opportunities lie in:
- Expanding into new geographic markets, particularly in developing economies.
- Developing specialized services for emerging technologies like IoT, Blockchain, and AI.
- Leveraging AI and automation to offer proactive maintenance and predictive analytics for improved application performance.
- Offering bundled services incorporating application development, testing, and deployment.
Leading Players in the Managed Application Services Industry Market
- Wipro Limited
- IBM Corporation
- CenturyLink Inc
- Unisys Corporation
- Fujitsu Limited
- RACKSPACE INC
- DXC Technology Company
- Mindtree Limited
- HCL Technologies Limited
- BMC Software INC
- VIRTUSTREAM INC
Key Developments in Managed Application Services Industry Industry
- June 2022: AWS launched Managed Services (AMS) Accelerate, a cloud operations offering emphasizing operational excellence and cost efficiency. This significantly impacts the market by offering a competitive, scalable, and secure solution.
- February 2022: IBM launched "Let's create," a new integrated global platform focusing on hybrid cloud and AI solutions. This enhances IBM's competitive positioning and drives innovation in the market.
Strategic Outlook for Managed Application Services Industry Market
The Managed Application Services market is poised for continued growth, driven by increasing digital transformation initiatives, cloud adoption, and the demand for advanced security solutions. Opportunities abound for players who can offer innovative, integrated solutions, leverage emerging technologies, and effectively address the challenges of cybersecurity and skilled labor shortages. The market’s future success hinges on adaptability, innovation, and a keen understanding of evolving customer needs.
Managed Application Services Industry Segmentation
-
1. Organization Size
- 1.1. Small & Medium-scale Enterprises
- 1.2. Large Enterprises
-
2. End-user Verticals
- 2.1. BFSI
- 2.2. Retail & E-Commerce
- 2.3. IT & Telecom
- 2.4. Manufacturing
- 2.5. Healthcare
Managed Application Services Industry Segmentation By Geography
-
1. North America
- 1.1. United States
- 1.2. Canada
- 1.3. Mexico
- 1.4. Rest of North America
-
2. Europe
- 2.1. Germany
- 2.2. United Kingdom
- 2.3. France
- 2.4. Russia
- 2.5. Spain
- 2.6. Rest of Europe
-
3. Asia Pacific
- 3.1. India
- 3.2. China
- 3.3. Japan
- 3.4. Rest of Asia Pacific
-
4. South America
- 4.1. Brazil
- 4.2. Argentina
-
5. Middle East
- 5.1. United Arab Emirates
- 5.2. Saudi Arabia
- 5.3. Rest of Middle East
Managed Application Services Industry REPORT HIGHLIGHTS
| Aspects | Details |
|---|---|
| Study Period | 2019-2033 |
| Base Year | 2024 |
| Estimated Year | 2025 |
| Forecast Period | 2025-2033 |
| Historical Period | 2019-2024 |
| Growth Rate | CAGR of 1.86% from 2019-2033 |
| Segmentation |
|
Table of Contents
- 1. Introduction
- 1.1. Research Scope
- 1.2. Market Segmentation
- 1.3. Research Methodology
- 1.4. Definitions and Assumptions
- 2. Executive Summary
- 2.1. Introduction
- 3. Market Dynamics
- 3.1. Introduction
- 3.2. Market Drivers
- 3.2.1. Increased demand for end-to-end application hosting; The requirement to improve and secure critical business applications; Increase in the level of application infrastructure
- 3.3. Market Restrains
- 3.3.1. Security risks associated with application data
- 3.4. Market Trends
- 3.4.1. IT and Telecom is Expected to Hold Major Share
- 4. Market Factor Analysis
- 4.1. Porters Five Forces
- 4.2. Supply/Value Chain
- 4.3. PESTEL analysis
- 4.4. Market Entropy
- 4.5. Patent/Trademark Analysis
- 5. Global Managed Application Services Industry Analysis, Insights and Forecast, 2019-2031
- 5.1. Market Analysis, Insights and Forecast - by Organization Size
- 5.1.1. Small & Medium-scale Enterprises
- 5.1.2. Large Enterprises
- 5.2. Market Analysis, Insights and Forecast - by End-user Verticals
- 5.2.1. BFSI
- 5.2.2. Retail & E-Commerce
- 5.2.3. IT & Telecom
- 5.2.4. Manufacturing
- 5.2.5. Healthcare
- 5.3. Market Analysis, Insights and Forecast - by Region
- 5.3.1. North America
- 5.3.2. Europe
- 5.3.3. Asia Pacific
- 5.3.4. South America
- 5.3.5. Middle East
- 5.1. Market Analysis, Insights and Forecast - by Organization Size
- 6. North America Managed Application Services Industry Analysis, Insights and Forecast, 2019-2031
- 6.1. Market Analysis, Insights and Forecast - by Organization Size
- 6.1.1. Small & Medium-scale Enterprises
- 6.1.2. Large Enterprises
- 6.2. Market Analysis, Insights and Forecast - by End-user Verticals
- 6.2.1. BFSI
- 6.2.2. Retail & E-Commerce
- 6.2.3. IT & Telecom
- 6.2.4. Manufacturing
- 6.2.5. Healthcare
- 6.1. Market Analysis, Insights and Forecast - by Organization Size
- 7. Europe Managed Application Services Industry Analysis, Insights and Forecast, 2019-2031
- 7.1. Market Analysis, Insights and Forecast - by Organization Size
- 7.1.1. Small & Medium-scale Enterprises
- 7.1.2. Large Enterprises
- 7.2. Market Analysis, Insights and Forecast - by End-user Verticals
- 7.2.1. BFSI
- 7.2.2. Retail & E-Commerce
- 7.2.3. IT & Telecom
- 7.2.4. Manufacturing
- 7.2.5. Healthcare
- 7.1. Market Analysis, Insights and Forecast - by Organization Size
- 8. Asia Pacific Managed Application Services Industry Analysis, Insights and Forecast, 2019-2031
- 8.1. Market Analysis, Insights and Forecast - by Organization Size
- 8.1.1. Small & Medium-scale Enterprises
- 8.1.2. Large Enterprises
- 8.2. Market Analysis, Insights and Forecast - by End-user Verticals
- 8.2.1. BFSI
- 8.2.2. Retail & E-Commerce
- 8.2.3. IT & Telecom
- 8.2.4. Manufacturing
- 8.2.5. Healthcare
- 8.1. Market Analysis, Insights and Forecast - by Organization Size
- 9. South America Managed Application Services Industry Analysis, Insights and Forecast, 2019-2031
- 9.1. Market Analysis, Insights and Forecast - by Organization Size
- 9.1.1. Small & Medium-scale Enterprises
- 9.1.2. Large Enterprises
- 9.2. Market Analysis, Insights and Forecast - by End-user Verticals
- 9.2.1. BFSI
- 9.2.2. Retail & E-Commerce
- 9.2.3. IT & Telecom
- 9.2.4. Manufacturing
- 9.2.5. Healthcare
- 9.1. Market Analysis, Insights and Forecast - by Organization Size
- 10. Middle East Managed Application Services Industry Analysis, Insights and Forecast, 2019-2031
- 10.1. Market Analysis, Insights and Forecast - by Organization Size
- 10.1.1. Small & Medium-scale Enterprises
- 10.1.2. Large Enterprises
- 10.2. Market Analysis, Insights and Forecast - by End-user Verticals
- 10.2.1. BFSI
- 10.2.2. Retail & E-Commerce
- 10.2.3. IT & Telecom
- 10.2.4. Manufacturing
- 10.2.5. Healthcare
- 10.1. Market Analysis, Insights and Forecast - by Organization Size
- 11. North America Managed Application Services Industry Analysis, Insights and Forecast, 2019-2031
- 11.1. Market Analysis, Insights and Forecast - By Country/Sub-region
- 11.1.1 United States
- 11.1.2 Canada
- 11.1.3 Mexico
- 12. Europe Managed Application Services Industry Analysis, Insights and Forecast, 2019-2031
- 12.1. Market Analysis, Insights and Forecast - By Country/Sub-region
- 12.1.1 Germany
- 12.1.2 United Kingdom
- 12.1.3 France
- 12.1.4 Spain
- 12.1.5 Italy
- 12.1.6 Spain
- 12.1.7 Belgium
- 12.1.8 Netherland
- 12.1.9 Nordics
- 12.1.10 Rest of Europe
- 13. Asia Pacific Managed Application Services Industry Analysis, Insights and Forecast, 2019-2031
- 13.1. Market Analysis, Insights and Forecast - By Country/Sub-region
- 13.1.1 China
- 13.1.2 Japan
- 13.1.3 India
- 13.1.4 South Korea
- 13.1.5 Southeast Asia
- 13.1.6 Australia
- 13.1.7 Indonesia
- 13.1.8 Phillipes
- 13.1.9 Singapore
- 13.1.10 Thailandc
- 13.1.11 Rest of Asia Pacific
- 14. South America Managed Application Services Industry Analysis, Insights and Forecast, 2019-2031
- 14.1. Market Analysis, Insights and Forecast - By Country/Sub-region
- 14.1.1 Brazil
- 14.1.2 Argentina
- 14.1.3 Peru
- 14.1.4 Chile
- 14.1.5 Colombia
- 14.1.6 Ecuador
- 14.1.7 Venezuela
- 14.1.8 Rest of South America
- 15. North America Managed Application Services Industry Analysis, Insights and Forecast, 2019-2031
- 15.1. Market Analysis, Insights and Forecast - By Country/Sub-region
- 15.1.1 United States
- 15.1.2 Canada
- 15.1.3 Mexico
- 16. MEA Managed Application Services Industry Analysis, Insights and Forecast, 2019-2031
- 16.1. Market Analysis, Insights and Forecast - By Country/Sub-region
- 16.1.1 United Arab Emirates
- 16.1.2 Saudi Arabia
- 16.1.3 South Africa
- 16.1.4 Rest of Middle East and Africa
- 17. Competitive Analysis
- 17.1. Global Market Share Analysis 2024
- 17.2. Company Profiles
- 17.2.1 Wipro Limited
- 17.2.1.1. Overview
- 17.2.1.2. Products
- 17.2.1.3. SWOT Analysis
- 17.2.1.4. Recent Developments
- 17.2.1.5. Financials (Based on Availability)
- 17.2.2 IBM Corporation
- 17.2.2.1. Overview
- 17.2.2.2. Products
- 17.2.2.3. SWOT Analysis
- 17.2.2.4. Recent Developments
- 17.2.2.5. Financials (Based on Availability)
- 17.2.3 CenturyLink Inc
- 17.2.3.1. Overview
- 17.2.3.2. Products
- 17.2.3.3. SWOT Analysis
- 17.2.3.4. Recent Developments
- 17.2.3.5. Financials (Based on Availability)
- 17.2.4 Unisys Corporation
- 17.2.4.1. Overview
- 17.2.4.2. Products
- 17.2.4.3. SWOT Analysis
- 17.2.4.4. Recent Developments
- 17.2.4.5. Financials (Based on Availability)
- 17.2.5 Fujitsu Limited
- 17.2.5.1. Overview
- 17.2.5.2. Products
- 17.2.5.3. SWOT Analysis
- 17.2.5.4. Recent Developments
- 17.2.5.5. Financials (Based on Availability)
- 17.2.6 RACKSPACE INC
- 17.2.6.1. Overview
- 17.2.6.2. Products
- 17.2.6.3. SWOT Analysis
- 17.2.6.4. Recent Developments
- 17.2.6.5. Financials (Based on Availability)
- 17.2.7 DXC Technology Company
- 17.2.7.1. Overview
- 17.2.7.2. Products
- 17.2.7.3. SWOT Analysis
- 17.2.7.4. Recent Developments
- 17.2.7.5. Financials (Based on Availability)
- 17.2.8 Mindtree Limited
- 17.2.8.1. Overview
- 17.2.8.2. Products
- 17.2.8.3. SWOT Analysis
- 17.2.8.4. Recent Developments
- 17.2.8.5. Financials (Based on Availability)
- 17.2.9 HCL Technologies Limited
- 17.2.9.1. Overview
- 17.2.9.2. Products
- 17.2.9.3. SWOT Analysis
- 17.2.9.4. Recent Developments
- 17.2.9.5. Financials (Based on Availability)
- 17.2.10 BMC Software INC
- 17.2.10.1. Overview
- 17.2.10.2. Products
- 17.2.10.3. SWOT Analysis
- 17.2.10.4. Recent Developments
- 17.2.10.5. Financials (Based on Availability)
- 17.2.11 VIRTUSTREAM INC
- 17.2.11.1. Overview
- 17.2.11.2. Products
- 17.2.11.3. SWOT Analysis
- 17.2.11.4. Recent Developments
- 17.2.11.5. Financials (Based on Availability)
- 17.2.1 Wipro Limited
List of Figures
- Figure 1: Global Managed Application Services Industry Revenue Breakdown (Million, %) by Region 2024 & 2032
- Figure 2: North America Managed Application Services Industry Revenue (Million), by Country 2024 & 2032
- Figure 3: North America Managed Application Services Industry Revenue Share (%), by Country 2024 & 2032
- Figure 4: Europe Managed Application Services Industry Revenue (Million), by Country 2024 & 2032
- Figure 5: Europe Managed Application Services Industry Revenue Share (%), by Country 2024 & 2032
- Figure 6: Asia Pacific Managed Application Services Industry Revenue (Million), by Country 2024 & 2032
- Figure 7: Asia Pacific Managed Application Services Industry Revenue Share (%), by Country 2024 & 2032
- Figure 8: South America Managed Application Services Industry Revenue (Million), by Country 2024 & 2032
- Figure 9: South America Managed Application Services Industry Revenue Share (%), by Country 2024 & 2032
- Figure 10: North America Managed Application Services Industry Revenue (Million), by Country 2024 & 2032
- Figure 11: North America Managed Application Services Industry Revenue Share (%), by Country 2024 & 2032
- Figure 12: MEA Managed Application Services Industry Revenue (Million), by Country 2024 & 2032
- Figure 13: MEA Managed Application Services Industry Revenue Share (%), by Country 2024 & 2032
- Figure 14: North America Managed Application Services Industry Revenue (Million), by Organization Size 2024 & 2032
- Figure 15: North America Managed Application Services Industry Revenue Share (%), by Organization Size 2024 & 2032
- Figure 16: North America Managed Application Services Industry Revenue (Million), by End-user Verticals 2024 & 2032
- Figure 17: North America Managed Application Services Industry Revenue Share (%), by End-user Verticals 2024 & 2032
- Figure 18: North America Managed Application Services Industry Revenue (Million), by Country 2024 & 2032
- Figure 19: North America Managed Application Services Industry Revenue Share (%), by Country 2024 & 2032
- Figure 20: Europe Managed Application Services Industry Revenue (Million), by Organization Size 2024 & 2032
- Figure 21: Europe Managed Application Services Industry Revenue Share (%), by Organization Size 2024 & 2032
- Figure 22: Europe Managed Application Services Industry Revenue (Million), by End-user Verticals 2024 & 2032
- Figure 23: Europe Managed Application Services Industry Revenue Share (%), by End-user Verticals 2024 & 2032
- Figure 24: Europe Managed Application Services Industry Revenue (Million), by Country 2024 & 2032
- Figure 25: Europe Managed Application Services Industry Revenue Share (%), by Country 2024 & 2032
- Figure 26: Asia Pacific Managed Application Services Industry Revenue (Million), by Organization Size 2024 & 2032
- Figure 27: Asia Pacific Managed Application Services Industry Revenue Share (%), by Organization Size 2024 & 2032
- Figure 28: Asia Pacific Managed Application Services Industry Revenue (Million), by End-user Verticals 2024 & 2032
- Figure 29: Asia Pacific Managed Application Services Industry Revenue Share (%), by End-user Verticals 2024 & 2032
- Figure 30: Asia Pacific Managed Application Services Industry Revenue (Million), by Country 2024 & 2032
- Figure 31: Asia Pacific Managed Application Services Industry Revenue Share (%), by Country 2024 & 2032
- Figure 32: South America Managed Application Services Industry Revenue (Million), by Organization Size 2024 & 2032
- Figure 33: South America Managed Application Services Industry Revenue Share (%), by Organization Size 2024 & 2032
- Figure 34: South America Managed Application Services Industry Revenue (Million), by End-user Verticals 2024 & 2032
- Figure 35: South America Managed Application Services Industry Revenue Share (%), by End-user Verticals 2024 & 2032
- Figure 36: South America Managed Application Services Industry Revenue (Million), by Country 2024 & 2032
- Figure 37: South America Managed Application Services Industry Revenue Share (%), by Country 2024 & 2032
- Figure 38: Middle East Managed Application Services Industry Revenue (Million), by Organization Size 2024 & 2032
- Figure 39: Middle East Managed Application Services Industry Revenue Share (%), by Organization Size 2024 & 2032
- Figure 40: Middle East Managed Application Services Industry Revenue (Million), by End-user Verticals 2024 & 2032
- Figure 41: Middle East Managed Application Services Industry Revenue Share (%), by End-user Verticals 2024 & 2032
- Figure 42: Middle East Managed Application Services Industry Revenue (Million), by Country 2024 & 2032
- Figure 43: Middle East Managed Application Services Industry Revenue Share (%), by Country 2024 & 2032
List of Tables
- Table 1: Global Managed Application Services Industry Revenue Million Forecast, by Region 2019 & 2032
- Table 2: Global Managed Application Services Industry Revenue Million Forecast, by Organization Size 2019 & 2032
- Table 3: Global Managed Application Services Industry Revenue Million Forecast, by End-user Verticals 2019 & 2032
- Table 4: Global Managed Application Services Industry Revenue Million Forecast, by Region 2019 & 2032
- Table 5: Global Managed Application Services Industry Revenue Million Forecast, by Country 2019 & 2032
- Table 6: United States Managed Application Services Industry Revenue (Million) Forecast, by Application 2019 & 2032
- Table 7: Canada Managed Application Services Industry Revenue (Million) Forecast, by Application 2019 & 2032
- Table 8: Mexico Managed Application Services Industry Revenue (Million) Forecast, by Application 2019 & 2032
- Table 9: Global Managed Application Services Industry Revenue Million Forecast, by Country 2019 & 2032
- Table 10: Germany Managed Application Services Industry Revenue (Million) Forecast, by Application 2019 & 2032
- Table 11: United Kingdom Managed Application Services Industry Revenue (Million) Forecast, by Application 2019 & 2032
- Table 12: France Managed Application Services Industry Revenue (Million) Forecast, by Application 2019 & 2032
- Table 13: Spain Managed Application Services Industry Revenue (Million) Forecast, by Application 2019 & 2032
- Table 14: Italy Managed Application Services Industry Revenue (Million) Forecast, by Application 2019 & 2032
- Table 15: Spain Managed Application Services Industry Revenue (Million) Forecast, by Application 2019 & 2032
- Table 16: Belgium Managed Application Services Industry Revenue (Million) Forecast, by Application 2019 & 2032
- Table 17: Netherland Managed Application Services Industry Revenue (Million) Forecast, by Application 2019 & 2032
- Table 18: Nordics Managed Application Services Industry Revenue (Million) Forecast, by Application 2019 & 2032
- Table 19: Rest of Europe Managed Application Services Industry Revenue (Million) Forecast, by Application 2019 & 2032
- Table 20: Global Managed Application Services Industry Revenue Million Forecast, by Country 2019 & 2032
- Table 21: China Managed Application Services Industry Revenue (Million) Forecast, by Application 2019 & 2032
- Table 22: Japan Managed Application Services Industry Revenue (Million) Forecast, by Application 2019 & 2032
- Table 23: India Managed Application Services Industry Revenue (Million) Forecast, by Application 2019 & 2032
- Table 24: South Korea Managed Application Services Industry Revenue (Million) Forecast, by Application 2019 & 2032
- Table 25: Southeast Asia Managed Application Services Industry Revenue (Million) Forecast, by Application 2019 & 2032
- Table 26: Australia Managed Application Services Industry Revenue (Million) Forecast, by Application 2019 & 2032
- Table 27: Indonesia Managed Application Services Industry Revenue (Million) Forecast, by Application 2019 & 2032
- Table 28: Phillipes Managed Application Services Industry Revenue (Million) Forecast, by Application 2019 & 2032
- Table 29: Singapore Managed Application Services Industry Revenue (Million) Forecast, by Application 2019 & 2032
- Table 30: Thailandc Managed Application Services Industry Revenue (Million) Forecast, by Application 2019 & 2032
- Table 31: Rest of Asia Pacific Managed Application Services Industry Revenue (Million) Forecast, by Application 2019 & 2032
- Table 32: Global Managed Application Services Industry Revenue Million Forecast, by Country 2019 & 2032
- Table 33: Brazil Managed Application Services Industry Revenue (Million) Forecast, by Application 2019 & 2032
- Table 34: Argentina Managed Application Services Industry Revenue (Million) Forecast, by Application 2019 & 2032
- Table 35: Peru Managed Application Services Industry Revenue (Million) Forecast, by Application 2019 & 2032
- Table 36: Chile Managed Application Services Industry Revenue (Million) Forecast, by Application 2019 & 2032
- Table 37: Colombia Managed Application Services Industry Revenue (Million) Forecast, by Application 2019 & 2032
- Table 38: Ecuador Managed Application Services Industry Revenue (Million) Forecast, by Application 2019 & 2032
- Table 39: Venezuela Managed Application Services Industry Revenue (Million) Forecast, by Application 2019 & 2032
- Table 40: Rest of South America Managed Application Services Industry Revenue (Million) Forecast, by Application 2019 & 2032
- Table 41: Global Managed Application Services Industry Revenue Million Forecast, by Country 2019 & 2032
- Table 42: United States Managed Application Services Industry Revenue (Million) Forecast, by Application 2019 & 2032
- Table 43: Canada Managed Application Services Industry Revenue (Million) Forecast, by Application 2019 & 2032
- Table 44: Mexico Managed Application Services Industry Revenue (Million) Forecast, by Application 2019 & 2032
- Table 45: Global Managed Application Services Industry Revenue Million Forecast, by Country 2019 & 2032
- Table 46: United Arab Emirates Managed Application Services Industry Revenue (Million) Forecast, by Application 2019 & 2032
- Table 47: Saudi Arabia Managed Application Services Industry Revenue (Million) Forecast, by Application 2019 & 2032
- Table 48: South Africa Managed Application Services Industry Revenue (Million) Forecast, by Application 2019 & 2032
- Table 49: Rest of Middle East and Africa Managed Application Services Industry Revenue (Million) Forecast, by Application 2019 & 2032
- Table 50: Global Managed Application Services Industry Revenue Million Forecast, by Organization Size 2019 & 2032
- Table 51: Global Managed Application Services Industry Revenue Million Forecast, by End-user Verticals 2019 & 2032
- Table 52: Global Managed Application Services Industry Revenue Million Forecast, by Country 2019 & 2032
- Table 53: United States Managed Application Services Industry Revenue (Million) Forecast, by Application 2019 & 2032
- Table 54: Canada Managed Application Services Industry Revenue (Million) Forecast, by Application 2019 & 2032
- Table 55: Mexico Managed Application Services Industry Revenue (Million) Forecast, by Application 2019 & 2032
- Table 56: Rest of North America Managed Application Services Industry Revenue (Million) Forecast, by Application 2019 & 2032
- Table 57: Global Managed Application Services Industry Revenue Million Forecast, by Organization Size 2019 & 2032
- Table 58: Global Managed Application Services Industry Revenue Million Forecast, by End-user Verticals 2019 & 2032
- Table 59: Global Managed Application Services Industry Revenue Million Forecast, by Country 2019 & 2032
- Table 60: Germany Managed Application Services Industry Revenue (Million) Forecast, by Application 2019 & 2032
- Table 61: United Kingdom Managed Application Services Industry Revenue (Million) Forecast, by Application 2019 & 2032
- Table 62: France Managed Application Services Industry Revenue (Million) Forecast, by Application 2019 & 2032
- Table 63: Russia Managed Application Services Industry Revenue (Million) Forecast, by Application 2019 & 2032
- Table 64: Spain Managed Application Services Industry Revenue (Million) Forecast, by Application 2019 & 2032
- Table 65: Rest of Europe Managed Application Services Industry Revenue (Million) Forecast, by Application 2019 & 2032
- Table 66: Global Managed Application Services Industry Revenue Million Forecast, by Organization Size 2019 & 2032
- Table 67: Global Managed Application Services Industry Revenue Million Forecast, by End-user Verticals 2019 & 2032
- Table 68: Global Managed Application Services Industry Revenue Million Forecast, by Country 2019 & 2032
- Table 69: India Managed Application Services Industry Revenue (Million) Forecast, by Application 2019 & 2032
- Table 70: China Managed Application Services Industry Revenue (Million) Forecast, by Application 2019 & 2032
- Table 71: Japan Managed Application Services Industry Revenue (Million) Forecast, by Application 2019 & 2032
- Table 72: Rest of Asia Pacific Managed Application Services Industry Revenue (Million) Forecast, by Application 2019 & 2032
- Table 73: Global Managed Application Services Industry Revenue Million Forecast, by Organization Size 2019 & 2032
- Table 74: Global Managed Application Services Industry Revenue Million Forecast, by End-user Verticals 2019 & 2032
- Table 75: Global Managed Application Services Industry Revenue Million Forecast, by Country 2019 & 2032
- Table 76: Brazil Managed Application Services Industry Revenue (Million) Forecast, by Application 2019 & 2032
- Table 77: Argentina Managed Application Services Industry Revenue (Million) Forecast, by Application 2019 & 2032
- Table 78: Global Managed Application Services Industry Revenue Million Forecast, by Organization Size 2019 & 2032
- Table 79: Global Managed Application Services Industry Revenue Million Forecast, by End-user Verticals 2019 & 2032
- Table 80: Global Managed Application Services Industry Revenue Million Forecast, by Country 2019 & 2032
- Table 81: United Arab Emirates Managed Application Services Industry Revenue (Million) Forecast, by Application 2019 & 2032
- Table 82: Saudi Arabia Managed Application Services Industry Revenue (Million) Forecast, by Application 2019 & 2032
- Table 83: Rest of Middle East Managed Application Services Industry Revenue (Million) Forecast, by Application 2019 & 2032
Frequently Asked Questions
1. What is the projected Compound Annual Growth Rate (CAGR) of the Managed Application Services Industry?
The projected CAGR is approximately 1.86%.
2. Which companies are prominent players in the Managed Application Services Industry?
Key companies in the market include Wipro Limited, IBM Corporation, CenturyLink Inc, Unisys Corporation, Fujitsu Limited, RACKSPACE INC, DXC Technology Company, Mindtree Limited, HCL Technologies Limited, BMC Software INC, VIRTUSTREAM INC.
3. What are the main segments of the Managed Application Services Industry?
The market segments include Organization Size, End-user Verticals.
4. Can you provide details about the market size?
The market size is estimated to be USD 11.13 Million as of 2022.
5. What are some drivers contributing to market growth?
Increased demand for end-to-end application hosting; The requirement to improve and secure critical business applications; Increase in the level of application infrastructure.
6. What are the notable trends driving market growth?
IT and Telecom is Expected to Hold Major Share.
7. Are there any restraints impacting market growth?
Security risks associated with application data.
8. Can you provide examples of recent developments in the market?
June 2022 - AWS Managed Services (AMS) Accelerate a new cloud operations offering that assists customers in achieving operational excellence regardless of their cloud journey. Accelerate can run any workload on Amazon Web Services (AWS) while giving customers complete access to all AWS services. AWS services such as AWS Systems Manager, Amazon CloudWatch, Amazon GuardDuty, and AWS Config are used by Accelerate for operations and security.
9. What pricing options are available for accessing the report?
Pricing options include single-user, multi-user, and enterprise licenses priced at USD 4750, USD 5250, and USD 8750 respectively.
10. Is the market size provided in terms of value or volume?
The market size is provided in terms of value, measured in Million.
11. Are there any specific market keywords associated with the report?
Yes, the market keyword associated with the report is "Managed Application Services Industry," which aids in identifying and referencing the specific market segment covered.
12. How do I determine which pricing option suits my needs best?
The pricing options vary based on user requirements and access needs. Individual users may opt for single-user licenses, while businesses requiring broader access may choose multi-user or enterprise licenses for cost-effective access to the report.
13. Are there any additional resources or data provided in the Managed Application Services Industry report?
While the report offers comprehensive insights, it's advisable to review the specific contents or supplementary materials provided to ascertain if additional resources or data are available.
14. How can I stay updated on further developments or reports in the Managed Application Services Industry?
To stay informed about further developments, trends, and reports in the Managed Application Services Industry, consider subscribing to industry newsletters, following relevant companies and organizations, or regularly checking reputable industry news sources and publications.
Methodology
Step 1 - Identification of Relevant Samples Size from Population Database


Step 2 - Approaches for Defining Global Market Size (Value, Volume* & Price*)

Note*: In applicable scenarios
Step 3 - Data Sources
Primary Research
- Web Analytics
- Survey Reports
- Research Institute
- Latest Research Reports
- Opinion Leaders
Secondary Research
- Annual Reports
- White Paper
- Latest Press Release
- Industry Association
- Paid Database
- Investor Presentations

Step 4 - Data Triangulation
Involves using different sources of information in order to increase the validity of a study
These sources are likely to be stakeholders in a program - participants, other researchers, program staff, other community members, and so on.
Then we put all data in single framework & apply various statistical tools to find out the dynamic on the market.
During the analysis stage, feedback from the stakeholder groups would be compared to determine areas of agreement as well as areas of divergence


