
Key Insights
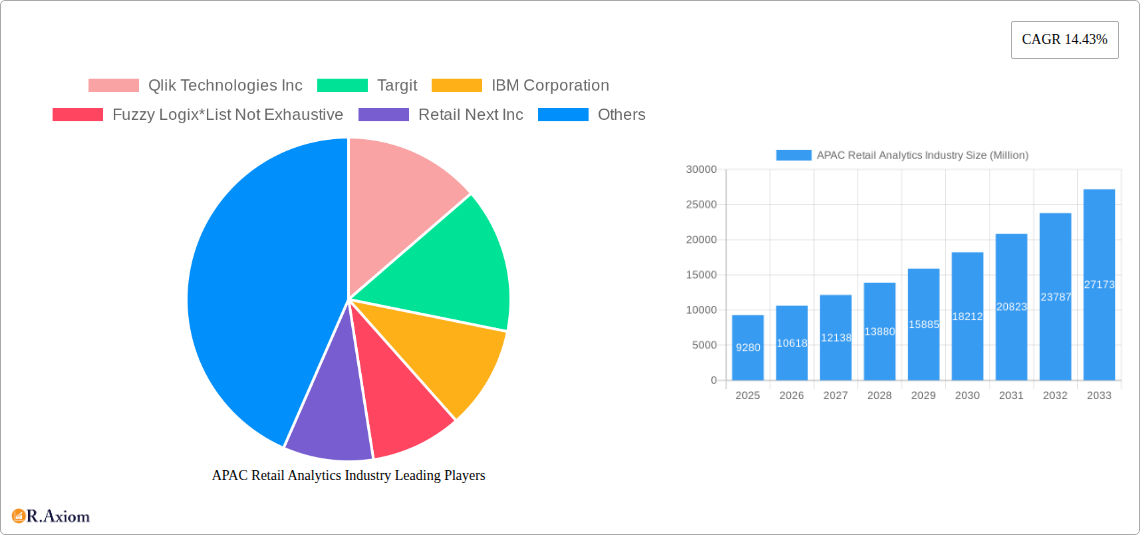
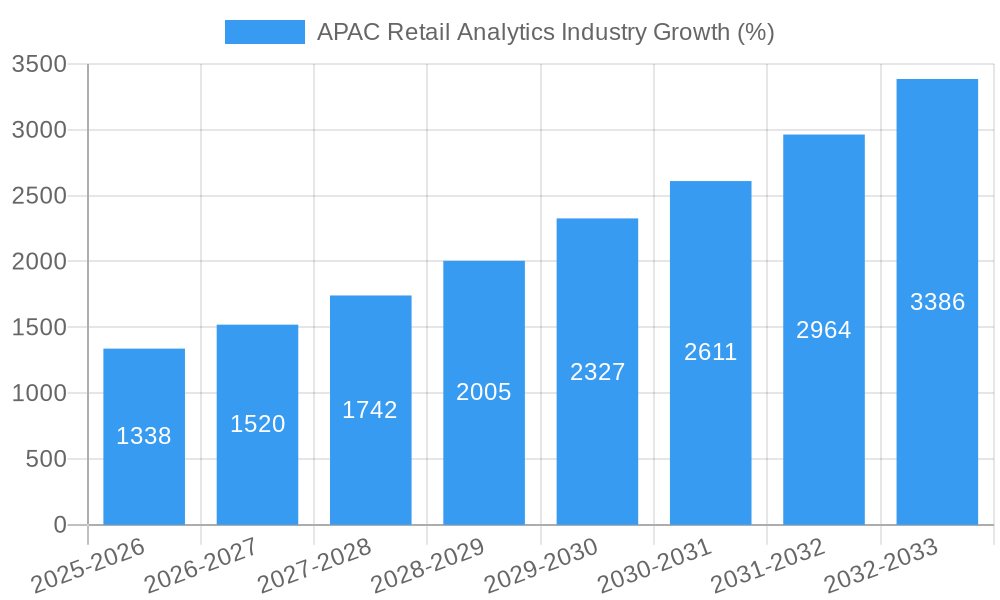
The Asia-Pacific (APAC) retail analytics market, valued at $9.28 billion in 2025, is experiencing robust growth, projected to expand at a Compound Annual Growth Rate (CAGR) of 14.43% from 2025 to 2033. This surge is driven by the increasing adoption of data-driven decision-making among small and medium enterprises (SMEs) and large-scale organizations across the region. The preference for on-demand solutions, coupled with the rising need for advanced analytics capabilities in areas like supply chain management, marketing optimization, and fraud detection, fuels this expansion. Specific segments like merchandising (assortment optimization and shopper path analytics) and financial management (accounts management) are expected to see particularly strong growth due to the potential for improved profitability and operational efficiency. The presence of established players like IBM, SAP, and Tableau, alongside emerging regional competitors, creates a dynamic and competitive landscape fostering innovation and accessibility of retail analytics tools. Growth is particularly evident in countries like China, India, and Japan, reflecting the region's increasing digitalization and the expanding e-commerce sector.
While the APAC market demonstrates considerable potential, certain challenges persist. Data security concerns and the need for skilled professionals to interpret and utilize the generated insights can hinder wider adoption. Furthermore, the varying levels of digital maturity across different APAC nations pose a hurdle, especially in smaller markets with limited digital infrastructure. Nevertheless, the overall market trajectory remains positive, fueled by ongoing investments in technology, increasing consumer data availability, and a growing awareness of the significant return on investment (ROI) associated with effective retail analytics. This translates into lucrative opportunities for businesses offering solutions across various deployment modes (on-premise and on-demand) and module types, ranging from strategy planning to supply chain optimization. The market's sustained expansion reflects a fundamental shift towards data-centric strategies within the APAC retail sector.
This comprehensive report provides an in-depth analysis of the APAC Retail Analytics industry, covering the period from 2019 to 2033. It delves into market dynamics, competitive landscapes, growth drivers, and emerging opportunities, offering valuable insights for stakeholders across the value chain. The report utilizes extensive data analysis, incorporating both historical and forecast data to provide actionable intelligence for informed decision-making. The base year for this report is 2025, with the forecast period extending to 2033. The estimated market size for 2025 is xx Million.
APAC Retail Analytics Industry Market Concentration & Innovation
The APAC retail analytics market exhibits a moderately concentrated landscape, with several large players holding significant market share. Key players such as Qlik Technologies Inc, IBM Corporation, SAP SE, Oracle Corporation, and Adobe Systems Incorporated dominate the market, leveraging their established brand presence and extensive product portfolios. However, a growing number of niche players and startups are emerging, fostering innovation and competition. The market share of these leading companies is estimated to be approximately xx% in 2025, with the remaining share distributed among smaller players.
Innovation is driven by advancements in big data analytics, artificial intelligence (AI), and cloud computing. These technologies enable retailers to gain deeper insights into customer behavior, optimize pricing strategies, personalize marketing campaigns, and streamline supply chain operations. Regulatory frameworks, such as data privacy regulations, are shaping the industry's development and influencing the adoption of analytics solutions. The increasing use of mobile devices and e-commerce platforms is driving the demand for advanced analytics capabilities, while product substitutes, such as traditional market research methods, face declining relevance. Furthermore, the retail sector is witnessing increased M&A activity, with deal values averaging xx Million in recent years. Examples include the investment by Maxis in ComeBy (detailed in the Key Developments section).
APAC Retail Analytics Industry Industry Trends & Insights
The APAC retail analytics market is experiencing robust growth, driven by several key factors. The rising adoption of e-commerce and omnichannel strategies is compelling retailers to utilize data-driven insights for improved customer experience and operational efficiency. The increasing availability of data from various sources, including point-of-sale (POS) systems, loyalty programs, and social media, fuels the growth of analytics solutions. Technological disruptions, such as the proliferation of AI and machine learning algorithms, are transforming the industry by enabling more sophisticated analytics and predictive capabilities. Consumer preferences for personalized experiences and seamless shopping journeys are driving the demand for advanced analytics to understand and cater to individual customer needs. This is further supported by changing consumer behavior and preferences, influencing demand for personalized offers and experiences. The market exhibits a strong competitive dynamic, with players vying for market share through product innovation, strategic partnerships, and acquisitions. The CAGR for the APAC retail analytics market is projected to be xx% during the forecast period (2025-2033), with market penetration exceeding xx% by 2033.
Dominant Markets & Segments in APAC Retail Analytics Industry
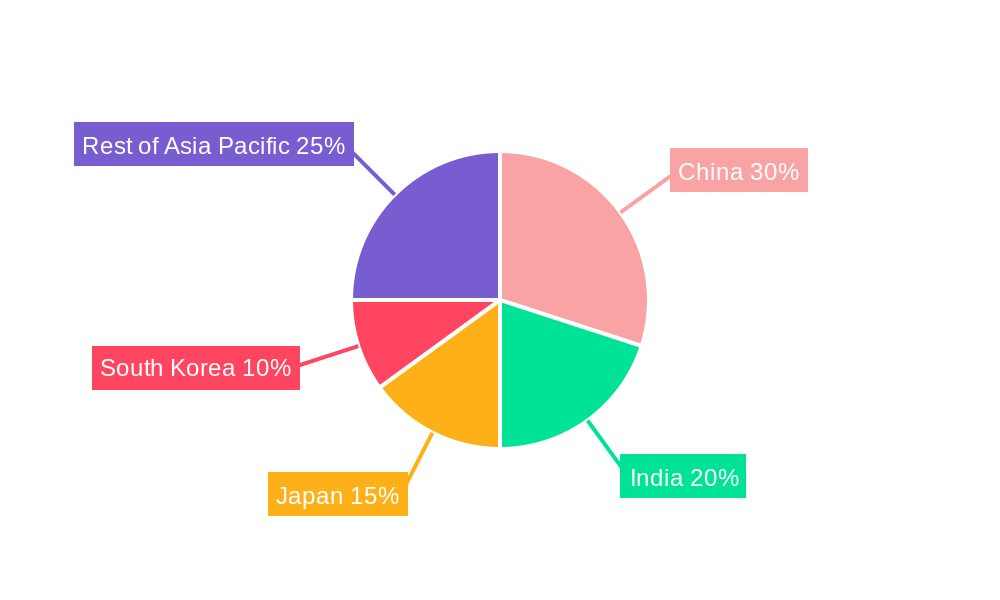
Dominant Regions and Countries: China and India are the leading markets within APAC, driven by their large retail sectors and increasing digital adoption. Other key markets include Japan, Australia, and Singapore.
Dominant Segments:
- By Business Type: Large-scale organizations dominate the market due to their higher budgets and greater need for sophisticated analytics solutions. However, the SME segment is exhibiting strong growth potential, driven by the increasing availability of affordable and user-friendly analytics tools.
- By Mode of Deployment: On-demand solutions are gaining traction due to their scalability, flexibility, and cost-effectiveness. However, on-premise solutions remain relevant for enterprises with stringent data security requirements.
- By Type: Solutions (Analytics, Visualization Tools, Data Management) constitute a larger market share compared to services (Integration, Support & Consulting). This is primarily driven by the increasing demand for comprehensive analytics platforms offering various functionalities.
- By Module Type: Marketing (Pricing, Loyalty, and Segment Analysis) and Supply Chain Management (Inventory, Vendor, and Supply-Demand Modelling) modules are experiencing significant growth due to their direct impact on revenue generation and operational efficiency. Store operations modules are also gaining importance due to the increasing focus on optimizing in-store operations and enhancing customer experience. Other modules, like financial management and strategy and planning also contribute to a substantial share of the market.
Key Drivers:
- Rapid economic growth across APAC.
- Expanding e-commerce and omnichannel retail strategies.
- Increasing adoption of mobile technologies and social media.
- Government initiatives promoting digitalization and technological advancement.
- Robust investments in infrastructure development.
APAC Retail Analytics Industry Product Developments
Recent product innovations focus on AI-powered predictive analytics, advanced visualization tools, and integrated data management platforms. These developments enhance the ability of retailers to gain actionable insights from large datasets, personalize customer experiences, optimize pricing and promotions, and improve supply chain efficiency. The market is witnessing a shift towards cloud-based solutions and SaaS offerings, which provide scalability, flexibility, and cost-effectiveness. The competitive advantage lies in providing user-friendly interfaces, robust analytics capabilities, and seamless integration with existing retail systems.
Report Scope & Segmentation Analysis
This report comprehensively analyzes the APAC retail analytics market across various segments:
By Business Type: Small and Medium Enterprises (SMEs) and Large-scale Organizations. The report provides detailed insights into the growth projections and market sizes for each segment, highlighting competitive dynamics.
By Mode of Deployment: On-Premise and On-Demand. The report explores the advantages and disadvantages of each deployment model and analyses market trends.
By Type: Solutions (Analytics, Visualization Tools, Data Management, etc.) and Services (Integration, Support & Consulting). The report provides growth projections and market sizes for each type.
By Module Type: Strategy & Planning, Marketing, Financial Management, Store Operations, Merchandising, Supply Chain Management, and Other Module Types. The report details market sizes and growth forecasts for each module. Competitive dynamics are also analysed across all these segments.
Key Drivers of APAC Retail Analytics Growth
The APAC retail analytics industry's growth is fueled by several key factors: the rapid expansion of e-commerce, the increasing adoption of omnichannel strategies, the surge in mobile and social media usage, government initiatives promoting digitalization, and substantial investments in infrastructure development. The availability of large datasets from various sources and advancements in AI and machine learning are also driving innovation and adoption. The rising need for personalized customer experiences and improved operational efficiency further propels market growth.
Challenges in the APAC Retail Analytics Industry Sector
The industry faces challenges such as data security concerns, the complexity of integrating diverse data sources, the need for skilled analytics professionals, and the high cost of implementing advanced analytics solutions. Furthermore, data privacy regulations pose significant hurdles for data collection and analysis. Competitive pressures from established players and emerging startups also impact profitability. These challenges impact market growth by imposing constraints and increasing implementation costs for many companies.
Emerging Opportunities in APAP Retail Analytics Industry
Emerging opportunities include the growing adoption of AI and machine learning, the potential of IoT-enabled devices in retail settings, and the increasing demand for predictive analytics in areas such as fraud detection and supply chain optimization. New markets in Southeast Asia are also ripe for expansion. The development of specialized analytics solutions for specific retail verticals, such as fashion or grocery, presents further growth potential.
Leading Players in the APAC Retail Analytics Industry Market
- Qlik Technologies Inc
- Targit
- IBM Corporation
- Fuzzy Logix
- Retail Next Inc
- Adobe Systems Incorporated
- Pentaho Corporation
- Microstrategy Inc
- Zoho Corporation
- Tableau Software Inc
- Alteryx Inc
- Oracle Corporation
- ZAP Business Intelligence
- SAP SE
- Prevedere Software Inc
Key Developments in APAC Retail Analytics Industry
- June 2022: Amazon launched Store Analytics, providing CPG companies with aggregated, anonymous insights into consumer product interactions in Amazon Go and Amazon Fresh stores.
- August 2022: Maxis invested in ComeBy, a Malaysian retail analytics startup focusing on in-store shopper preference insights.
Strategic Outlook for APAC Retail Analytics Market
The APAC retail analytics market is poised for sustained growth, driven by continuous technological advancements, expanding e-commerce adoption, and the increasing focus on data-driven decision-making within the retail sector. The emergence of new technologies like AI and IoT will create new opportunities for innovation and market expansion. Companies that can effectively leverage these technologies and adapt to evolving consumer preferences will be best positioned for success in this dynamic market. The continued growth of the APAC region and ongoing investment in retail infrastructure will further fuel market expansion.
APAC Retail Analytics Industry Segmentation
-
1. Mode of Deployment
- 1.1. On-Premise
- 1.2. On-Demand
-
2. Type
- 2.1. Solution
- 2.2. Services (Integration, Support & Consulting)
-
3. Module Type
- 3.1. Strategy
- 3.2. Marketing (Pricing, Loyalty and Segment Analysis)
- 3.3. Financial Management (Accounts Management)
- 3.4. Store Op
- 3.5. Merchand
- 3.6. Supply C
- 3.7. Other Module Types
-
4. Business Type
- 4.1. Small and Medium Enterprises
- 4.2. Large-scale Organizations
-
5. Geography
- 5.1. China
- 5.2. India
- 5.3. Japan
- 5.4. South Korea
APAC Retail Analytics Industry Segmentation By Geography
- 1. China
- 2. India
- 3. Japan
- 4. South Korea
APAC Retail Analytics Industry REPORT HIGHLIGHTS
| Aspects | Details |
|---|---|
| Study Period | 2019-2033 |
| Base Year | 2024 |
| Estimated Year | 2025 |
| Forecast Period | 2025-2033 |
| Historical Period | 2019-2024 |
| Growth Rate | CAGR of 14.43% from 2019-2033 |
| Segmentation |
|
Table of Contents
- 1. Introduction
- 1.1. Research Scope
- 1.2. Market Segmentation
- 1.3. Research Methodology
- 1.4. Definitions and Assumptions
- 2. Executive Summary
- 2.1. Introduction
- 3. Market Dynamics
- 3.1. Introduction
- 3.2. Market Drivers
- 3.2.1. Increased Emphasis on Predictive Analysis; Sustained increase in volume of data; Growing demand for sales forecasting
- 3.3. Market Restrains
- 3.3.1. Lack of general awareness and expertise in emerging regions; Standardization and Integration issues
- 3.4. Market Trends
- 3.4.1. Solutions Segment is Anticipated to Hold Major Market Share
- 4. Market Factor Analysis
- 4.1. Porters Five Forces
- 4.2. Supply/Value Chain
- 4.3. PESTEL analysis
- 4.4. Market Entropy
- 4.5. Patent/Trademark Analysis
- 5. APAC Retail Analytics Industry Analysis, Insights and Forecast, 2019-2031
- 5.1. Market Analysis, Insights and Forecast - by Mode of Deployment
- 5.1.1. On-Premise
- 5.1.2. On-Demand
- 5.2. Market Analysis, Insights and Forecast - by Type
- 5.2.1. Solution
- 5.2.2. Services (Integration, Support & Consulting)
- 5.3. Market Analysis, Insights and Forecast - by Module Type
- 5.3.1. Strategy
- 5.3.2. Marketing (Pricing, Loyalty and Segment Analysis)
- 5.3.3. Financial Management (Accounts Management)
- 5.3.4. Store Op
- 5.3.5. Merchand
- 5.3.6. Supply C
- 5.3.7. Other Module Types
- 5.4. Market Analysis, Insights and Forecast - by Business Type
- 5.4.1. Small and Medium Enterprises
- 5.4.2. Large-scale Organizations
- 5.5. Market Analysis, Insights and Forecast - by Geography
- 5.5.1. China
- 5.5.2. India
- 5.5.3. Japan
- 5.5.4. South Korea
- 5.6. Market Analysis, Insights and Forecast - by Region
- 5.6.1. China
- 5.6.2. India
- 5.6.3. Japan
- 5.6.4. South Korea
- 5.1. Market Analysis, Insights and Forecast - by Mode of Deployment
- 6. China APAC Retail Analytics Industry Analysis, Insights and Forecast, 2019-2031
- 6.1. Market Analysis, Insights and Forecast - by Mode of Deployment
- 6.1.1. On-Premise
- 6.1.2. On-Demand
- 6.2. Market Analysis, Insights and Forecast - by Type
- 6.2.1. Solution
- 6.2.2. Services (Integration, Support & Consulting)
- 6.3. Market Analysis, Insights and Forecast - by Module Type
- 6.3.1. Strategy
- 6.3.2. Marketing (Pricing, Loyalty and Segment Analysis)
- 6.3.3. Financial Management (Accounts Management)
- 6.3.4. Store Op
- 6.3.5. Merchand
- 6.3.6. Supply C
- 6.3.7. Other Module Types
- 6.4. Market Analysis, Insights and Forecast - by Business Type
- 6.4.1. Small and Medium Enterprises
- 6.4.2. Large-scale Organizations
- 6.5. Market Analysis, Insights and Forecast - by Geography
- 6.5.1. China
- 6.5.2. India
- 6.5.3. Japan
- 6.5.4. South Korea
- 6.1. Market Analysis, Insights and Forecast - by Mode of Deployment
- 7. India APAC Retail Analytics Industry Analysis, Insights and Forecast, 2019-2031
- 7.1. Market Analysis, Insights and Forecast - by Mode of Deployment
- 7.1.1. On-Premise
- 7.1.2. On-Demand
- 7.2. Market Analysis, Insights and Forecast - by Type
- 7.2.1. Solution
- 7.2.2. Services (Integration, Support & Consulting)
- 7.3. Market Analysis, Insights and Forecast - by Module Type
- 7.3.1. Strategy
- 7.3.2. Marketing (Pricing, Loyalty and Segment Analysis)
- 7.3.3. Financial Management (Accounts Management)
- 7.3.4. Store Op
- 7.3.5. Merchand
- 7.3.6. Supply C
- 7.3.7. Other Module Types
- 7.4. Market Analysis, Insights and Forecast - by Business Type
- 7.4.1. Small and Medium Enterprises
- 7.4.2. Large-scale Organizations
- 7.5. Market Analysis, Insights and Forecast - by Geography
- 7.5.1. China
- 7.5.2. India
- 7.5.3. Japan
- 7.5.4. South Korea
- 7.1. Market Analysis, Insights and Forecast - by Mode of Deployment
- 8. Japan APAC Retail Analytics Industry Analysis, Insights and Forecast, 2019-2031
- 8.1. Market Analysis, Insights and Forecast - by Mode of Deployment
- 8.1.1. On-Premise
- 8.1.2. On-Demand
- 8.2. Market Analysis, Insights and Forecast - by Type
- 8.2.1. Solution
- 8.2.2. Services (Integration, Support & Consulting)
- 8.3. Market Analysis, Insights and Forecast - by Module Type
- 8.3.1. Strategy
- 8.3.2. Marketing (Pricing, Loyalty and Segment Analysis)
- 8.3.3. Financial Management (Accounts Management)
- 8.3.4. Store Op
- 8.3.5. Merchand
- 8.3.6. Supply C
- 8.3.7. Other Module Types
- 8.4. Market Analysis, Insights and Forecast - by Business Type
- 8.4.1. Small and Medium Enterprises
- 8.4.2. Large-scale Organizations
- 8.5. Market Analysis, Insights and Forecast - by Geography
- 8.5.1. China
- 8.5.2. India
- 8.5.3. Japan
- 8.5.4. South Korea
- 8.1. Market Analysis, Insights and Forecast - by Mode of Deployment
- 9. South Korea APAC Retail Analytics Industry Analysis, Insights and Forecast, 2019-2031
- 9.1. Market Analysis, Insights and Forecast - by Mode of Deployment
- 9.1.1. On-Premise
- 9.1.2. On-Demand
- 9.2. Market Analysis, Insights and Forecast - by Type
- 9.2.1. Solution
- 9.2.2. Services (Integration, Support & Consulting)
- 9.3. Market Analysis, Insights and Forecast - by Module Type
- 9.3.1. Strategy
- 9.3.2. Marketing (Pricing, Loyalty and Segment Analysis)
- 9.3.3. Financial Management (Accounts Management)
- 9.3.4. Store Op
- 9.3.5. Merchand
- 9.3.6. Supply C
- 9.3.7. Other Module Types
- 9.4. Market Analysis, Insights and Forecast - by Business Type
- 9.4.1. Small and Medium Enterprises
- 9.4.2. Large-scale Organizations
- 9.5. Market Analysis, Insights and Forecast - by Geography
- 9.5.1. China
- 9.5.2. India
- 9.5.3. Japan
- 9.5.4. South Korea
- 9.1. Market Analysis, Insights and Forecast - by Mode of Deployment
- 10. China APAC Retail Analytics Industry Analysis, Insights and Forecast, 2019-2031
- 10.1. Market Analysis, Insights and Forecast - By Country/Sub-region
- 10.1.1.
- 11. India APAC Retail Analytics Industry Analysis, Insights and Forecast, 2019-2031
- 11.1. Market Analysis, Insights and Forecast - By Country/Sub-region
- 11.1.1.
- 12. Japan APAC Retail Analytics Industry Analysis, Insights and Forecast, 2019-2031
- 12.1. Market Analysis, Insights and Forecast - By Country/Sub-region
- 12.1.1.
- 13. South Korea APAC Retail Analytics Industry Analysis, Insights and Forecast, 2019-2031
- 13.1. Market Analysis, Insights and Forecast - By Country/Sub-region
- 13.1.1.
- 14. Rest of Asia Pacific APAC Retail Analytics Industry Analysis, Insights and Forecast, 2019-2031
- 14.1. Market Analysis, Insights and Forecast - By Country/Sub-region
- 14.1.1.
- 15. Competitive Analysis
- 15.1. Market Share Analysis 2024
- 15.2. Company Profiles
- 15.2.1 Qlik Technologies Inc
- 15.2.1.1. Overview
- 15.2.1.2. Products
- 15.2.1.3. SWOT Analysis
- 15.2.1.4. Recent Developments
- 15.2.1.5. Financials (Based on Availability)
- 15.2.2 Targit
- 15.2.2.1. Overview
- 15.2.2.2. Products
- 15.2.2.3. SWOT Analysis
- 15.2.2.4. Recent Developments
- 15.2.2.5. Financials (Based on Availability)
- 15.2.3 IBM Corporation
- 15.2.3.1. Overview
- 15.2.3.2. Products
- 15.2.3.3. SWOT Analysis
- 15.2.3.4. Recent Developments
- 15.2.3.5. Financials (Based on Availability)
- 15.2.4 Fuzzy Logix*List Not Exhaustive
- 15.2.4.1. Overview
- 15.2.4.2. Products
- 15.2.4.3. SWOT Analysis
- 15.2.4.4. Recent Developments
- 15.2.4.5. Financials (Based on Availability)
- 15.2.5 Retail Next Inc
- 15.2.5.1. Overview
- 15.2.5.2. Products
- 15.2.5.3. SWOT Analysis
- 15.2.5.4. Recent Developments
- 15.2.5.5. Financials (Based on Availability)
- 15.2.6 Adobe Systems Incorporated
- 15.2.6.1. Overview
- 15.2.6.2. Products
- 15.2.6.3. SWOT Analysis
- 15.2.6.4. Recent Developments
- 15.2.6.5. Financials (Based on Availability)
- 15.2.7 Pentaho Corporation
- 15.2.7.1. Overview
- 15.2.7.2. Products
- 15.2.7.3. SWOT Analysis
- 15.2.7.4. Recent Developments
- 15.2.7.5. Financials (Based on Availability)
- 15.2.8 Microstrategy Inc
- 15.2.8.1. Overview
- 15.2.8.2. Products
- 15.2.8.3. SWOT Analysis
- 15.2.8.4. Recent Developments
- 15.2.8.5. Financials (Based on Availability)
- 15.2.9 Zoho Corporation
- 15.2.9.1. Overview
- 15.2.9.2. Products
- 15.2.9.3. SWOT Analysis
- 15.2.9.4. Recent Developments
- 15.2.9.5. Financials (Based on Availability)
- 15.2.10 Tableau Software Inc
- 15.2.10.1. Overview
- 15.2.10.2. Products
- 15.2.10.3. SWOT Analysis
- 15.2.10.4. Recent Developments
- 15.2.10.5. Financials (Based on Availability)
- 15.2.11 Alteryx Inc
- 15.2.11.1. Overview
- 15.2.11.2. Products
- 15.2.11.3. SWOT Analysis
- 15.2.11.4. Recent Developments
- 15.2.11.5. Financials (Based on Availability)
- 15.2.12 Oracle Corporation
- 15.2.12.1. Overview
- 15.2.12.2. Products
- 15.2.12.3. SWOT Analysis
- 15.2.12.4. Recent Developments
- 15.2.12.5. Financials (Based on Availability)
- 15.2.13 ZAP Business Intelligence
- 15.2.13.1. Overview
- 15.2.13.2. Products
- 15.2.13.3. SWOT Analysis
- 15.2.13.4. Recent Developments
- 15.2.13.5. Financials (Based on Availability)
- 15.2.14 SAP SE
- 15.2.14.1. Overview
- 15.2.14.2. Products
- 15.2.14.3. SWOT Analysis
- 15.2.14.4. Recent Developments
- 15.2.14.5. Financials (Based on Availability)
- 15.2.15 Prevedere Software Inc
- 15.2.15.1. Overview
- 15.2.15.2. Products
- 15.2.15.3. SWOT Analysis
- 15.2.15.4. Recent Developments
- 15.2.15.5. Financials (Based on Availability)
- 15.2.1 Qlik Technologies Inc
List of Figures
- Figure 1: APAC Retail Analytics Industry Revenue Breakdown (Million, %) by Product 2024 & 2032
- Figure 2: APAC Retail Analytics Industry Share (%) by Company 2024
List of Tables
- Table 1: APAC Retail Analytics Industry Revenue Million Forecast, by Region 2019 & 2032
- Table 2: APAC Retail Analytics Industry Revenue Million Forecast, by Mode of Deployment 2019 & 2032
- Table 3: APAC Retail Analytics Industry Revenue Million Forecast, by Type 2019 & 2032
- Table 4: APAC Retail Analytics Industry Revenue Million Forecast, by Module Type 2019 & 2032
- Table 5: APAC Retail Analytics Industry Revenue Million Forecast, by Business Type 2019 & 2032
- Table 6: APAC Retail Analytics Industry Revenue Million Forecast, by Geography 2019 & 2032
- Table 7: APAC Retail Analytics Industry Revenue Million Forecast, by Region 2019 & 2032
- Table 8: APAC Retail Analytics Industry Revenue Million Forecast, by Country 2019 & 2032
- Table 9: APAC Retail Analytics Industry Revenue (Million) Forecast, by Application 2019 & 2032
- Table 10: APAC Retail Analytics Industry Revenue Million Forecast, by Country 2019 & 2032
- Table 11: APAC Retail Analytics Industry Revenue (Million) Forecast, by Application 2019 & 2032
- Table 12: APAC Retail Analytics Industry Revenue Million Forecast, by Country 2019 & 2032
- Table 13: APAC Retail Analytics Industry Revenue (Million) Forecast, by Application 2019 & 2032
- Table 14: APAC Retail Analytics Industry Revenue Million Forecast, by Country 2019 & 2032
- Table 15: APAC Retail Analytics Industry Revenue (Million) Forecast, by Application 2019 & 2032
- Table 16: APAC Retail Analytics Industry Revenue Million Forecast, by Country 2019 & 2032
- Table 17: APAC Retail Analytics Industry Revenue (Million) Forecast, by Application 2019 & 2032
- Table 18: APAC Retail Analytics Industry Revenue Million Forecast, by Mode of Deployment 2019 & 2032
- Table 19: APAC Retail Analytics Industry Revenue Million Forecast, by Type 2019 & 2032
- Table 20: APAC Retail Analytics Industry Revenue Million Forecast, by Module Type 2019 & 2032
- Table 21: APAC Retail Analytics Industry Revenue Million Forecast, by Business Type 2019 & 2032
- Table 22: APAC Retail Analytics Industry Revenue Million Forecast, by Geography 2019 & 2032
- Table 23: APAC Retail Analytics Industry Revenue Million Forecast, by Country 2019 & 2032
- Table 24: APAC Retail Analytics Industry Revenue Million Forecast, by Mode of Deployment 2019 & 2032
- Table 25: APAC Retail Analytics Industry Revenue Million Forecast, by Type 2019 & 2032
- Table 26: APAC Retail Analytics Industry Revenue Million Forecast, by Module Type 2019 & 2032
- Table 27: APAC Retail Analytics Industry Revenue Million Forecast, by Business Type 2019 & 2032
- Table 28: APAC Retail Analytics Industry Revenue Million Forecast, by Geography 2019 & 2032
- Table 29: APAC Retail Analytics Industry Revenue Million Forecast, by Country 2019 & 2032
- Table 30: APAC Retail Analytics Industry Revenue Million Forecast, by Mode of Deployment 2019 & 2032
- Table 31: APAC Retail Analytics Industry Revenue Million Forecast, by Type 2019 & 2032
- Table 32: APAC Retail Analytics Industry Revenue Million Forecast, by Module Type 2019 & 2032
- Table 33: APAC Retail Analytics Industry Revenue Million Forecast, by Business Type 2019 & 2032
- Table 34: APAC Retail Analytics Industry Revenue Million Forecast, by Geography 2019 & 2032
- Table 35: APAC Retail Analytics Industry Revenue Million Forecast, by Country 2019 & 2032
- Table 36: APAC Retail Analytics Industry Revenue Million Forecast, by Mode of Deployment 2019 & 2032
- Table 37: APAC Retail Analytics Industry Revenue Million Forecast, by Type 2019 & 2032
- Table 38: APAC Retail Analytics Industry Revenue Million Forecast, by Module Type 2019 & 2032
- Table 39: APAC Retail Analytics Industry Revenue Million Forecast, by Business Type 2019 & 2032
- Table 40: APAC Retail Analytics Industry Revenue Million Forecast, by Geography 2019 & 2032
- Table 41: APAC Retail Analytics Industry Revenue Million Forecast, by Country 2019 & 2032
Frequently Asked Questions
1. What is the projected Compound Annual Growth Rate (CAGR) of the APAC Retail Analytics Industry?
The projected CAGR is approximately 14.43%.
2. Which companies are prominent players in the APAC Retail Analytics Industry?
Key companies in the market include Qlik Technologies Inc, Targit, IBM Corporation, Fuzzy Logix*List Not Exhaustive, Retail Next Inc, Adobe Systems Incorporated, Pentaho Corporation, Microstrategy Inc, Zoho Corporation, Tableau Software Inc, Alteryx Inc, Oracle Corporation, ZAP Business Intelligence, SAP SE, Prevedere Software Inc.
3. What are the main segments of the APAC Retail Analytics Industry?
The market segments include Mode of Deployment, Type, Module Type, Business Type, Geography.
4. Can you provide details about the market size?
The market size is estimated to be USD 9.28 Million as of 2022.
5. What are some drivers contributing to market growth?
Increased Emphasis on Predictive Analysis; Sustained increase in volume of data; Growing demand for sales forecasting.
6. What are the notable trends driving market growth?
Solutions Segment is Anticipated to Hold Major Market Share.
7. Are there any restraints impacting market growth?
Lack of general awareness and expertise in emerging regions; Standardization and Integration issues.
8. Can you provide examples of recent developments in the market?
August 2022: Maxis invested in ComeBy, a Malaysia-based retail analytics startup, to bolster innovation and digitalization within the retail industry. ComeBy offers brick-and-mortar retailers valuable insights into individual shopper preferences before reaching the checkout counter. The company asserts that its approach, which combines both active and passive tracking, enhances customer engagement and optimizes in-store sales, as well as remarketing and merchandising efforts.
9. What pricing options are available for accessing the report?
Pricing options include single-user, multi-user, and enterprise licenses priced at USD 3800, USD 4500, and USD 5800 respectively.
10. Is the market size provided in terms of value or volume?
The market size is provided in terms of value, measured in Million.
11. Are there any specific market keywords associated with the report?
Yes, the market keyword associated with the report is "APAC Retail Analytics Industry," which aids in identifying and referencing the specific market segment covered.
12. How do I determine which pricing option suits my needs best?
The pricing options vary based on user requirements and access needs. Individual users may opt for single-user licenses, while businesses requiring broader access may choose multi-user or enterprise licenses for cost-effective access to the report.
13. Are there any additional resources or data provided in the APAC Retail Analytics Industry report?
While the report offers comprehensive insights, it's advisable to review the specific contents or supplementary materials provided to ascertain if additional resources or data are available.
14. How can I stay updated on further developments or reports in the APAC Retail Analytics Industry?
To stay informed about further developments, trends, and reports in the APAC Retail Analytics Industry, consider subscribing to industry newsletters, following relevant companies and organizations, or regularly checking reputable industry news sources and publications.
Methodology
Step 1 - Identification of Relevant Samples Size from Population Database


Step 2 - Approaches for Defining Global Market Size (Value, Volume* & Price*)

Note*: In applicable scenarios
Step 3 - Data Sources
Primary Research
- Web Analytics
- Survey Reports
- Research Institute
- Latest Research Reports
- Opinion Leaders
Secondary Research
- Annual Reports
- White Paper
- Latest Press Release
- Industry Association
- Paid Database
- Investor Presentations

Step 4 - Data Triangulation
Involves using different sources of information in order to increase the validity of a study
These sources are likely to be stakeholders in a program - participants, other researchers, program staff, other community members, and so on.
Then we put all data in single framework & apply various statistical tools to find out the dynamic on the market.
During the analysis stage, feedback from the stakeholder groups would be compared to determine areas of agreement as well as areas of divergence


