
Key Insights
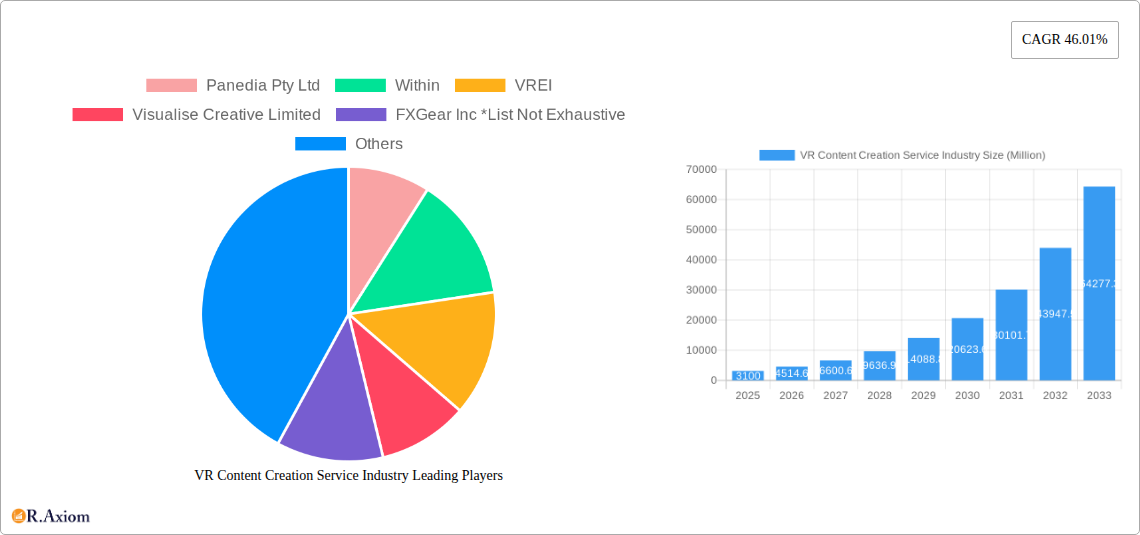
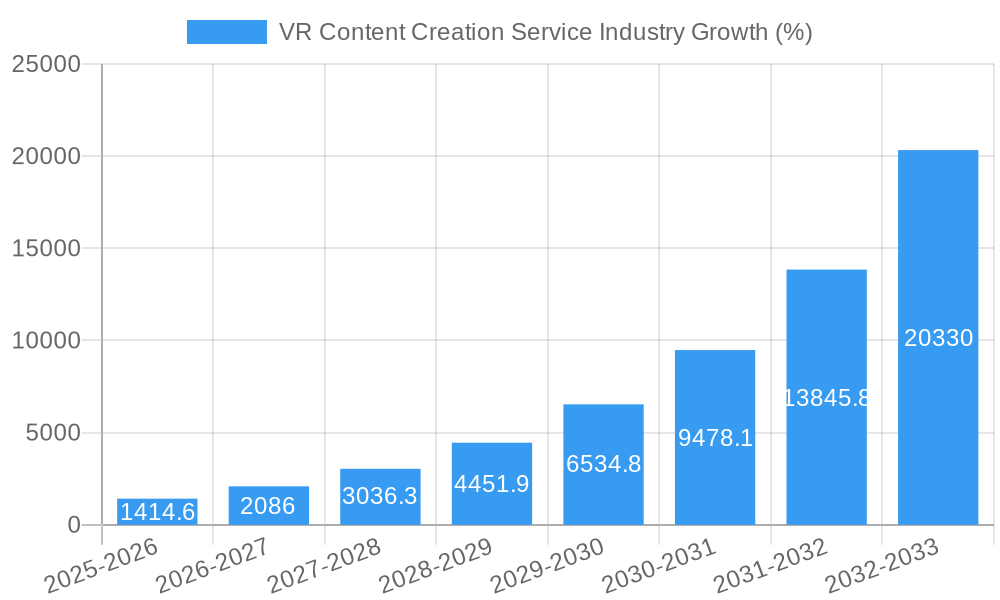
The VR Content Creation Service market is experiencing explosive growth, projected to reach $3.10 billion in 2025 and exhibiting a remarkable Compound Annual Growth Rate (CAGR) of 46.01%. This surge is fueled by several key factors. The increasing adoption of virtual reality technology across diverse sectors like media & entertainment, enterprise & industrial applications, and other end-user segments is driving demand for high-quality VR content. Advancements in VR hardware and software, coupled with the declining cost of development tools, are lowering the barrier to entry for content creators, further fueling market expansion. Furthermore, the rising popularity of immersive experiences, including gaming, virtual tours, and training simulations, is creating a significant demand for specialized VR content creation services. The market is characterized by a competitive landscape with established players like Panedia Pty Ltd, Within, VREI, and Visualise Creative Limited vying for market share alongside emerging companies like FXGear Inc, Fieback Medien, FirebirdVR, and Evolve Studio. However, challenges remain, including the need for skilled professionals and the high initial investment required for sophisticated VR content production.
Looking ahead to 2033, the continued technological advancements, coupled with increasing consumer demand and wider industry adoption, are likely to sustain the high growth trajectory. Geographic expansion, particularly in rapidly developing economies within the Asia-Pacific region, will play a crucial role in shaping the market landscape. The focus will likely shift towards developing more efficient and cost-effective content creation pipelines, incorporating advancements in artificial intelligence and automation. The increasing use of cloud-based VR content creation platforms will contribute to enhanced accessibility and scalability of services, further driving market growth. The competitive landscape will likely see strategic partnerships and mergers and acquisitions as companies seek to expand their capabilities and market reach.
VR Content Creation Service Industry Market Report: 2019-2033
This comprehensive report provides a detailed analysis of the VR Content Creation Service industry, covering market size, segmentation, growth drivers, challenges, and key players. The study period spans from 2019 to 2033, with a base year of 2025 and a forecast period of 2025-2033. The report uses millions (M) for all value figures. This report is crucial for industry stakeholders, investors, and businesses seeking to understand and capitalize on the burgeoning opportunities within this dynamic sector.
VR Content Creation Service Industry Market Concentration & Innovation
The VR Content Creation Service industry exhibits a moderately concentrated market structure, with a handful of major players commanding significant market share. While precise market share figures for individual companies are unavailable (xx%), key players such as Panedia Pty Ltd, Within, VREI, Visualise Creative Limited, FXGear Inc, Fieback Medien, FirebirdVR, and Evolve Studio contribute significantly to the overall market value. The industry is characterized by intense competition, driving innovation in software, hardware, and service offerings. M&A activity has been relatively moderate in recent years, with a total estimated value of xx M in deals during the historical period (2019-2024). This figure is projected to increase to xx M during the forecast period (2025-2033) driven by the consolidation of smaller players and the expansion of larger companies into new market segments.
- Innovation Drivers: Technological advancements in VR hardware (e.g., higher resolution headsets, improved tracking), software (e.g., real-time rendering engines, intuitive content creation tools), and 5G network infrastructure are key drivers.
- Regulatory Frameworks: The evolving regulatory landscape surrounding data privacy, intellectual property rights, and content standards impacts industry growth. Compliance requirements and potential changes to these frameworks pose both challenges and opportunities.
- Product Substitutes: Traditional animation and video production methods present competition, but VR’s unique capabilities provide distinct advantages for certain applications, particularly immersive and interactive content.
- End-User Trends: Growing demand for engaging and immersive experiences across various sectors, including entertainment, education, and training, fuels market growth. The increasing adoption of VR headsets and the accessibility of VR content creation tools contribute to this trend.
- M&A Activity: Consolidation is expected to increase as larger companies seek to expand their capabilities and market reach. Strategic acquisitions are expected to focus on companies with specialized technologies or strong market positions in specific niches.
VR Content Creation Service Industry Industry Trends & Insights
The VR Content Creation Service industry is experiencing robust growth, driven by several factors. The market is projected to witness a Compound Annual Growth Rate (CAGR) of xx% during the forecast period (2025-2033), reaching a market value of xx M by 2033 from an estimated value of xx M in 2025. This growth is fuelled by increased adoption of VR technology, technological advancements, and diverse application across various industries. The market penetration of VR headsets is steadily increasing, which is driving the demand for high-quality VR content. Consumer preferences are shifting towards immersive and interactive experiences, further boosting the growth of the industry.
The competitive landscape is dynamic, with established players and new entrants vying for market share. Technological disruptions, particularly in areas such as artificial intelligence (AI) for content generation and improved motion capture technologies, are continuously reshaping the industry. The emergence of cloud-based VR content creation platforms is also altering the way content is created and distributed. The industry is characterized by continuous innovation, resulting in better tools, improved workflows and increasingly accessible and affordable production capabilities.
Dominant Markets & Segments in VR Content Creation Service Industry
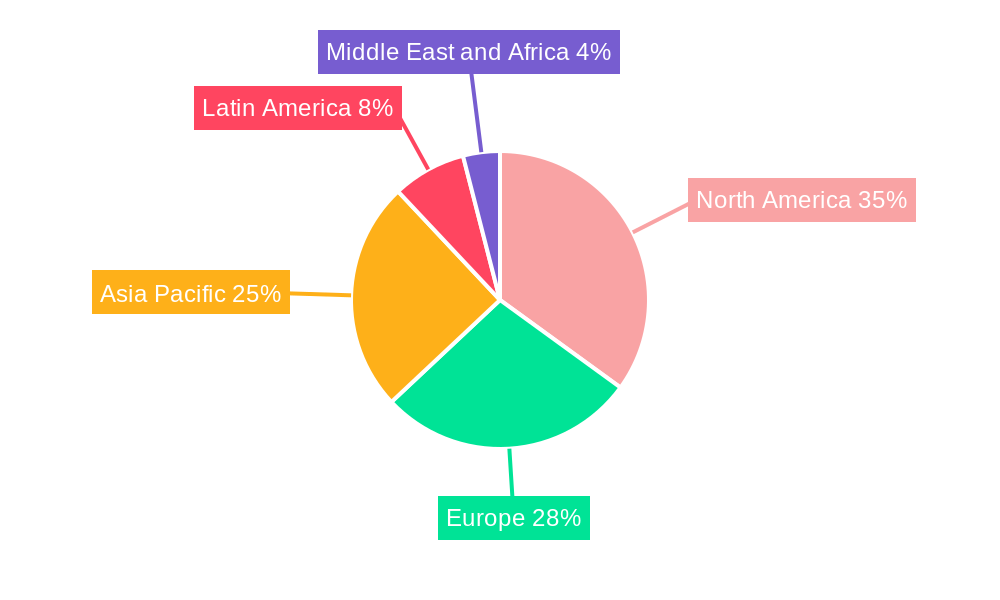
The Media & Entertainment segment currently holds the largest market share in the VR Content Creation Service industry, driven by high demand for immersive gaming experiences, virtual tours, and 360-degree videos. The North American market leads in terms of revenue, followed by Europe and Asia.
- Key Drivers for Media & Entertainment Dominance:
- High consumer demand for immersive entertainment.
- Significant investments in VR game development and content creation.
- Growing adoption of VR headsets in homes and arcades.
- Enterprise & Industrial Segment: This segment is experiencing significant growth due to increased adoption of VR for training, simulations, and virtual collaboration. This is driven by cost-effectiveness, enhanced safety, and the ability to provide better training outcomes.
- Other End-Users: This segment encompasses various applications such as education, healthcare, and real estate. The adoption rate is growing, albeit at a slower pace than Media & Entertainment and Enterprise & Industrial segments.
The dominance of North America is attributed to factors such as:
- Strong technological infrastructure: The region possesses advanced technological infrastructure, supporting the development and adoption of VR technologies.
- High consumer spending: A high disposable income allows consumers to afford VR headsets and related services.
- Presence of major technology companies: The concentration of leading technology companies in the region accelerates innovation and promotes wider adoption.
VR Content Creation Service Industry Product Developments
Recent product developments focus on simplifying VR content creation, enhancing real-time rendering capabilities, and improving accessibility for a wider range of users. New software applications, such as Flipside Studio, enable users to create animated video in real-time using cutting-edge tools. The integration of Microsoft Office 365 with Meta's VR platform opens up new opportunities for businesses to collaborate and work in virtual environments. These advancements are improving workflow efficiency and facilitating wider market adoption.
Report Scope & Segmentation Analysis
This report segments the VR Content Creation Service market by end-user:
- Media & Entertainment: This segment encompasses gaming, film, television, and interactive experiences. It is projected to maintain significant growth with a xx M market size in 2025 and xx M by 2033, driven by increasing consumer demand. The competitive landscape is characterized by intense competition and rapid innovation.
- Enterprise & Industrial: This segment includes applications for training, simulation, design, and collaboration. The market size is estimated at xx M in 2025 and expected to grow to xx M by 2033. The segment is driven by increased efficiency and cost savings.
- Other End-Users: This encompasses education, healthcare, and real estate, among other applications. This segment is projected to show steady growth, with a 2025 market size of xx M and a projected xx M by 2033, fueled by the increasing adoption of VR across various industries.
Key Drivers of VR Content Creation Service Industry Growth
The VR Content Creation Service industry's growth is driven by technological advancements, economic factors, and evolving regulatory environments. Technological progress in VR hardware and software continues to lower barriers to entry for creators and consumers. Increasing affordability and accessibility of VR technology are fueling demand. The rising adoption of VR for training and simulation across industries is a significant driver. Finally, government initiatives and investments in supporting VR technologies are fostering innovation and market expansion.
Challenges in the VR Content Creation Service Industry Sector
The industry faces challenges such as the high cost of VR hardware and software, limited content availability, and the need for specialized skills to create high-quality VR experiences. Supply chain disruptions can impact the availability of components, potentially impacting production timelines. Furthermore, intense competition and the need for continuous innovation add pressure on businesses to maintain their market position. These factors collectively influence market growth and profitability, impacting the overall investment landscape.
Emerging Opportunities in VR Content Creation Service Industry
Emerging opportunities lie in the expansion into new markets, such as education, healthcare, and tourism. The integration of artificial intelligence and machine learning to automate content creation processes presents significant potential. The development of more user-friendly VR content creation tools will attract a wider range of creators. These opportunities suggest substantial growth potential for businesses willing to adapt and innovate in response to market trends.
Leading Players in the VR Content Creation Service Industry Market
- Panedia Pty Ltd
- Within
- VREI
- Visualise Creative Limited
- FXGear Inc
- Fieback Medien
- FirebirdVR
- Evolve Studio
- List Not Exhaustive
Key Developments in VR Content Creation Service Industry Industry
- October 2022: Meta Platforms partnered with Microsoft to integrate Microsoft Office 365 into Meta's VR platform, facilitating business use in virtual settings.
- March 2023: Flipside XR launched Flipside Studio, a VR software enabling real-time animated video creation using Meta Quest 2 and Rift/Rift S headsets.
Strategic Outlook for VR Content Creation Service Industry Market
The VR Content Creation Service industry is poised for significant growth, driven by continuous technological innovation, increasing affordability, and expanding applications across multiple sectors. Opportunities exist for companies that can effectively address the challenges of content creation, distribution, and user experience. The industry's future hinges on developing intuitive tools, creating compelling content, and fostering wider adoption across various sectors. These factors suggest a positive and expansive outlook for the VR Content Creation Service industry in the coming decade.
VR Content Creation Service Industry Segmentation
-
1. End-user
- 1.1. Media & Entertainment
- 1.2. Enterprise & Industrial
- 1.3. Other End-Users
VR Content Creation Service Industry Segmentation By Geography
- 1. North America
- 2. Europe
- 3. Asia Pacific
- 4. Latin America
- 5. Middle East and Africa
VR Content Creation Service Industry REPORT HIGHLIGHTS
| Aspects | Details |
|---|---|
| Study Period | 2019-2033 |
| Base Year | 2024 |
| Estimated Year | 2025 |
| Forecast Period | 2025-2033 |
| Historical Period | 2019-2024 |
| Growth Rate | CAGR of 46.01% from 2019-2033 |
| Segmentation |
|
Table of Contents
- 1. Introduction
- 1.1. Research Scope
- 1.2. Market Segmentation
- 1.3. Research Methodology
- 1.4. Definitions and Assumptions
- 2. Executive Summary
- 2.1. Introduction
- 3. Market Dynamics
- 3.1. Introduction
- 3.2. Market Drivers
- 3.2.1 VR-Based Content is BeningIncreasingly Received by Customers
- 3.2.2 Mostly Driven by Location-Based VR Experiences; Marked Increase in the Market Activity for VR Solutions Driven by Enterprise Use-CasesWhich Require Content Creation & Rendering
- 3.3. Market Restrains
- 3.3.1. High Manufacturing and Fabricating Costs
- 3.4. Market Trends
- 3.4.1. Growing Adoption of VR in Gaming
- 4. Market Factor Analysis
- 4.1. Porters Five Forces
- 4.2. Supply/Value Chain
- 4.3. PESTEL analysis
- 4.4. Market Entropy
- 4.5. Patent/Trademark Analysis
- 5. Global VR Content Creation Service Industry Analysis, Insights and Forecast, 2019-2031
- 5.1. Market Analysis, Insights and Forecast - by End-user
- 5.1.1. Media & Entertainment
- 5.1.2. Enterprise & Industrial
- 5.1.3. Other End-Users
- 5.2. Market Analysis, Insights and Forecast - by Region
- 5.2.1. North America
- 5.2.2. Europe
- 5.2.3. Asia Pacific
- 5.2.4. Latin America
- 5.2.5. Middle East and Africa
- 5.1. Market Analysis, Insights and Forecast - by End-user
- 6. North America VR Content Creation Service Industry Analysis, Insights and Forecast, 2019-2031
- 6.1. Market Analysis, Insights and Forecast - by End-user
- 6.1.1. Media & Entertainment
- 6.1.2. Enterprise & Industrial
- 6.1.3. Other End-Users
- 6.1. Market Analysis, Insights and Forecast - by End-user
- 7. Europe VR Content Creation Service Industry Analysis, Insights and Forecast, 2019-2031
- 7.1. Market Analysis, Insights and Forecast - by End-user
- 7.1.1. Media & Entertainment
- 7.1.2. Enterprise & Industrial
- 7.1.3. Other End-Users
- 7.1. Market Analysis, Insights and Forecast - by End-user
- 8. Asia Pacific VR Content Creation Service Industry Analysis, Insights and Forecast, 2019-2031
- 8.1. Market Analysis, Insights and Forecast - by End-user
- 8.1.1. Media & Entertainment
- 8.1.2. Enterprise & Industrial
- 8.1.3. Other End-Users
- 8.1. Market Analysis, Insights and Forecast - by End-user
- 9. Latin America VR Content Creation Service Industry Analysis, Insights and Forecast, 2019-2031
- 9.1. Market Analysis, Insights and Forecast - by End-user
- 9.1.1. Media & Entertainment
- 9.1.2. Enterprise & Industrial
- 9.1.3. Other End-Users
- 9.1. Market Analysis, Insights and Forecast - by End-user
- 10. Middle East and Africa VR Content Creation Service Industry Analysis, Insights and Forecast, 2019-2031
- 10.1. Market Analysis, Insights and Forecast - by End-user
- 10.1.1. Media & Entertainment
- 10.1.2. Enterprise & Industrial
- 10.1.3. Other End-Users
- 10.1. Market Analysis, Insights and Forecast - by End-user
- 11. North America VR Content Creation Service Industry Analysis, Insights and Forecast, 2019-2031
- 11.1. Market Analysis, Insights and Forecast - By Country/Sub-region
- 11.1.1.
- 12. Europe VR Content Creation Service Industry Analysis, Insights and Forecast, 2019-2031
- 12.1. Market Analysis, Insights and Forecast - By Country/Sub-region
- 12.1.1.
- 13. Asia Pacific VR Content Creation Service Industry Analysis, Insights and Forecast, 2019-2031
- 13.1. Market Analysis, Insights and Forecast - By Country/Sub-region
- 13.1.1.
- 14. Latin America VR Content Creation Service Industry Analysis, Insights and Forecast, 2019-2031
- 14.1. Market Analysis, Insights and Forecast - By Country/Sub-region
- 14.1.1.
- 15. Middle East and Africa VR Content Creation Service Industry Analysis, Insights and Forecast, 2019-2031
- 15.1. Market Analysis, Insights and Forecast - By Country/Sub-region
- 15.1.1.
- 16. Competitive Analysis
- 16.1. Global Market Share Analysis 2024
- 16.2. Company Profiles
- 16.2.1 Panedia Pty Ltd
- 16.2.1.1. Overview
- 16.2.1.2. Products
- 16.2.1.3. SWOT Analysis
- 16.2.1.4. Recent Developments
- 16.2.1.5. Financials (Based on Availability)
- 16.2.2 Within
- 16.2.2.1. Overview
- 16.2.2.2. Products
- 16.2.2.3. SWOT Analysis
- 16.2.2.4. Recent Developments
- 16.2.2.5. Financials (Based on Availability)
- 16.2.3 VREI
- 16.2.3.1. Overview
- 16.2.3.2. Products
- 16.2.3.3. SWOT Analysis
- 16.2.3.4. Recent Developments
- 16.2.3.5. Financials (Based on Availability)
- 16.2.4 Visualise Creative Limited
- 16.2.4.1. Overview
- 16.2.4.2. Products
- 16.2.4.3. SWOT Analysis
- 16.2.4.4. Recent Developments
- 16.2.4.5. Financials (Based on Availability)
- 16.2.5 FXGear Inc *List Not Exhaustive
- 16.2.5.1. Overview
- 16.2.5.2. Products
- 16.2.5.3. SWOT Analysis
- 16.2.5.4. Recent Developments
- 16.2.5.5. Financials (Based on Availability)
- 16.2.6 Fieback Medien
- 16.2.6.1. Overview
- 16.2.6.2. Products
- 16.2.6.3. SWOT Analysis
- 16.2.6.4. Recent Developments
- 16.2.6.5. Financials (Based on Availability)
- 16.2.7 FirebirdVR
- 16.2.7.1. Overview
- 16.2.7.2. Products
- 16.2.7.3. SWOT Analysis
- 16.2.7.4. Recent Developments
- 16.2.7.5. Financials (Based on Availability)
- 16.2.8 Evolve Studio
- 16.2.8.1. Overview
- 16.2.8.2. Products
- 16.2.8.3. SWOT Analysis
- 16.2.8.4. Recent Developments
- 16.2.8.5. Financials (Based on Availability)
- 16.2.1 Panedia Pty Ltd
List of Figures
- Figure 1: Global VR Content Creation Service Industry Revenue Breakdown (Million, %) by Region 2024 & 2032
- Figure 2: North America VR Content Creation Service Industry Revenue (Million), by Country 2024 & 2032
- Figure 3: North America VR Content Creation Service Industry Revenue Share (%), by Country 2024 & 2032
- Figure 4: Europe VR Content Creation Service Industry Revenue (Million), by Country 2024 & 2032
- Figure 5: Europe VR Content Creation Service Industry Revenue Share (%), by Country 2024 & 2032
- Figure 6: Asia Pacific VR Content Creation Service Industry Revenue (Million), by Country 2024 & 2032
- Figure 7: Asia Pacific VR Content Creation Service Industry Revenue Share (%), by Country 2024 & 2032
- Figure 8: Latin America VR Content Creation Service Industry Revenue (Million), by Country 2024 & 2032
- Figure 9: Latin America VR Content Creation Service Industry Revenue Share (%), by Country 2024 & 2032
- Figure 10: Middle East and Africa VR Content Creation Service Industry Revenue (Million), by Country 2024 & 2032
- Figure 11: Middle East and Africa VR Content Creation Service Industry Revenue Share (%), by Country 2024 & 2032
- Figure 12: North America VR Content Creation Service Industry Revenue (Million), by End-user 2024 & 2032
- Figure 13: North America VR Content Creation Service Industry Revenue Share (%), by End-user 2024 & 2032
- Figure 14: North America VR Content Creation Service Industry Revenue (Million), by Country 2024 & 2032
- Figure 15: North America VR Content Creation Service Industry Revenue Share (%), by Country 2024 & 2032
- Figure 16: Europe VR Content Creation Service Industry Revenue (Million), by End-user 2024 & 2032
- Figure 17: Europe VR Content Creation Service Industry Revenue Share (%), by End-user 2024 & 2032
- Figure 18: Europe VR Content Creation Service Industry Revenue (Million), by Country 2024 & 2032
- Figure 19: Europe VR Content Creation Service Industry Revenue Share (%), by Country 2024 & 2032
- Figure 20: Asia Pacific VR Content Creation Service Industry Revenue (Million), by End-user 2024 & 2032
- Figure 21: Asia Pacific VR Content Creation Service Industry Revenue Share (%), by End-user 2024 & 2032
- Figure 22: Asia Pacific VR Content Creation Service Industry Revenue (Million), by Country 2024 & 2032
- Figure 23: Asia Pacific VR Content Creation Service Industry Revenue Share (%), by Country 2024 & 2032
- Figure 24: Latin America VR Content Creation Service Industry Revenue (Million), by End-user 2024 & 2032
- Figure 25: Latin America VR Content Creation Service Industry Revenue Share (%), by End-user 2024 & 2032
- Figure 26: Latin America VR Content Creation Service Industry Revenue (Million), by Country 2024 & 2032
- Figure 27: Latin America VR Content Creation Service Industry Revenue Share (%), by Country 2024 & 2032
- Figure 28: Middle East and Africa VR Content Creation Service Industry Revenue (Million), by End-user 2024 & 2032
- Figure 29: Middle East and Africa VR Content Creation Service Industry Revenue Share (%), by End-user 2024 & 2032
- Figure 30: Middle East and Africa VR Content Creation Service Industry Revenue (Million), by Country 2024 & 2032
- Figure 31: Middle East and Africa VR Content Creation Service Industry Revenue Share (%), by Country 2024 & 2032
List of Tables
- Table 1: Global VR Content Creation Service Industry Revenue Million Forecast, by Region 2019 & 2032
- Table 2: Global VR Content Creation Service Industry Revenue Million Forecast, by End-user 2019 & 2032
- Table 3: Global VR Content Creation Service Industry Revenue Million Forecast, by Region 2019 & 2032
- Table 4: Global VR Content Creation Service Industry Revenue Million Forecast, by Country 2019 & 2032
- Table 5: VR Content Creation Service Industry Revenue (Million) Forecast, by Application 2019 & 2032
- Table 6: Global VR Content Creation Service Industry Revenue Million Forecast, by Country 2019 & 2032
- Table 7: VR Content Creation Service Industry Revenue (Million) Forecast, by Application 2019 & 2032
- Table 8: Global VR Content Creation Service Industry Revenue Million Forecast, by Country 2019 & 2032
- Table 9: VR Content Creation Service Industry Revenue (Million) Forecast, by Application 2019 & 2032
- Table 10: Global VR Content Creation Service Industry Revenue Million Forecast, by Country 2019 & 2032
- Table 11: VR Content Creation Service Industry Revenue (Million) Forecast, by Application 2019 & 2032
- Table 12: Global VR Content Creation Service Industry Revenue Million Forecast, by Country 2019 & 2032
- Table 13: VR Content Creation Service Industry Revenue (Million) Forecast, by Application 2019 & 2032
- Table 14: Global VR Content Creation Service Industry Revenue Million Forecast, by End-user 2019 & 2032
- Table 15: Global VR Content Creation Service Industry Revenue Million Forecast, by Country 2019 & 2032
- Table 16: Global VR Content Creation Service Industry Revenue Million Forecast, by End-user 2019 & 2032
- Table 17: Global VR Content Creation Service Industry Revenue Million Forecast, by Country 2019 & 2032
- Table 18: Global VR Content Creation Service Industry Revenue Million Forecast, by End-user 2019 & 2032
- Table 19: Global VR Content Creation Service Industry Revenue Million Forecast, by Country 2019 & 2032
- Table 20: Global VR Content Creation Service Industry Revenue Million Forecast, by End-user 2019 & 2032
- Table 21: Global VR Content Creation Service Industry Revenue Million Forecast, by Country 2019 & 2032
- Table 22: Global VR Content Creation Service Industry Revenue Million Forecast, by End-user 2019 & 2032
- Table 23: Global VR Content Creation Service Industry Revenue Million Forecast, by Country 2019 & 2032
Frequently Asked Questions
1. What is the projected Compound Annual Growth Rate (CAGR) of the VR Content Creation Service Industry?
The projected CAGR is approximately 46.01%.
2. Which companies are prominent players in the VR Content Creation Service Industry?
Key companies in the market include Panedia Pty Ltd, Within, VREI, Visualise Creative Limited, FXGear Inc *List Not Exhaustive, Fieback Medien, FirebirdVR, Evolve Studio.
3. What are the main segments of the VR Content Creation Service Industry?
The market segments include End-user.
4. Can you provide details about the market size?
The market size is estimated to be USD 3.10 Million as of 2022.
5. What are some drivers contributing to market growth?
VR-Based Content is BeningIncreasingly Received by Customers. Mostly Driven by Location-Based VR Experiences; Marked Increase in the Market Activity for VR Solutions Driven by Enterprise Use-CasesWhich Require Content Creation & Rendering.
6. What are the notable trends driving market growth?
Growing Adoption of VR in Gaming.
7. Are there any restraints impacting market growth?
High Manufacturing and Fabricating Costs.
8. Can you provide examples of recent developments in the market?
March 2023 - Flipside Studio, a new programme developed for creators by virtual reality company Flipside XR, has been released. With Meta's assistance, the company has released a VR software that allows users to create animated video in real time using cutting-edge virtual production tools. Animation creation is made easier by the app's compatibility with Meta Quest 2 and Rift/Rift S VR headsets for motion capture technologies. This VR application is a part of Flipside XR's effort to use augmented and virtual reality to influence the entertainment sector.
9. What pricing options are available for accessing the report?
Pricing options include single-user, multi-user, and enterprise licenses priced at USD 4750, USD 5250, and USD 8750 respectively.
10. Is the market size provided in terms of value or volume?
The market size is provided in terms of value, measured in Million.
11. Are there any specific market keywords associated with the report?
Yes, the market keyword associated with the report is "VR Content Creation Service Industry," which aids in identifying and referencing the specific market segment covered.
12. How do I determine which pricing option suits my needs best?
The pricing options vary based on user requirements and access needs. Individual users may opt for single-user licenses, while businesses requiring broader access may choose multi-user or enterprise licenses for cost-effective access to the report.
13. Are there any additional resources or data provided in the VR Content Creation Service Industry report?
While the report offers comprehensive insights, it's advisable to review the specific contents or supplementary materials provided to ascertain if additional resources or data are available.
14. How can I stay updated on further developments or reports in the VR Content Creation Service Industry?
To stay informed about further developments, trends, and reports in the VR Content Creation Service Industry, consider subscribing to industry newsletters, following relevant companies and organizations, or regularly checking reputable industry news sources and publications.
Methodology
Step 1 - Identification of Relevant Samples Size from Population Database


Step 2 - Approaches for Defining Global Market Size (Value, Volume* & Price*)

Note*: In applicable scenarios
Step 3 - Data Sources
Primary Research
- Web Analytics
- Survey Reports
- Research Institute
- Latest Research Reports
- Opinion Leaders
Secondary Research
- Annual Reports
- White Paper
- Latest Press Release
- Industry Association
- Paid Database
- Investor Presentations

Step 4 - Data Triangulation
Involves using different sources of information in order to increase the validity of a study
These sources are likely to be stakeholders in a program - participants, other researchers, program staff, other community members, and so on.
Then we put all data in single framework & apply various statistical tools to find out the dynamic on the market.
During the analysis stage, feedback from the stakeholder groups would be compared to determine areas of agreement as well as areas of divergence


