
Key Insights
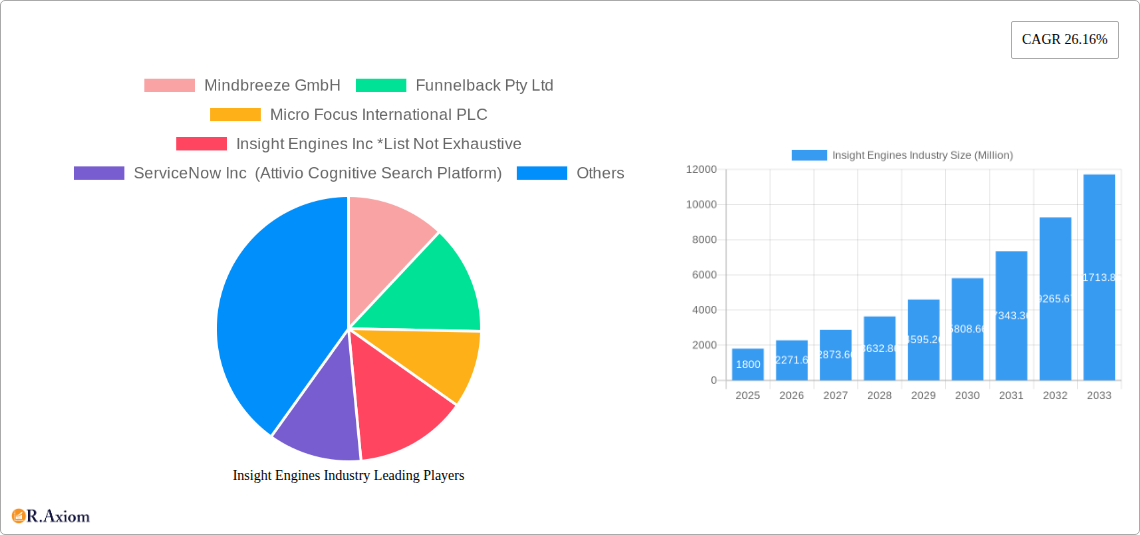
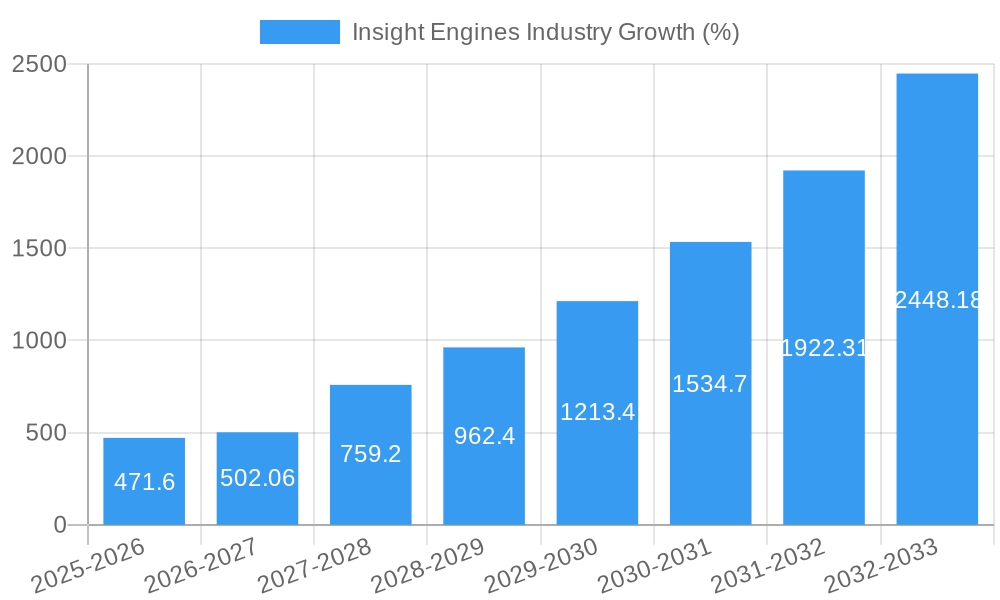
The Insight Engines market is experiencing robust growth, projected to reach $1.80 billion in 2025 and exhibiting a remarkable Compound Annual Growth Rate (CAGR) of 26.16%. This expansion is fueled by several key drivers. The increasing volume and complexity of data necessitate sophisticated search and analytics capabilities, pushing organizations across diverse sectors—including BFSI, retail, and IT & Telecom—to adopt advanced insight engines. The shift towards cloud-based deployments offers scalability and cost-effectiveness, further accelerating market penetration. Furthermore, the rising demand for improved customer experience and operational efficiency is driving investment in these technologies. Large enterprises are leading adoption, followed by a growing number of small and medium-sized enterprises (SMEs) seeking to leverage data-driven decision-making. Competitive innovation is also a major contributor, with established players like IBM and Microsoft alongside specialized vendors continuously enhancing their offerings. The market's segmentation reflects this varied adoption across different deployment models (on-premise and cloud), organizational sizes (SMEs and large enterprises), and industry verticals.
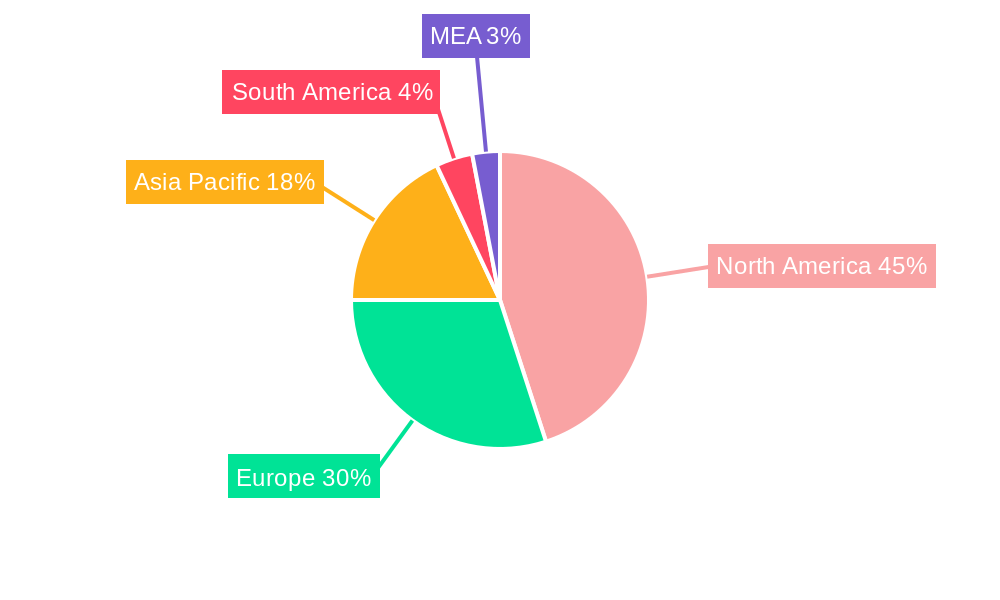
Looking ahead to 2033, the market is poised for sustained expansion, driven by ongoing technological advancements and increasing digital transformation initiatives across industries. The North American market currently holds a significant share, fueled by early adoption and a robust technological ecosystem. However, the Asia-Pacific region, particularly India and China, is anticipated to witness rapid growth due to expanding digital infrastructure and rising data volumes. While data privacy regulations and the complexity of implementation pose certain challenges, the overall market trajectory remains positive, indicating strong prospects for sustained growth over the forecast period. The competitive landscape is dynamic, characterized by both established technology giants and specialized vendors, fostering innovation and driving down prices, making insight engines accessible to a wider range of organizations.
Insight Engines Industry Market Report: 2019-2033
This comprehensive report provides a detailed analysis of the Insight Engines industry, covering market size, growth drivers, competitive landscape, and future outlook. With a study period spanning 2019-2033, a base year of 2025, and a forecast period of 2025-2033, this report offers invaluable insights for industry stakeholders, investors, and businesses seeking to understand and capitalize on the opportunities within this rapidly evolving sector. The market is projected to reach xx Million by 2033, showcasing significant growth potential.
Insight Engines Industry Market Concentration & Innovation
The Insight Engines market is characterized by a mix of established players and emerging innovators. Market concentration is moderate, with a few dominant players holding significant market share, but numerous smaller companies contributing to innovation and competition. Key players include Mindbreeze GmbH, Funnelback Pty Ltd, Micro Focus International PLC, Insight Engines Inc, ServiceNow Inc (Attivio Cognitive Search Platform), IntraFind Inc, IBM Corporation, Google LLC, Coveo Solutions Inc, EPAM Systems Inc (Infongen), Microsoft Corporation, Expert System SpA, IHS Markit Ltd, Dassault Systems SA, Sinequa SAS, and LucidWorks Inc. (List not exhaustive).
- Market Share: The top 5 players account for approximately xx% of the global market share in 2024, while the remaining share is distributed among numerous smaller companies.
- Innovation Drivers: Advances in artificial intelligence (AI), natural language processing (NLP), and machine learning (ML) are driving significant innovation in insight engines. The growing volume of unstructured data fuels demand for sophisticated search and analytics capabilities.
- Regulatory Frameworks: Data privacy regulations (e.g., GDPR, CCPA) are shaping product development and deployment strategies. Compliance requirements are influencing market growth.
- Product Substitutes: Traditional search engines and basic data analytics tools represent potential substitutes, but sophisticated insight engines offer superior functionality and value.
- End-User Trends: Businesses are increasingly adopting cloud-based solutions for scalability and cost-effectiveness, impacting market segmentation.
- M&A Activities: The industry has witnessed several mergers and acquisitions in recent years, with deal values ranging from xx Million to xx Million, indicating a drive towards consolidation and expansion.
Insight Engines Industry Industry Trends & Insights
The Insight Engines market is experiencing robust growth, driven by increasing data volumes, the need for improved decision-making, and the adoption of advanced technologies. The Compound Annual Growth Rate (CAGR) is projected to be xx% from 2025 to 2033. Market penetration is increasing across various sectors, with large enterprises leading the adoption. Technological disruptions, particularly in AI and NLP, are fundamentally changing how businesses extract insights from data. Consumer preferences are shifting towards cloud-based, user-friendly, and highly customizable solutions. Competitive dynamics are intense, with companies focusing on innovation, partnerships, and strategic acquisitions to gain market share. The market is also witnessing the emergence of niche players specializing in specific industry verticals, creating diverse solutions tailored to specific needs.
Dominant Markets & Segments in Insight Engines Industry
The North American region currently dominates the Insight Engines market, followed by Europe and Asia-Pacific. Within these regions, large enterprises are the primary adopters due to their greater data volumes and resources.
- By Component: The software segment holds the largest market share, driven by the growing demand for advanced analytics and search capabilities. The services segment is also growing significantly as organizations increasingly seek professional implementation and maintenance support.
- By Deployment Type: Cloud-based deployments are gaining traction due to their scalability and cost-effectiveness, surpassing on-premise deployments.
- By Size of the Enterprise: Large enterprises dominate the market due to their higher budgets and greater need for advanced analytics. However, the SME segment is expected to experience faster growth.
- By End-User Industry: The BFSI (Banking, Financial Services, and Insurance) sector is a major driver of market growth due to its vast data volumes and stringent regulatory requirements. The retail and IT & Telecom sectors are also significant contributors.
Key Drivers:
- BFSI: Stringent regulatory compliance requirements, the need for fraud detection, and improved customer service are driving adoption.
- Retail: Personalized customer experiences, inventory management optimization, and improved supply chain efficiency are key drivers.
- IT & Telecom: Enhanced network management, improved customer support, and efficient troubleshooting are key factors.
Insight Engines Industry Product Developments
Recent product innovations in the insight engines market focus on enhanced AI/ML capabilities, improved natural language processing, integration with existing enterprise systems, and user-friendly interfaces. These advancements are driving adoption across various sectors and providing businesses with competitive advantages by enabling faster decision-making, improved operational efficiency, and better customer experiences. The market trend shows a focus on creating highly customized solutions that effectively address sector-specific needs.
Report Scope & Segmentation Analysis
This report segments the Insight Engines market by component (software and services), deployment type (on-premise and cloud), enterprise size (SMEs and large enterprises), and end-user industry (BFSI, retail, and IT & Telecom). Each segment's market size, growth projections, and competitive dynamics are analyzed in detail. The report projects significant growth for the cloud-based deployment segment and the large enterprise segment throughout the forecast period. Within end-user industries, the BFSI sector is anticipated to maintain its leading position.
Key Drivers of Insight Engines Industry Growth
The Insight Engines industry’s growth is propelled by several key factors: the exponential growth of unstructured data, the demand for improved data analytics, increased adoption of cloud-based solutions, the rising adoption of AI and ML technologies, and the need for enhanced operational efficiency and decision-making across various sectors. Government initiatives to promote digitalization are also contributing to market expansion.
Challenges in the Insight Engines Industry Sector
Challenges include the high cost of implementation and maintenance, concerns about data security and privacy, the need for skilled professionals, and the complexities of integrating insight engines with existing systems. Furthermore, competition from established players and emerging startups creates pressure on pricing and innovation. These factors can affect overall market growth and adoption rates. The market size impacted by these challenges is approximately xx Million annually.
Emerging Opportunities in Insight Engines Industry
Emerging opportunities include the increasing adoption of AI-powered chatbots and virtual assistants, the growing demand for real-time insights, the expansion into new industry verticals (e.g., healthcare, education), and the development of specialized solutions for specific business needs. These opportunities represent substantial market potential for businesses capable of leveraging new technologies.
Leading Players in the Insight Engines Industry Market
- Mindbreeze GmbH
- Funnelback Pty Ltd
- Micro Focus International PLC
- Insight Engines Inc
- ServiceNow Inc (Attivio Cognitive Search Platform)
- IntraFind Inc
- IBM Corporation
- Google LLC
- Coveo Solutions Inc
- EPAM Systems Inc (Infongen)
- Microsoft Corporation
- Expert System SpA
- IHS Markit Ltd
- Dassault Systems SA
- Sinequa SAS
- LucidWorks Inc
Key Developments in Insight Engines Industry Industry
- January 2022: Expert.ai partnered with RSA to improve claims handling using intelligent document processing, enhancing efficiency and customer experience.
- February 2022: Expert.ai's technology was selected for Titan Technologies' Compendia solution, improving search and examination of digitized documents for the US National Security Research Center.
Strategic Outlook for Insight Engines Industry Market
The Insight Engines market is poised for continued strong growth, driven by technological advancements, increasing data volumes, and the growing need for intelligent data analysis across various sectors. The market's future potential is significant, with opportunities for innovation, expansion into new markets, and the development of specialized solutions to address niche industry requirements.
Insight Engines Industry Segmentation
-
1. Component
- 1.1. Software
- 1.2. Services
-
2. Deployment Type
- 2.1. On-premise
- 2.2. Cloud
-
3. Size of the Enterprise
- 3.1. Small- and Medium-Sized Enterprises
- 3.2. Large Enterprises
-
4. End-User Industry
- 4.1. BFSI
- 4.2. Retail
- 4.3. IT and Telecom
Insight Engines Industry Segmentation By Geography
- 1. North America
- 2. Europe
- 3. Asia Pacific
- 4. Latin America
- 5. Middle East and Africa
Insight Engines Industry REPORT HIGHLIGHTS
| Aspects | Details |
|---|---|
| Study Period | 2019-2033 |
| Base Year | 2024 |
| Estimated Year | 2025 |
| Forecast Period | 2025-2033 |
| Historical Period | 2019-2024 |
| Growth Rate | CAGR of 26.16% from 2019-2033 |
| Segmentation |
|
Table of Contents
- 1. Introduction
- 1.1. Research Scope
- 1.2. Market Segmentation
- 1.3. Research Methodology
- 1.4. Definitions and Assumptions
- 2. Executive Summary
- 2.1. Introduction
- 3. Market Dynamics
- 3.1. Introduction
- 3.2. Market Drivers
- 3.2.1. Increasing Volumes of Data and the Requirement of Structured Data; Rising Generation of Analytical Queries Via Search and Natural Language Processing
- 3.3. Market Restrains
- 3.3.1. Concerns Regarding the Data Quality and Data Sources Validation
- 3.4. Market Trends
- 3.4.1. The BFSI Segment Expected to Hold a Significant Share
- 4. Market Factor Analysis
- 4.1. Porters Five Forces
- 4.2. Supply/Value Chain
- 4.3. PESTEL analysis
- 4.4. Market Entropy
- 4.5. Patent/Trademark Analysis
- 5. Global Insight Engines Industry Analysis, Insights and Forecast, 2019-2031
- 5.1. Market Analysis, Insights and Forecast - by Component
- 5.1.1. Software
- 5.1.2. Services
- 5.2. Market Analysis, Insights and Forecast - by Deployment Type
- 5.2.1. On-premise
- 5.2.2. Cloud
- 5.3. Market Analysis, Insights and Forecast - by Size of the Enterprise
- 5.3.1. Small- and Medium-Sized Enterprises
- 5.3.2. Large Enterprises
- 5.4. Market Analysis, Insights and Forecast - by End-User Industry
- 5.4.1. BFSI
- 5.4.2. Retail
- 5.4.3. IT and Telecom
- 5.5. Market Analysis, Insights and Forecast - by Region
- 5.5.1. North America
- 5.5.2. Europe
- 5.5.3. Asia Pacific
- 5.5.4. Latin America
- 5.5.5. Middle East and Africa
- 5.1. Market Analysis, Insights and Forecast - by Component
- 6. North America Insight Engines Industry Analysis, Insights and Forecast, 2019-2031
- 6.1. Market Analysis, Insights and Forecast - by Component
- 6.1.1. Software
- 6.1.2. Services
- 6.2. Market Analysis, Insights and Forecast - by Deployment Type
- 6.2.1. On-premise
- 6.2.2. Cloud
- 6.3. Market Analysis, Insights and Forecast - by Size of the Enterprise
- 6.3.1. Small- and Medium-Sized Enterprises
- 6.3.2. Large Enterprises
- 6.4. Market Analysis, Insights and Forecast - by End-User Industry
- 6.4.1. BFSI
- 6.4.2. Retail
- 6.4.3. IT and Telecom
- 6.1. Market Analysis, Insights and Forecast - by Component
- 7. Europe Insight Engines Industry Analysis, Insights and Forecast, 2019-2031
- 7.1. Market Analysis, Insights and Forecast - by Component
- 7.1.1. Software
- 7.1.2. Services
- 7.2. Market Analysis, Insights and Forecast - by Deployment Type
- 7.2.1. On-premise
- 7.2.2. Cloud
- 7.3. Market Analysis, Insights and Forecast - by Size of the Enterprise
- 7.3.1. Small- and Medium-Sized Enterprises
- 7.3.2. Large Enterprises
- 7.4. Market Analysis, Insights and Forecast - by End-User Industry
- 7.4.1. BFSI
- 7.4.2. Retail
- 7.4.3. IT and Telecom
- 7.1. Market Analysis, Insights and Forecast - by Component
- 8. Asia Pacific Insight Engines Industry Analysis, Insights and Forecast, 2019-2031
- 8.1. Market Analysis, Insights and Forecast - by Component
- 8.1.1. Software
- 8.1.2. Services
- 8.2. Market Analysis, Insights and Forecast - by Deployment Type
- 8.2.1. On-premise
- 8.2.2. Cloud
- 8.3. Market Analysis, Insights and Forecast - by Size of the Enterprise
- 8.3.1. Small- and Medium-Sized Enterprises
- 8.3.2. Large Enterprises
- 8.4. Market Analysis, Insights and Forecast - by End-User Industry
- 8.4.1. BFSI
- 8.4.2. Retail
- 8.4.3. IT and Telecom
- 8.1. Market Analysis, Insights and Forecast - by Component
- 9. Latin America Insight Engines Industry Analysis, Insights and Forecast, 2019-2031
- 9.1. Market Analysis, Insights and Forecast - by Component
- 9.1.1. Software
- 9.1.2. Services
- 9.2. Market Analysis, Insights and Forecast - by Deployment Type
- 9.2.1. On-premise
- 9.2.2. Cloud
- 9.3. Market Analysis, Insights and Forecast - by Size of the Enterprise
- 9.3.1. Small- and Medium-Sized Enterprises
- 9.3.2. Large Enterprises
- 9.4. Market Analysis, Insights and Forecast - by End-User Industry
- 9.4.1. BFSI
- 9.4.2. Retail
- 9.4.3. IT and Telecom
- 9.1. Market Analysis, Insights and Forecast - by Component
- 10. Middle East and Africa Insight Engines Industry Analysis, Insights and Forecast, 2019-2031
- 10.1. Market Analysis, Insights and Forecast - by Component
- 10.1.1. Software
- 10.1.2. Services
- 10.2. Market Analysis, Insights and Forecast - by Deployment Type
- 10.2.1. On-premise
- 10.2.2. Cloud
- 10.3. Market Analysis, Insights and Forecast - by Size of the Enterprise
- 10.3.1. Small- and Medium-Sized Enterprises
- 10.3.2. Large Enterprises
- 10.4. Market Analysis, Insights and Forecast - by End-User Industry
- 10.4.1. BFSI
- 10.4.2. Retail
- 10.4.3. IT and Telecom
- 10.1. Market Analysis, Insights and Forecast - by Component
- 11. North America Insight Engines Industry Analysis, Insights and Forecast, 2019-2031
- 11.1. Market Analysis, Insights and Forecast - By Country/Sub-region
- 11.1.1 United States
- 11.1.2 Canada
- 11.1.3 Mexico
- 12. Europe Insight Engines Industry Analysis, Insights and Forecast, 2019-2031
- 12.1. Market Analysis, Insights and Forecast - By Country/Sub-region
- 12.1.1 Germany
- 12.1.2 United Kingdom
- 12.1.3 France
- 12.1.4 Spain
- 12.1.5 Italy
- 12.1.6 Spain
- 12.1.7 Belgium
- 12.1.8 Netherland
- 12.1.9 Nordics
- 12.1.10 Rest of Europe
- 13. Asia Pacific Insight Engines Industry Analysis, Insights and Forecast, 2019-2031
- 13.1. Market Analysis, Insights and Forecast - By Country/Sub-region
- 13.1.1 China
- 13.1.2 Japan
- 13.1.3 India
- 13.1.4 South Korea
- 13.1.5 Southeast Asia
- 13.1.6 Australia
- 13.1.7 Indonesia
- 13.1.8 Phillipes
- 13.1.9 Singapore
- 13.1.10 Thailandc
- 13.1.11 Rest of Asia Pacific
- 14. South America Insight Engines Industry Analysis, Insights and Forecast, 2019-2031
- 14.1. Market Analysis, Insights and Forecast - By Country/Sub-region
- 14.1.1 Brazil
- 14.1.2 Argentina
- 14.1.3 Peru
- 14.1.4 Chile
- 14.1.5 Colombia
- 14.1.6 Ecuador
- 14.1.7 Venezuela
- 14.1.8 Rest of South America
- 15. North America Insight Engines Industry Analysis, Insights and Forecast, 2019-2031
- 15.1. Market Analysis, Insights and Forecast - By Country/Sub-region
- 15.1.1 United States
- 15.1.2 Canada
- 15.1.3 Mexico
- 16. MEA Insight Engines Industry Analysis, Insights and Forecast, 2019-2031
- 16.1. Market Analysis, Insights and Forecast - By Country/Sub-region
- 16.1.1 United Arab Emirates
- 16.1.2 Saudi Arabia
- 16.1.3 South Africa
- 16.1.4 Rest of Middle East and Africa
- 17. Competitive Analysis
- 17.1. Global Market Share Analysis 2024
- 17.2. Company Profiles
- 17.2.1 Mindbreeze GmbH
- 17.2.1.1. Overview
- 17.2.1.2. Products
- 17.2.1.3. SWOT Analysis
- 17.2.1.4. Recent Developments
- 17.2.1.5. Financials (Based on Availability)
- 17.2.2 Funnelback Pty Ltd
- 17.2.2.1. Overview
- 17.2.2.2. Products
- 17.2.2.3. SWOT Analysis
- 17.2.2.4. Recent Developments
- 17.2.2.5. Financials (Based on Availability)
- 17.2.3 Micro Focus International PLC
- 17.2.3.1. Overview
- 17.2.3.2. Products
- 17.2.3.3. SWOT Analysis
- 17.2.3.4. Recent Developments
- 17.2.3.5. Financials (Based on Availability)
- 17.2.4 Insight Engines Inc *List Not Exhaustive
- 17.2.4.1. Overview
- 17.2.4.2. Products
- 17.2.4.3. SWOT Analysis
- 17.2.4.4. Recent Developments
- 17.2.4.5. Financials (Based on Availability)
- 17.2.5 ServiceNow Inc (Attivio Cognitive Search Platform)
- 17.2.5.1. Overview
- 17.2.5.2. Products
- 17.2.5.3. SWOT Analysis
- 17.2.5.4. Recent Developments
- 17.2.5.5. Financials (Based on Availability)
- 17.2.6 IntraFind Inc
- 17.2.6.1. Overview
- 17.2.6.2. Products
- 17.2.6.3. SWOT Analysis
- 17.2.6.4. Recent Developments
- 17.2.6.5. Financials (Based on Availability)
- 17.2.7 IBM Corporation
- 17.2.7.1. Overview
- 17.2.7.2. Products
- 17.2.7.3. SWOT Analysis
- 17.2.7.4. Recent Developments
- 17.2.7.5. Financials (Based on Availability)
- 17.2.8 Google LLC
- 17.2.8.1. Overview
- 17.2.8.2. Products
- 17.2.8.3. SWOT Analysis
- 17.2.8.4. Recent Developments
- 17.2.8.5. Financials (Based on Availability)
- 17.2.9 Coveo Solutions Inc
- 17.2.9.1. Overview
- 17.2.9.2. Products
- 17.2.9.3. SWOT Analysis
- 17.2.9.4. Recent Developments
- 17.2.9.5. Financials (Based on Availability)
- 17.2.10 EPAM Systems Inc (Infongen)
- 17.2.10.1. Overview
- 17.2.10.2. Products
- 17.2.10.3. SWOT Analysis
- 17.2.10.4. Recent Developments
- 17.2.10.5. Financials (Based on Availability)
- 17.2.11 Microsoft Corporation
- 17.2.11.1. Overview
- 17.2.11.2. Products
- 17.2.11.3. SWOT Analysis
- 17.2.11.4. Recent Developments
- 17.2.11.5. Financials (Based on Availability)
- 17.2.12 Expert System SpA
- 17.2.12.1. Overview
- 17.2.12.2. Products
- 17.2.12.3. SWOT Analysis
- 17.2.12.4. Recent Developments
- 17.2.12.5. Financials (Based on Availability)
- 17.2.13 IHS Markit Ltd
- 17.2.13.1. Overview
- 17.2.13.2. Products
- 17.2.13.3. SWOT Analysis
- 17.2.13.4. Recent Developments
- 17.2.13.5. Financials (Based on Availability)
- 17.2.14 Dassault Systems SA
- 17.2.14.1. Overview
- 17.2.14.2. Products
- 17.2.14.3. SWOT Analysis
- 17.2.14.4. Recent Developments
- 17.2.14.5. Financials (Based on Availability)
- 17.2.15 Sinequa SAS
- 17.2.15.1. Overview
- 17.2.15.2. Products
- 17.2.15.3. SWOT Analysis
- 17.2.15.4. Recent Developments
- 17.2.15.5. Financials (Based on Availability)
- 17.2.16 LucidWorks Inc
- 17.2.16.1. Overview
- 17.2.16.2. Products
- 17.2.16.3. SWOT Analysis
- 17.2.16.4. Recent Developments
- 17.2.16.5. Financials (Based on Availability)
- 17.2.1 Mindbreeze GmbH
List of Figures
- Figure 1: Global Insight Engines Industry Revenue Breakdown (Million, %) by Region 2024 & 2032
- Figure 2: North America Insight Engines Industry Revenue (Million), by Country 2024 & 2032
- Figure 3: North America Insight Engines Industry Revenue Share (%), by Country 2024 & 2032
- Figure 4: Europe Insight Engines Industry Revenue (Million), by Country 2024 & 2032
- Figure 5: Europe Insight Engines Industry Revenue Share (%), by Country 2024 & 2032
- Figure 6: Asia Pacific Insight Engines Industry Revenue (Million), by Country 2024 & 2032
- Figure 7: Asia Pacific Insight Engines Industry Revenue Share (%), by Country 2024 & 2032
- Figure 8: South America Insight Engines Industry Revenue (Million), by Country 2024 & 2032
- Figure 9: South America Insight Engines Industry Revenue Share (%), by Country 2024 & 2032
- Figure 10: North America Insight Engines Industry Revenue (Million), by Country 2024 & 2032
- Figure 11: North America Insight Engines Industry Revenue Share (%), by Country 2024 & 2032
- Figure 12: MEA Insight Engines Industry Revenue (Million), by Country 2024 & 2032
- Figure 13: MEA Insight Engines Industry Revenue Share (%), by Country 2024 & 2032
- Figure 14: North America Insight Engines Industry Revenue (Million), by Component 2024 & 2032
- Figure 15: North America Insight Engines Industry Revenue Share (%), by Component 2024 & 2032
- Figure 16: North America Insight Engines Industry Revenue (Million), by Deployment Type 2024 & 2032
- Figure 17: North America Insight Engines Industry Revenue Share (%), by Deployment Type 2024 & 2032
- Figure 18: North America Insight Engines Industry Revenue (Million), by Size of the Enterprise 2024 & 2032
- Figure 19: North America Insight Engines Industry Revenue Share (%), by Size of the Enterprise 2024 & 2032
- Figure 20: North America Insight Engines Industry Revenue (Million), by End-User Industry 2024 & 2032
- Figure 21: North America Insight Engines Industry Revenue Share (%), by End-User Industry 2024 & 2032
- Figure 22: North America Insight Engines Industry Revenue (Million), by Country 2024 & 2032
- Figure 23: North America Insight Engines Industry Revenue Share (%), by Country 2024 & 2032
- Figure 24: Europe Insight Engines Industry Revenue (Million), by Component 2024 & 2032
- Figure 25: Europe Insight Engines Industry Revenue Share (%), by Component 2024 & 2032
- Figure 26: Europe Insight Engines Industry Revenue (Million), by Deployment Type 2024 & 2032
- Figure 27: Europe Insight Engines Industry Revenue Share (%), by Deployment Type 2024 & 2032
- Figure 28: Europe Insight Engines Industry Revenue (Million), by Size of the Enterprise 2024 & 2032
- Figure 29: Europe Insight Engines Industry Revenue Share (%), by Size of the Enterprise 2024 & 2032
- Figure 30: Europe Insight Engines Industry Revenue (Million), by End-User Industry 2024 & 2032
- Figure 31: Europe Insight Engines Industry Revenue Share (%), by End-User Industry 2024 & 2032
- Figure 32: Europe Insight Engines Industry Revenue (Million), by Country 2024 & 2032
- Figure 33: Europe Insight Engines Industry Revenue Share (%), by Country 2024 & 2032
- Figure 34: Asia Pacific Insight Engines Industry Revenue (Million), by Component 2024 & 2032
- Figure 35: Asia Pacific Insight Engines Industry Revenue Share (%), by Component 2024 & 2032
- Figure 36: Asia Pacific Insight Engines Industry Revenue (Million), by Deployment Type 2024 & 2032
- Figure 37: Asia Pacific Insight Engines Industry Revenue Share (%), by Deployment Type 2024 & 2032
- Figure 38: Asia Pacific Insight Engines Industry Revenue (Million), by Size of the Enterprise 2024 & 2032
- Figure 39: Asia Pacific Insight Engines Industry Revenue Share (%), by Size of the Enterprise 2024 & 2032
- Figure 40: Asia Pacific Insight Engines Industry Revenue (Million), by End-User Industry 2024 & 2032
- Figure 41: Asia Pacific Insight Engines Industry Revenue Share (%), by End-User Industry 2024 & 2032
- Figure 42: Asia Pacific Insight Engines Industry Revenue (Million), by Country 2024 & 2032
- Figure 43: Asia Pacific Insight Engines Industry Revenue Share (%), by Country 2024 & 2032
- Figure 44: Latin America Insight Engines Industry Revenue (Million), by Component 2024 & 2032
- Figure 45: Latin America Insight Engines Industry Revenue Share (%), by Component 2024 & 2032
- Figure 46: Latin America Insight Engines Industry Revenue (Million), by Deployment Type 2024 & 2032
- Figure 47: Latin America Insight Engines Industry Revenue Share (%), by Deployment Type 2024 & 2032
- Figure 48: Latin America Insight Engines Industry Revenue (Million), by Size of the Enterprise 2024 & 2032
- Figure 49: Latin America Insight Engines Industry Revenue Share (%), by Size of the Enterprise 2024 & 2032
- Figure 50: Latin America Insight Engines Industry Revenue (Million), by End-User Industry 2024 & 2032
- Figure 51: Latin America Insight Engines Industry Revenue Share (%), by End-User Industry 2024 & 2032
- Figure 52: Latin America Insight Engines Industry Revenue (Million), by Country 2024 & 2032
- Figure 53: Latin America Insight Engines Industry Revenue Share (%), by Country 2024 & 2032
- Figure 54: Middle East and Africa Insight Engines Industry Revenue (Million), by Component 2024 & 2032
- Figure 55: Middle East and Africa Insight Engines Industry Revenue Share (%), by Component 2024 & 2032
- Figure 56: Middle East and Africa Insight Engines Industry Revenue (Million), by Deployment Type 2024 & 2032
- Figure 57: Middle East and Africa Insight Engines Industry Revenue Share (%), by Deployment Type 2024 & 2032
- Figure 58: Middle East and Africa Insight Engines Industry Revenue (Million), by Size of the Enterprise 2024 & 2032
- Figure 59: Middle East and Africa Insight Engines Industry Revenue Share (%), by Size of the Enterprise 2024 & 2032
- Figure 60: Middle East and Africa Insight Engines Industry Revenue (Million), by End-User Industry 2024 & 2032
- Figure 61: Middle East and Africa Insight Engines Industry Revenue Share (%), by End-User Industry 2024 & 2032
- Figure 62: Middle East and Africa Insight Engines Industry Revenue (Million), by Country 2024 & 2032
- Figure 63: Middle East and Africa Insight Engines Industry Revenue Share (%), by Country 2024 & 2032
List of Tables
- Table 1: Global Insight Engines Industry Revenue Million Forecast, by Region 2019 & 2032
- Table 2: Global Insight Engines Industry Revenue Million Forecast, by Component 2019 & 2032
- Table 3: Global Insight Engines Industry Revenue Million Forecast, by Deployment Type 2019 & 2032
- Table 4: Global Insight Engines Industry Revenue Million Forecast, by Size of the Enterprise 2019 & 2032
- Table 5: Global Insight Engines Industry Revenue Million Forecast, by End-User Industry 2019 & 2032
- Table 6: Global Insight Engines Industry Revenue Million Forecast, by Region 2019 & 2032
- Table 7: Global Insight Engines Industry Revenue Million Forecast, by Country 2019 & 2032
- Table 8: United States Insight Engines Industry Revenue (Million) Forecast, by Application 2019 & 2032
- Table 9: Canada Insight Engines Industry Revenue (Million) Forecast, by Application 2019 & 2032
- Table 10: Mexico Insight Engines Industry Revenue (Million) Forecast, by Application 2019 & 2032
- Table 11: Global Insight Engines Industry Revenue Million Forecast, by Country 2019 & 2032
- Table 12: Germany Insight Engines Industry Revenue (Million) Forecast, by Application 2019 & 2032
- Table 13: United Kingdom Insight Engines Industry Revenue (Million) Forecast, by Application 2019 & 2032
- Table 14: France Insight Engines Industry Revenue (Million) Forecast, by Application 2019 & 2032
- Table 15: Spain Insight Engines Industry Revenue (Million) Forecast, by Application 2019 & 2032
- Table 16: Italy Insight Engines Industry Revenue (Million) Forecast, by Application 2019 & 2032
- Table 17: Spain Insight Engines Industry Revenue (Million) Forecast, by Application 2019 & 2032
- Table 18: Belgium Insight Engines Industry Revenue (Million) Forecast, by Application 2019 & 2032
- Table 19: Netherland Insight Engines Industry Revenue (Million) Forecast, by Application 2019 & 2032
- Table 20: Nordics Insight Engines Industry Revenue (Million) Forecast, by Application 2019 & 2032
- Table 21: Rest of Europe Insight Engines Industry Revenue (Million) Forecast, by Application 2019 & 2032
- Table 22: Global Insight Engines Industry Revenue Million Forecast, by Country 2019 & 2032
- Table 23: China Insight Engines Industry Revenue (Million) Forecast, by Application 2019 & 2032
- Table 24: Japan Insight Engines Industry Revenue (Million) Forecast, by Application 2019 & 2032
- Table 25: India Insight Engines Industry Revenue (Million) Forecast, by Application 2019 & 2032
- Table 26: South Korea Insight Engines Industry Revenue (Million) Forecast, by Application 2019 & 2032
- Table 27: Southeast Asia Insight Engines Industry Revenue (Million) Forecast, by Application 2019 & 2032
- Table 28: Australia Insight Engines Industry Revenue (Million) Forecast, by Application 2019 & 2032
- Table 29: Indonesia Insight Engines Industry Revenue (Million) Forecast, by Application 2019 & 2032
- Table 30: Phillipes Insight Engines Industry Revenue (Million) Forecast, by Application 2019 & 2032
- Table 31: Singapore Insight Engines Industry Revenue (Million) Forecast, by Application 2019 & 2032
- Table 32: Thailandc Insight Engines Industry Revenue (Million) Forecast, by Application 2019 & 2032
- Table 33: Rest of Asia Pacific Insight Engines Industry Revenue (Million) Forecast, by Application 2019 & 2032
- Table 34: Global Insight Engines Industry Revenue Million Forecast, by Country 2019 & 2032
- Table 35: Brazil Insight Engines Industry Revenue (Million) Forecast, by Application 2019 & 2032
- Table 36: Argentina Insight Engines Industry Revenue (Million) Forecast, by Application 2019 & 2032
- Table 37: Peru Insight Engines Industry Revenue (Million) Forecast, by Application 2019 & 2032
- Table 38: Chile Insight Engines Industry Revenue (Million) Forecast, by Application 2019 & 2032
- Table 39: Colombia Insight Engines Industry Revenue (Million) Forecast, by Application 2019 & 2032
- Table 40: Ecuador Insight Engines Industry Revenue (Million) Forecast, by Application 2019 & 2032
- Table 41: Venezuela Insight Engines Industry Revenue (Million) Forecast, by Application 2019 & 2032
- Table 42: Rest of South America Insight Engines Industry Revenue (Million) Forecast, by Application 2019 & 2032
- Table 43: Global Insight Engines Industry Revenue Million Forecast, by Country 2019 & 2032
- Table 44: United States Insight Engines Industry Revenue (Million) Forecast, by Application 2019 & 2032
- Table 45: Canada Insight Engines Industry Revenue (Million) Forecast, by Application 2019 & 2032
- Table 46: Mexico Insight Engines Industry Revenue (Million) Forecast, by Application 2019 & 2032
- Table 47: Global Insight Engines Industry Revenue Million Forecast, by Country 2019 & 2032
- Table 48: United Arab Emirates Insight Engines Industry Revenue (Million) Forecast, by Application 2019 & 2032
- Table 49: Saudi Arabia Insight Engines Industry Revenue (Million) Forecast, by Application 2019 & 2032
- Table 50: South Africa Insight Engines Industry Revenue (Million) Forecast, by Application 2019 & 2032
- Table 51: Rest of Middle East and Africa Insight Engines Industry Revenue (Million) Forecast, by Application 2019 & 2032
- Table 52: Global Insight Engines Industry Revenue Million Forecast, by Component 2019 & 2032
- Table 53: Global Insight Engines Industry Revenue Million Forecast, by Deployment Type 2019 & 2032
- Table 54: Global Insight Engines Industry Revenue Million Forecast, by Size of the Enterprise 2019 & 2032
- Table 55: Global Insight Engines Industry Revenue Million Forecast, by End-User Industry 2019 & 2032
- Table 56: Global Insight Engines Industry Revenue Million Forecast, by Country 2019 & 2032
- Table 57: Global Insight Engines Industry Revenue Million Forecast, by Component 2019 & 2032
- Table 58: Global Insight Engines Industry Revenue Million Forecast, by Deployment Type 2019 & 2032
- Table 59: Global Insight Engines Industry Revenue Million Forecast, by Size of the Enterprise 2019 & 2032
- Table 60: Global Insight Engines Industry Revenue Million Forecast, by End-User Industry 2019 & 2032
- Table 61: Global Insight Engines Industry Revenue Million Forecast, by Country 2019 & 2032
- Table 62: Global Insight Engines Industry Revenue Million Forecast, by Component 2019 & 2032
- Table 63: Global Insight Engines Industry Revenue Million Forecast, by Deployment Type 2019 & 2032
- Table 64: Global Insight Engines Industry Revenue Million Forecast, by Size of the Enterprise 2019 & 2032
- Table 65: Global Insight Engines Industry Revenue Million Forecast, by End-User Industry 2019 & 2032
- Table 66: Global Insight Engines Industry Revenue Million Forecast, by Country 2019 & 2032
- Table 67: Global Insight Engines Industry Revenue Million Forecast, by Component 2019 & 2032
- Table 68: Global Insight Engines Industry Revenue Million Forecast, by Deployment Type 2019 & 2032
- Table 69: Global Insight Engines Industry Revenue Million Forecast, by Size of the Enterprise 2019 & 2032
- Table 70: Global Insight Engines Industry Revenue Million Forecast, by End-User Industry 2019 & 2032
- Table 71: Global Insight Engines Industry Revenue Million Forecast, by Country 2019 & 2032
- Table 72: Global Insight Engines Industry Revenue Million Forecast, by Component 2019 & 2032
- Table 73: Global Insight Engines Industry Revenue Million Forecast, by Deployment Type 2019 & 2032
- Table 74: Global Insight Engines Industry Revenue Million Forecast, by Size of the Enterprise 2019 & 2032
- Table 75: Global Insight Engines Industry Revenue Million Forecast, by End-User Industry 2019 & 2032
- Table 76: Global Insight Engines Industry Revenue Million Forecast, by Country 2019 & 2032
Frequently Asked Questions
1. What is the projected Compound Annual Growth Rate (CAGR) of the Insight Engines Industry?
The projected CAGR is approximately 26.16%.
2. Which companies are prominent players in the Insight Engines Industry?
Key companies in the market include Mindbreeze GmbH, Funnelback Pty Ltd, Micro Focus International PLC, Insight Engines Inc *List Not Exhaustive, ServiceNow Inc (Attivio Cognitive Search Platform), IntraFind Inc, IBM Corporation, Google LLC, Coveo Solutions Inc, EPAM Systems Inc (Infongen), Microsoft Corporation, Expert System SpA, IHS Markit Ltd, Dassault Systems SA, Sinequa SAS, LucidWorks Inc.
3. What are the main segments of the Insight Engines Industry?
The market segments include Component, Deployment Type, Size of the Enterprise, End-User Industry.
4. Can you provide details about the market size?
The market size is estimated to be USD 1.80 Million as of 2022.
5. What are some drivers contributing to market growth?
Increasing Volumes of Data and the Requirement of Structured Data; Rising Generation of Analytical Queries Via Search and Natural Language Processing.
6. What are the notable trends driving market growth?
The BFSI Segment Expected to Hold a Significant Share.
7. Are there any restraints impacting market growth?
Concerns Regarding the Data Quality and Data Sources Validation.
8. Can you provide examples of recent developments in the market?
February 2022 - The US National Security Research Center (NSRC) announced that Expert.ai's technology would be used as a fundamental component of Titan Technologies' Compendia solution to make digitized documents easier to search and examine. The Compendia solution embeds knowledge and learning in the new NSRC system, Titan on the Red, using AI-based natural language understanding (NLU) and machine learning (ML) offered by expert.ai.
9. What pricing options are available for accessing the report?
Pricing options include single-user, multi-user, and enterprise licenses priced at USD 4750, USD 5250, and USD 8750 respectively.
10. Is the market size provided in terms of value or volume?
The market size is provided in terms of value, measured in Million.
11. Are there any specific market keywords associated with the report?
Yes, the market keyword associated with the report is "Insight Engines Industry," which aids in identifying and referencing the specific market segment covered.
12. How do I determine which pricing option suits my needs best?
The pricing options vary based on user requirements and access needs. Individual users may opt for single-user licenses, while businesses requiring broader access may choose multi-user or enterprise licenses for cost-effective access to the report.
13. Are there any additional resources or data provided in the Insight Engines Industry report?
While the report offers comprehensive insights, it's advisable to review the specific contents or supplementary materials provided to ascertain if additional resources or data are available.
14. How can I stay updated on further developments or reports in the Insight Engines Industry?
To stay informed about further developments, trends, and reports in the Insight Engines Industry, consider subscribing to industry newsletters, following relevant companies and organizations, or regularly checking reputable industry news sources and publications.
Methodology
Step 1 - Identification of Relevant Samples Size from Population Database


Step 2 - Approaches for Defining Global Market Size (Value, Volume* & Price*)

Note*: In applicable scenarios
Step 3 - Data Sources
Primary Research
- Web Analytics
- Survey Reports
- Research Institute
- Latest Research Reports
- Opinion Leaders
Secondary Research
- Annual Reports
- White Paper
- Latest Press Release
- Industry Association
- Paid Database
- Investor Presentations

Step 4 - Data Triangulation
Involves using different sources of information in order to increase the validity of a study
These sources are likely to be stakeholders in a program - participants, other researchers, program staff, other community members, and so on.
Then we put all data in single framework & apply various statistical tools to find out the dynamic on the market.
During the analysis stage, feedback from the stakeholder groups would be compared to determine areas of agreement as well as areas of divergence


