
Key Insights
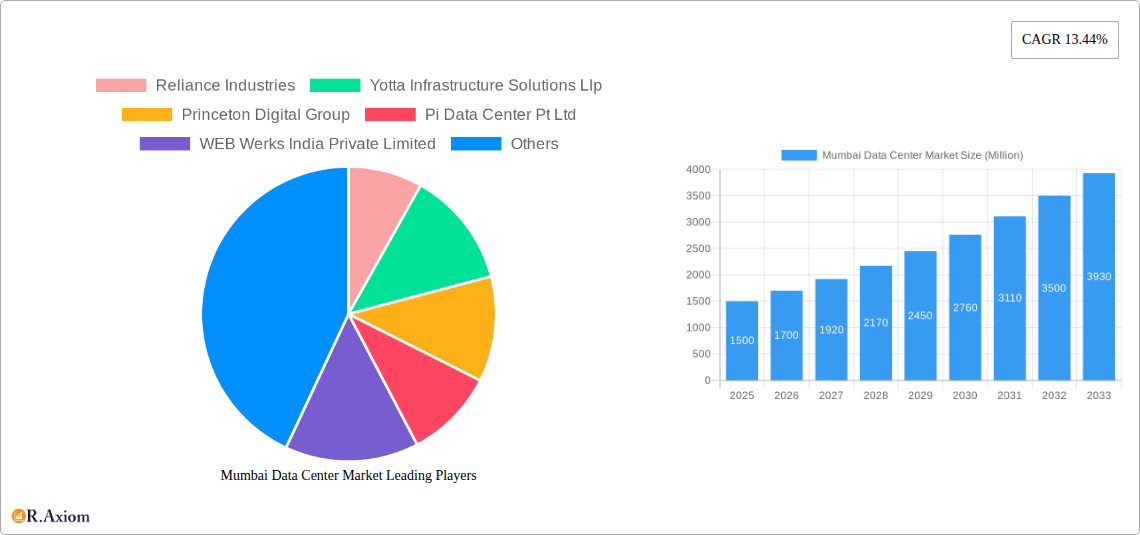
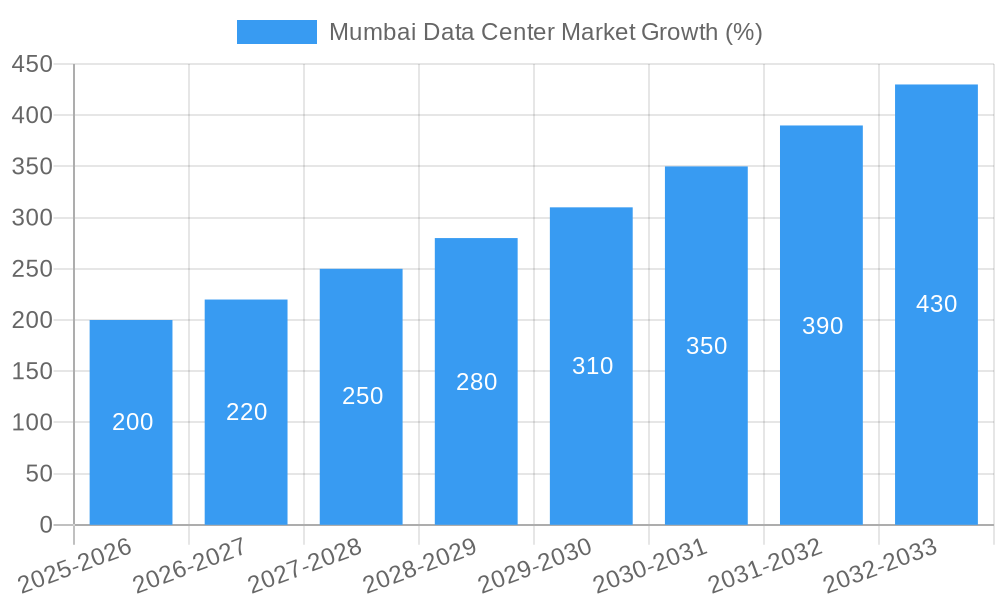
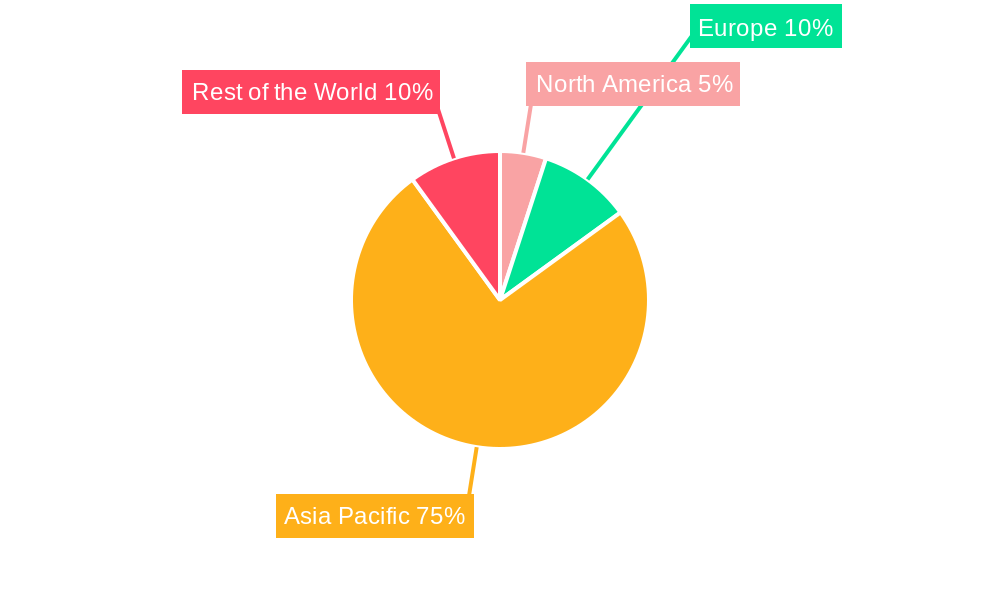
The Mumbai data center market is experiencing robust growth, fueled by India's burgeoning digital economy and increasing demand for cloud services, colocation, and IT infrastructure. A 13.44% CAGR indicates a significant expansion, projecting substantial market value increases over the forecast period (2025-2033). Key drivers include the rise of e-commerce, the expansion of the BFSI sector's digital footprint, and the government's initiatives to promote digital infrastructure. The market is segmented by absorption (utilized and non-utilized space), colocation type (retail, wholesale, hyperscale), end-user (cloud & IT, telecom, media & entertainment, government, BFSI, manufacturing, e-commerce, others), data center size (small, medium, large, massive, mega), and tier type (Tier 1, Tier 2, Tier 3, Tier 4). Competition is fierce, with major players like Reliance Industries, Yotta Infrastructure, and Equinix vying for market share. The hyperscale segment is expected to witness the most significant growth, driven by the increasing adoption of cloud computing and the need for large-scale data storage and processing capabilities. While land scarcity and high infrastructure costs might pose challenges, the overall market outlook remains positive, with substantial opportunities for both established players and new entrants. The strong growth is likely fueled by Mumbai's strategic location, robust connectivity, and skilled workforce, making it a preferred location for data center investments. While precise figures for market size in 2025 are unavailable, using the 13.44% CAGR and assuming a reasonably sized market in 2019 allows for logical estimation of the market value, regional breakdown and segment-wise contribution.
The Mumbai data center market's growth trajectory reflects broader global trends, but with specific nuances. The strong performance in India, and particularly Mumbai, is likely boosted by favorable government policies, a growing tech-savvy population, and increased foreign direct investment in the IT sector. Analyzing the market segments reveals insights into specific growth drivers. For example, the utilized capacity within the colocation space, particularly in the hyperscale segment, will be a key indicator of market health. Growth within the BFSI and e-commerce segments will be particularly important to observe, as these sectors are significant drivers of data center demand. The continued expansion of Tier 1 and Tier 2 data centers suggests strong investor confidence and a positive outlook for the Mumbai market. Monitoring the balance between utilized and non-utilized space will be crucial for assessing future market potential and investment opportunities.
This detailed report provides a comprehensive analysis of the Mumbai data center market, encompassing market size, segmentation, competitive landscape, key drivers, challenges, and future outlook. The study period spans from 2019 to 2033, with 2025 as the base and estimated year. The report utilizes data from the historical period (2019-2024) and provides forecasts for 2025-2033. This in-depth analysis is crucial for industry stakeholders, investors, and businesses seeking to understand the dynamics and opportunities within this rapidly evolving market.
Mumbai Data Center Market Market Concentration & Innovation
The Mumbai data center market exhibits a moderately concentrated landscape, with a few major players holding significant market share. Reliance Industries, Yotta Infrastructure Solutions LLP, and Equinix are among the leading companies, though precise market share in MW is unavailable (xx%). However, the market demonstrates significant innovation, driven by the increasing adoption of cloud computing, the growth of digital services, and the need for robust infrastructure to support the burgeoning Indian economy. Regulatory frameworks, while evolving, generally encourage investment in data center infrastructure. Product substitutes are limited, with the primary alternative being cloud services offered by global players, and the market continues to see robust M&A activity. Recent deals valued at xx Million have reshaped the competitive landscape. End-user trends indicate a strong demand from the cloud and IT sector, BFSI, and e-commerce, while government initiatives are further driving growth.
- Market Concentration: Moderately concentrated, with a few dominant players.
- Innovation Drivers: Cloud adoption, digital service growth, need for robust infrastructure.
- Regulatory Framework: Evolving, generally supportive of data center investment.
- M&A Activity: Significant recent activity with deal values exceeding xx Million.
- End-User Trends: Strong demand from cloud/IT, BFSI, and e-commerce.
Mumbai Data Center Market Industry Trends & Insights
The Mumbai data center market is experiencing robust growth, fueled by a surge in data consumption, digital transformation initiatives across various industries, and the increasing adoption of cloud services. The market's Compound Annual Growth Rate (CAGR) during the forecast period (2025-2033) is projected at xx%, driven by strong demand from hyperscale data centers. Technological disruptions, such as the increasing adoption of edge computing and AI, further contribute to market expansion. Consumer preferences are shifting towards reliable, secure, and energy-efficient data center services, pushing providers to adopt sustainable practices. The competitive landscape is intensely dynamic, with established players expanding their capacities and new entrants entering the market. Market penetration is increasing steadily, fueled by government initiatives promoting digitalization.
Dominant Markets & Segments in Mumbai Data Center Market
The Mumbai data center market exhibits dominance across several segments:
By Absorption: The Utilized segment holds the largest market share, reflecting high demand. Key drivers include the growth of digital services and the rising need for data storage and processing capabilities. Growth is fueled by robust investments and expansion plans from major players. The Non-Utilized capacity represents potential for future growth.
By Colocation Type: The Hyperscale segment dominates, driven by the presence of major cloud providers in Mumbai. The Wholesale segment shows significant growth, fueled by large enterprises’ requirements. Retail colocation also contributes significantly. Key drivers include increasing demand from various industries and the expansion of cloud and IT services.
By End User: The Cloud and IT segment is the largest, reflecting the widespread adoption of cloud computing. BFSI and e-commerce sectors also exhibit high growth, reflecting the increasing digitization of financial services and online retail. Other sectors like Telecom, Media and Entertainment, and Government show steady growth, driven by increasing digitalization and government initiatives.
By DC Size: The Large and Mega data center segments are dominant, indicative of the need for substantial capacity. Key drivers include the increasing demand for larger facilities from hyperscale providers and enterprises.
By Tier Type: Tier III and Tier IV facilities are increasingly prevalent, reflecting the demand for high levels of reliability and redundancy. Growth is driven by the requirements for high availability and disaster recovery capabilities.
Mumbai Data Center Market Product Developments
Recent product innovations focus on energy efficiency, enhanced security features, and increased scalability to meet the demands of hyperscale customers. The adoption of advanced cooling technologies, improved power management systems, and increased connectivity options are enhancing the competitiveness of data center providers. The market sees a strong focus on sustainable practices and environmentally friendly designs.
Report Scope & Segmentation Analysis
This report segments the Mumbai data center market by:
Absorption: Utilized, Non-Utilized. The Utilized segment is projected to grow at xx% CAGR, while Non-Utilized presents significant future potential.
Colocation Type: Retail, Wholesale, Hyperscale. Hyperscale shows the highest growth potential.
End User: Cloud and IT, Telecom, Media and Entertainment, Government, BFSI, Manufacturing, E-commerce, Other End Users. Cloud and IT, BFSI and E-commerce are the fastest-growing segments.
DC Size: Small, Medium, Large, Massive, Mega. Large and Mega segments dominate due to high demand from hyperscale providers.
Tier Type: Tier I, Tier II, Tier III, Tier IV. Higher-tier facilities are growing rapidly. Each segment is analyzed for market size, growth projections, and competitive dynamics.
Key Drivers of Mumbai Data Center Market Growth
The growth of the Mumbai data center market is driven by several factors:
- Technological Advancements: Increased adoption of cloud computing, AI, and edge computing drives demand for data center capacity.
- Economic Growth: India’s burgeoning digital economy fuels demand for data storage and processing.
- Government Initiatives: Government policies supporting digitalization and infrastructure development boost the market.
- Favorable Regulatory Environment: A relatively supportive regulatory framework encourages investments in data centers.
Challenges in the Mumbai Data Center Market Sector
Challenges faced by the Mumbai data center market include:
- Power Infrastructure: Reliable and affordable power supply remains a significant challenge.
- Land Availability: Acquisition of suitable land for large-scale data center development can be difficult.
- Regulatory Hurdles: Navigating regulatory processes can be complex and time-consuming.
- Competition: Intense competition among providers necessitates continuous innovation and cost optimization.
Emerging Opportunities in Mumbai Data Center Market
Emerging opportunities include:
- Edge Computing: Growing demand for low-latency data processing creates opportunities for edge data centers.
- Hyperscale Growth: Continued expansion of hyperscale providers presents substantial growth potential.
- Sustainability Initiatives: Focus on environmentally friendly data centers is creating new opportunities.
- Government Projects: Government initiatives promote digital infrastructure, creating demand.
Leading Players in the Mumbai Data Center Market Market
- Reliance Industries
- Yotta Infrastructure Solutions LLP
- Princeton Digital Group
- Pi Data Center Pvt Ltd
- WEB Werks India Private Limited
- ESDS Software Solution Limited
- Equinix
- Sify Technologies Limited
- NTT Data
- CtrlS
- Nxtra Data Limited
- STT Telemedia
- Colt Technology Services
Key Developments in Mumbai Data Center Market Industry
- Jan 2023: Web Werks announced a new 10 MW data center in Mumbai, expanding its interconnection ecosystem.
- Mar 2022: ZR Power Holdings planned a large data center in Navi Mumbai with over INR 1,700 crore investment.
Strategic Outlook for Mumbai Data Center Market Market
The Mumbai data center market presents significant growth potential driven by the continued expansion of the Indian digital economy, increasing cloud adoption, and government support for digital infrastructure. The market is expected to witness substantial growth in the coming years, presenting numerous opportunities for investors and data center providers. Addressing challenges related to power infrastructure and land availability will be crucial for sustained growth.
Mumbai Data Center Market Segmentation
-
1. DC Size
- 1.1. Small
- 1.2. Medium
- 1.3. Large
- 1.4. Massive
- 1.5. Mega
-
2. Tier Type
- 2.1. Tier 1 and 2
- 2.2. Tier 3
- 2.3. Tier 4
-
3. Absorption
-
3.1. Utilized
-
3.1.1. By Colocation Type
- 3.1.1.1. Retail
- 3.1.1.2. Wholesale
- 3.1.1.3. Hyperscale
-
3.1.2. By End User
- 3.1.2.1. Cloud and IT
- 3.1.2.2. Telecom
- 3.1.2.3. Media and Entertainment
- 3.1.2.4. Government
- 3.1.2.5. BFSI
- 3.1.2.6. Manufacturing
- 3.1.2.7. E-Commerce
- 3.1.2.8. Other End Users
-
3.1.1. By Colocation Type
- 3.2. Non-Utilized
-
3.1. Utilized
Mumbai Data Center Market Segmentation By Geography
-
1. North America
- 1.1. United States
- 1.2. Canada
- 1.3. Mexico
-
2. South America
- 2.1. Brazil
- 2.2. Argentina
- 2.3. Rest of South America
-
3. Europe
- 3.1. United Kingdom
- 3.2. Germany
- 3.3. France
- 3.4. Italy
- 3.5. Spain
- 3.6. Russia
- 3.7. Benelux
- 3.8. Nordics
- 3.9. Rest of Europe
-
4. Middle East & Africa
- 4.1. Turkey
- 4.2. Israel
- 4.3. GCC
- 4.4. North Africa
- 4.5. South Africa
- 4.6. Rest of Middle East & Africa
-
5. Asia Pacific
- 5.1. China
- 5.2. India
- 5.3. Japan
- 5.4. South Korea
- 5.5. ASEAN
- 5.6. Oceania
- 5.7. Rest of Asia Pacific
Mumbai Data Center Market REPORT HIGHLIGHTS
| Aspects | Details |
|---|---|
| Study Period | 2019-2033 |
| Base Year | 2024 |
| Estimated Year | 2025 |
| Forecast Period | 2025-2033 |
| Historical Period | 2019-2024 |
| Growth Rate | CAGR of 13.44% from 2019-2033 |
| Segmentation |
|
Table of Contents
- 1. Introduction
- 1.1. Research Scope
- 1.2. Market Segmentation
- 1.3. Research Methodology
- 1.4. Definitions and Assumptions
- 2. Executive Summary
- 2.1. Introduction
- 3. Market Dynamics
- 3.1. Introduction
- 3.2. Market Drivers
- 3.2.1. Reduction in Power Consumption With the Use of Silicon Photonics Based Transceivers; Growing Need for High-Speed Connectivity and High Data Transfer Capabilities Across Data Centers
- 3.3. Market Restrains
- 3.3.1. Risk of Thermal Effect
- 3.4. Market Trends
- 3.4.1. Smartphones To Drive the Market Growth
- 4. Market Factor Analysis
- 4.1. Porters Five Forces
- 4.2. Supply/Value Chain
- 4.3. PESTEL analysis
- 4.4. Market Entropy
- 4.5. Patent/Trademark Analysis
- 5. Global Mumbai Data Center Market Analysis, Insights and Forecast, 2019-2031
- 5.1. Market Analysis, Insights and Forecast - by DC Size
- 5.1.1. Small
- 5.1.2. Medium
- 5.1.3. Large
- 5.1.4. Massive
- 5.1.5. Mega
- 5.2. Market Analysis, Insights and Forecast - by Tier Type
- 5.2.1. Tier 1 and 2
- 5.2.2. Tier 3
- 5.2.3. Tier 4
- 5.3. Market Analysis, Insights and Forecast - by Absorption
- 5.3.1. Utilized
- 5.3.1.1. By Colocation Type
- 5.3.1.1.1. Retail
- 5.3.1.1.2. Wholesale
- 5.3.1.1.3. Hyperscale
- 5.3.1.2. By End User
- 5.3.1.2.1. Cloud and IT
- 5.3.1.2.2. Telecom
- 5.3.1.2.3. Media and Entertainment
- 5.3.1.2.4. Government
- 5.3.1.2.5. BFSI
- 5.3.1.2.6. Manufacturing
- 5.3.1.2.7. E-Commerce
- 5.3.1.2.8. Other End Users
- 5.3.1.1. By Colocation Type
- 5.3.2. Non-Utilized
- 5.3.1. Utilized
- 5.4. Market Analysis, Insights and Forecast - by Region
- 5.4.1. North America
- 5.4.2. South America
- 5.4.3. Europe
- 5.4.4. Middle East & Africa
- 5.4.5. Asia Pacific
- 5.1. Market Analysis, Insights and Forecast - by DC Size
- 6. North America Mumbai Data Center Market Analysis, Insights and Forecast, 2019-2031
- 6.1. Market Analysis, Insights and Forecast - by DC Size
- 6.1.1. Small
- 6.1.2. Medium
- 6.1.3. Large
- 6.1.4. Massive
- 6.1.5. Mega
- 6.2. Market Analysis, Insights and Forecast - by Tier Type
- 6.2.1. Tier 1 and 2
- 6.2.2. Tier 3
- 6.2.3. Tier 4
- 6.3. Market Analysis, Insights and Forecast - by Absorption
- 6.3.1. Utilized
- 6.3.1.1. By Colocation Type
- 6.3.1.1.1. Retail
- 6.3.1.1.2. Wholesale
- 6.3.1.1.3. Hyperscale
- 6.3.1.2. By End User
- 6.3.1.2.1. Cloud and IT
- 6.3.1.2.2. Telecom
- 6.3.1.2.3. Media and Entertainment
- 6.3.1.2.4. Government
- 6.3.1.2.5. BFSI
- 6.3.1.2.6. Manufacturing
- 6.3.1.2.7. E-Commerce
- 6.3.1.2.8. Other End Users
- 6.3.1.1. By Colocation Type
- 6.3.2. Non-Utilized
- 6.3.1. Utilized
- 6.1. Market Analysis, Insights and Forecast - by DC Size
- 7. South America Mumbai Data Center Market Analysis, Insights and Forecast, 2019-2031
- 7.1. Market Analysis, Insights and Forecast - by DC Size
- 7.1.1. Small
- 7.1.2. Medium
- 7.1.3. Large
- 7.1.4. Massive
- 7.1.5. Mega
- 7.2. Market Analysis, Insights and Forecast - by Tier Type
- 7.2.1. Tier 1 and 2
- 7.2.2. Tier 3
- 7.2.3. Tier 4
- 7.3. Market Analysis, Insights and Forecast - by Absorption
- 7.3.1. Utilized
- 7.3.1.1. By Colocation Type
- 7.3.1.1.1. Retail
- 7.3.1.1.2. Wholesale
- 7.3.1.1.3. Hyperscale
- 7.3.1.2. By End User
- 7.3.1.2.1. Cloud and IT
- 7.3.1.2.2. Telecom
- 7.3.1.2.3. Media and Entertainment
- 7.3.1.2.4. Government
- 7.3.1.2.5. BFSI
- 7.3.1.2.6. Manufacturing
- 7.3.1.2.7. E-Commerce
- 7.3.1.2.8. Other End Users
- 7.3.1.1. By Colocation Type
- 7.3.2. Non-Utilized
- 7.3.1. Utilized
- 7.1. Market Analysis, Insights and Forecast - by DC Size
- 8. Europe Mumbai Data Center Market Analysis, Insights and Forecast, 2019-2031
- 8.1. Market Analysis, Insights and Forecast - by DC Size
- 8.1.1. Small
- 8.1.2. Medium
- 8.1.3. Large
- 8.1.4. Massive
- 8.1.5. Mega
- 8.2. Market Analysis, Insights and Forecast - by Tier Type
- 8.2.1. Tier 1 and 2
- 8.2.2. Tier 3
- 8.2.3. Tier 4
- 8.3. Market Analysis, Insights and Forecast - by Absorption
- 8.3.1. Utilized
- 8.3.1.1. By Colocation Type
- 8.3.1.1.1. Retail
- 8.3.1.1.2. Wholesale
- 8.3.1.1.3. Hyperscale
- 8.3.1.2. By End User
- 8.3.1.2.1. Cloud and IT
- 8.3.1.2.2. Telecom
- 8.3.1.2.3. Media and Entertainment
- 8.3.1.2.4. Government
- 8.3.1.2.5. BFSI
- 8.3.1.2.6. Manufacturing
- 8.3.1.2.7. E-Commerce
- 8.3.1.2.8. Other End Users
- 8.3.1.1. By Colocation Type
- 8.3.2. Non-Utilized
- 8.3.1. Utilized
- 8.1. Market Analysis, Insights and Forecast - by DC Size
- 9. Middle East & Africa Mumbai Data Center Market Analysis, Insights and Forecast, 2019-2031
- 9.1. Market Analysis, Insights and Forecast - by DC Size
- 9.1.1. Small
- 9.1.2. Medium
- 9.1.3. Large
- 9.1.4. Massive
- 9.1.5. Mega
- 9.2. Market Analysis, Insights and Forecast - by Tier Type
- 9.2.1. Tier 1 and 2
- 9.2.2. Tier 3
- 9.2.3. Tier 4
- 9.3. Market Analysis, Insights and Forecast - by Absorption
- 9.3.1. Utilized
- 9.3.1.1. By Colocation Type
- 9.3.1.1.1. Retail
- 9.3.1.1.2. Wholesale
- 9.3.1.1.3. Hyperscale
- 9.3.1.2. By End User
- 9.3.1.2.1. Cloud and IT
- 9.3.1.2.2. Telecom
- 9.3.1.2.3. Media and Entertainment
- 9.3.1.2.4. Government
- 9.3.1.2.5. BFSI
- 9.3.1.2.6. Manufacturing
- 9.3.1.2.7. E-Commerce
- 9.3.1.2.8. Other End Users
- 9.3.1.1. By Colocation Type
- 9.3.2. Non-Utilized
- 9.3.1. Utilized
- 9.1. Market Analysis, Insights and Forecast - by DC Size
- 10. Asia Pacific Mumbai Data Center Market Analysis, Insights and Forecast, 2019-2031
- 10.1. Market Analysis, Insights and Forecast - by DC Size
- 10.1.1. Small
- 10.1.2. Medium
- 10.1.3. Large
- 10.1.4. Massive
- 10.1.5. Mega
- 10.2. Market Analysis, Insights and Forecast - by Tier Type
- 10.2.1. Tier 1 and 2
- 10.2.2. Tier 3
- 10.2.3. Tier 4
- 10.3. Market Analysis, Insights and Forecast - by Absorption
- 10.3.1. Utilized
- 10.3.1.1. By Colocation Type
- 10.3.1.1.1. Retail
- 10.3.1.1.2. Wholesale
- 10.3.1.1.3. Hyperscale
- 10.3.1.2. By End User
- 10.3.1.2.1. Cloud and IT
- 10.3.1.2.2. Telecom
- 10.3.1.2.3. Media and Entertainment
- 10.3.1.2.4. Government
- 10.3.1.2.5. BFSI
- 10.3.1.2.6. Manufacturing
- 10.3.1.2.7. E-Commerce
- 10.3.1.2.8. Other End Users
- 10.3.1.1. By Colocation Type
- 10.3.2. Non-Utilized
- 10.3.1. Utilized
- 10.1. Market Analysis, Insights and Forecast - by DC Size
- 11. North America Mumbai Data Center Market Analysis, Insights and Forecast, 2019-2031
- 11.1. Market Analysis, Insights and Forecast - By Country/Sub-region
- 11.1.1.
- 12. Europe Mumbai Data Center Market Analysis, Insights and Forecast, 2019-2031
- 12.1. Market Analysis, Insights and Forecast - By Country/Sub-region
- 12.1.1.
- 13. Asia Pacific Mumbai Data Center Market Analysis, Insights and Forecast, 2019-2031
- 13.1. Market Analysis, Insights and Forecast - By Country/Sub-region
- 13.1.1.
- 14. Rest of the World Mumbai Data Center Market Analysis, Insights and Forecast, 2019-2031
- 14.1. Market Analysis, Insights and Forecast - By Country/Sub-region
- 14.1.1.
- 15. Competitive Analysis
- 15.1. Global Market Share Analysis 2024
- 15.2. Company Profiles
- 15.2.1 Reliance Industries
- 15.2.1.1. Overview
- 15.2.1.2. Products
- 15.2.1.3. SWOT Analysis
- 15.2.1.4. Recent Developments
- 15.2.1.5. Financials (Based on Availability)
- 15.2.2 Yotta Infrastructure Solutions Llp
- 15.2.2.1. Overview
- 15.2.2.2. Products
- 15.2.2.3. SWOT Analysis
- 15.2.2.4. Recent Developments
- 15.2.2.5. Financials (Based on Availability)
- 15.2.3 Princeton Digital Group
- 15.2.3.1. Overview
- 15.2.3.2. Products
- 15.2.3.3. SWOT Analysis
- 15.2.3.4. Recent Developments
- 15.2.3.5. Financials (Based on Availability)
- 15.2.4 Pi Data Center Pt Ltd
- 15.2.4.1. Overview
- 15.2.4.2. Products
- 15.2.4.3. SWOT Analysis
- 15.2.4.4. Recent Developments
- 15.2.4.5. Financials (Based on Availability)
- 15.2.5 WEB Werks India Private Limited
- 15.2.5.1. Overview
- 15.2.5.2. Products
- 15.2.5.3. SWOT Analysis
- 15.2.5.4. Recent Developments
- 15.2.5.5. Financials (Based on Availability)
- 15.2.6 ESDS Software Solution Limited
- 15.2.6.1. Overview
- 15.2.6.2. Products
- 15.2.6.3. SWOT Analysis
- 15.2.6.4. Recent Developments
- 15.2.6.5. Financials (Based on Availability)
- 15.2.7 Equinix
- 15.2.7.1. Overview
- 15.2.7.2. Products
- 15.2.7.3. SWOT Analysis
- 15.2.7.4. Recent Developments
- 15.2.7.5. Financials (Based on Availability)
- 15.2.8 Sify Technologies Limited
- 15.2.8.1. Overview
- 15.2.8.2. Products
- 15.2.8.3. SWOT Analysis
- 15.2.8.4. Recent Developments
- 15.2.8.5. Financials (Based on Availability)
- 15.2.9 NTT Data
- 15.2.9.1. Overview
- 15.2.9.2. Products
- 15.2.9.3. SWOT Analysis
- 15.2.9.4. Recent Developments
- 15.2.9.5. Financials (Based on Availability)
- 15.2.10 CtrlS
- 15.2.10.1. Overview
- 15.2.10.2. Products
- 15.2.10.3. SWOT Analysis
- 15.2.10.4. Recent Developments
- 15.2.10.5. Financials (Based on Availability)
- 15.2.11 Nxtra Data Limited
- 15.2.11.1. Overview
- 15.2.11.2. Products
- 15.2.11.3. SWOT Analysis
- 15.2.11.4. Recent Developments
- 15.2.11.5. Financials (Based on Availability)
- 15.2.12 STT Telemedia
- 15.2.12.1. Overview
- 15.2.12.2. Products
- 15.2.12.3. SWOT Analysis
- 15.2.12.4. Recent Developments
- 15.2.12.5. Financials (Based on Availability)
- 15.2.13 Colt Technology Services7 2 Market Share Analysis (In terms of MW)7 3 List of Companie
- 15.2.13.1. Overview
- 15.2.13.2. Products
- 15.2.13.3. SWOT Analysis
- 15.2.13.4. Recent Developments
- 15.2.13.5. Financials (Based on Availability)
- 15.2.1 Reliance Industries
List of Figures
- Figure 1: Global Mumbai Data Center Market Revenue Breakdown (Million, %) by Region 2024 & 2032
- Figure 2: North America Mumbai Data Center Market Revenue (Million), by Country 2024 & 2032
- Figure 3: North America Mumbai Data Center Market Revenue Share (%), by Country 2024 & 2032
- Figure 4: Europe Mumbai Data Center Market Revenue (Million), by Country 2024 & 2032
- Figure 5: Europe Mumbai Data Center Market Revenue Share (%), by Country 2024 & 2032
- Figure 6: Asia Pacific Mumbai Data Center Market Revenue (Million), by Country 2024 & 2032
- Figure 7: Asia Pacific Mumbai Data Center Market Revenue Share (%), by Country 2024 & 2032
- Figure 8: Rest of the World Mumbai Data Center Market Revenue (Million), by Country 2024 & 2032
- Figure 9: Rest of the World Mumbai Data Center Market Revenue Share (%), by Country 2024 & 2032
- Figure 10: North America Mumbai Data Center Market Revenue (Million), by DC Size 2024 & 2032
- Figure 11: North America Mumbai Data Center Market Revenue Share (%), by DC Size 2024 & 2032
- Figure 12: North America Mumbai Data Center Market Revenue (Million), by Tier Type 2024 & 2032
- Figure 13: North America Mumbai Data Center Market Revenue Share (%), by Tier Type 2024 & 2032
- Figure 14: North America Mumbai Data Center Market Revenue (Million), by Absorption 2024 & 2032
- Figure 15: North America Mumbai Data Center Market Revenue Share (%), by Absorption 2024 & 2032
- Figure 16: North America Mumbai Data Center Market Revenue (Million), by Country 2024 & 2032
- Figure 17: North America Mumbai Data Center Market Revenue Share (%), by Country 2024 & 2032
- Figure 18: South America Mumbai Data Center Market Revenue (Million), by DC Size 2024 & 2032
- Figure 19: South America Mumbai Data Center Market Revenue Share (%), by DC Size 2024 & 2032
- Figure 20: South America Mumbai Data Center Market Revenue (Million), by Tier Type 2024 & 2032
- Figure 21: South America Mumbai Data Center Market Revenue Share (%), by Tier Type 2024 & 2032
- Figure 22: South America Mumbai Data Center Market Revenue (Million), by Absorption 2024 & 2032
- Figure 23: South America Mumbai Data Center Market Revenue Share (%), by Absorption 2024 & 2032
- Figure 24: South America Mumbai Data Center Market Revenue (Million), by Country 2024 & 2032
- Figure 25: South America Mumbai Data Center Market Revenue Share (%), by Country 2024 & 2032
- Figure 26: Europe Mumbai Data Center Market Revenue (Million), by DC Size 2024 & 2032
- Figure 27: Europe Mumbai Data Center Market Revenue Share (%), by DC Size 2024 & 2032
- Figure 28: Europe Mumbai Data Center Market Revenue (Million), by Tier Type 2024 & 2032
- Figure 29: Europe Mumbai Data Center Market Revenue Share (%), by Tier Type 2024 & 2032
- Figure 30: Europe Mumbai Data Center Market Revenue (Million), by Absorption 2024 & 2032
- Figure 31: Europe Mumbai Data Center Market Revenue Share (%), by Absorption 2024 & 2032
- Figure 32: Europe Mumbai Data Center Market Revenue (Million), by Country 2024 & 2032
- Figure 33: Europe Mumbai Data Center Market Revenue Share (%), by Country 2024 & 2032
- Figure 34: Middle East & Africa Mumbai Data Center Market Revenue (Million), by DC Size 2024 & 2032
- Figure 35: Middle East & Africa Mumbai Data Center Market Revenue Share (%), by DC Size 2024 & 2032
- Figure 36: Middle East & Africa Mumbai Data Center Market Revenue (Million), by Tier Type 2024 & 2032
- Figure 37: Middle East & Africa Mumbai Data Center Market Revenue Share (%), by Tier Type 2024 & 2032
- Figure 38: Middle East & Africa Mumbai Data Center Market Revenue (Million), by Absorption 2024 & 2032
- Figure 39: Middle East & Africa Mumbai Data Center Market Revenue Share (%), by Absorption 2024 & 2032
- Figure 40: Middle East & Africa Mumbai Data Center Market Revenue (Million), by Country 2024 & 2032
- Figure 41: Middle East & Africa Mumbai Data Center Market Revenue Share (%), by Country 2024 & 2032
- Figure 42: Asia Pacific Mumbai Data Center Market Revenue (Million), by DC Size 2024 & 2032
- Figure 43: Asia Pacific Mumbai Data Center Market Revenue Share (%), by DC Size 2024 & 2032
- Figure 44: Asia Pacific Mumbai Data Center Market Revenue (Million), by Tier Type 2024 & 2032
- Figure 45: Asia Pacific Mumbai Data Center Market Revenue Share (%), by Tier Type 2024 & 2032
- Figure 46: Asia Pacific Mumbai Data Center Market Revenue (Million), by Absorption 2024 & 2032
- Figure 47: Asia Pacific Mumbai Data Center Market Revenue Share (%), by Absorption 2024 & 2032
- Figure 48: Asia Pacific Mumbai Data Center Market Revenue (Million), by Country 2024 & 2032
- Figure 49: Asia Pacific Mumbai Data Center Market Revenue Share (%), by Country 2024 & 2032
List of Tables
- Table 1: Global Mumbai Data Center Market Revenue Million Forecast, by Region 2019 & 2032
- Table 2: Global Mumbai Data Center Market Revenue Million Forecast, by DC Size 2019 & 2032
- Table 3: Global Mumbai Data Center Market Revenue Million Forecast, by Tier Type 2019 & 2032
- Table 4: Global Mumbai Data Center Market Revenue Million Forecast, by Absorption 2019 & 2032
- Table 5: Global Mumbai Data Center Market Revenue Million Forecast, by Region 2019 & 2032
- Table 6: Global Mumbai Data Center Market Revenue Million Forecast, by Country 2019 & 2032
- Table 7: Mumbai Data Center Market Revenue (Million) Forecast, by Application 2019 & 2032
- Table 8: Global Mumbai Data Center Market Revenue Million Forecast, by Country 2019 & 2032
- Table 9: Mumbai Data Center Market Revenue (Million) Forecast, by Application 2019 & 2032
- Table 10: Global Mumbai Data Center Market Revenue Million Forecast, by Country 2019 & 2032
- Table 11: Mumbai Data Center Market Revenue (Million) Forecast, by Application 2019 & 2032
- Table 12: Global Mumbai Data Center Market Revenue Million Forecast, by Country 2019 & 2032
- Table 13: Mumbai Data Center Market Revenue (Million) Forecast, by Application 2019 & 2032
- Table 14: Global Mumbai Data Center Market Revenue Million Forecast, by DC Size 2019 & 2032
- Table 15: Global Mumbai Data Center Market Revenue Million Forecast, by Tier Type 2019 & 2032
- Table 16: Global Mumbai Data Center Market Revenue Million Forecast, by Absorption 2019 & 2032
- Table 17: Global Mumbai Data Center Market Revenue Million Forecast, by Country 2019 & 2032
- Table 18: United States Mumbai Data Center Market Revenue (Million) Forecast, by Application 2019 & 2032
- Table 19: Canada Mumbai Data Center Market Revenue (Million) Forecast, by Application 2019 & 2032
- Table 20: Mexico Mumbai Data Center Market Revenue (Million) Forecast, by Application 2019 & 2032
- Table 21: Global Mumbai Data Center Market Revenue Million Forecast, by DC Size 2019 & 2032
- Table 22: Global Mumbai Data Center Market Revenue Million Forecast, by Tier Type 2019 & 2032
- Table 23: Global Mumbai Data Center Market Revenue Million Forecast, by Absorption 2019 & 2032
- Table 24: Global Mumbai Data Center Market Revenue Million Forecast, by Country 2019 & 2032
- Table 25: Brazil Mumbai Data Center Market Revenue (Million) Forecast, by Application 2019 & 2032
- Table 26: Argentina Mumbai Data Center Market Revenue (Million) Forecast, by Application 2019 & 2032
- Table 27: Rest of South America Mumbai Data Center Market Revenue (Million) Forecast, by Application 2019 & 2032
- Table 28: Global Mumbai Data Center Market Revenue Million Forecast, by DC Size 2019 & 2032
- Table 29: Global Mumbai Data Center Market Revenue Million Forecast, by Tier Type 2019 & 2032
- Table 30: Global Mumbai Data Center Market Revenue Million Forecast, by Absorption 2019 & 2032
- Table 31: Global Mumbai Data Center Market Revenue Million Forecast, by Country 2019 & 2032
- Table 32: United Kingdom Mumbai Data Center Market Revenue (Million) Forecast, by Application 2019 & 2032
- Table 33: Germany Mumbai Data Center Market Revenue (Million) Forecast, by Application 2019 & 2032
- Table 34: France Mumbai Data Center Market Revenue (Million) Forecast, by Application 2019 & 2032
- Table 35: Italy Mumbai Data Center Market Revenue (Million) Forecast, by Application 2019 & 2032
- Table 36: Spain Mumbai Data Center Market Revenue (Million) Forecast, by Application 2019 & 2032
- Table 37: Russia Mumbai Data Center Market Revenue (Million) Forecast, by Application 2019 & 2032
- Table 38: Benelux Mumbai Data Center Market Revenue (Million) Forecast, by Application 2019 & 2032
- Table 39: Nordics Mumbai Data Center Market Revenue (Million) Forecast, by Application 2019 & 2032
- Table 40: Rest of Europe Mumbai Data Center Market Revenue (Million) Forecast, by Application 2019 & 2032
- Table 41: Global Mumbai Data Center Market Revenue Million Forecast, by DC Size 2019 & 2032
- Table 42: Global Mumbai Data Center Market Revenue Million Forecast, by Tier Type 2019 & 2032
- Table 43: Global Mumbai Data Center Market Revenue Million Forecast, by Absorption 2019 & 2032
- Table 44: Global Mumbai Data Center Market Revenue Million Forecast, by Country 2019 & 2032
- Table 45: Turkey Mumbai Data Center Market Revenue (Million) Forecast, by Application 2019 & 2032
- Table 46: Israel Mumbai Data Center Market Revenue (Million) Forecast, by Application 2019 & 2032
- Table 47: GCC Mumbai Data Center Market Revenue (Million) Forecast, by Application 2019 & 2032
- Table 48: North Africa Mumbai Data Center Market Revenue (Million) Forecast, by Application 2019 & 2032
- Table 49: South Africa Mumbai Data Center Market Revenue (Million) Forecast, by Application 2019 & 2032
- Table 50: Rest of Middle East & Africa Mumbai Data Center Market Revenue (Million) Forecast, by Application 2019 & 2032
- Table 51: Global Mumbai Data Center Market Revenue Million Forecast, by DC Size 2019 & 2032
- Table 52: Global Mumbai Data Center Market Revenue Million Forecast, by Tier Type 2019 & 2032
- Table 53: Global Mumbai Data Center Market Revenue Million Forecast, by Absorption 2019 & 2032
- Table 54: Global Mumbai Data Center Market Revenue Million Forecast, by Country 2019 & 2032
- Table 55: China Mumbai Data Center Market Revenue (Million) Forecast, by Application 2019 & 2032
- Table 56: India Mumbai Data Center Market Revenue (Million) Forecast, by Application 2019 & 2032
- Table 57: Japan Mumbai Data Center Market Revenue (Million) Forecast, by Application 2019 & 2032
- Table 58: South Korea Mumbai Data Center Market Revenue (Million) Forecast, by Application 2019 & 2032
- Table 59: ASEAN Mumbai Data Center Market Revenue (Million) Forecast, by Application 2019 & 2032
- Table 60: Oceania Mumbai Data Center Market Revenue (Million) Forecast, by Application 2019 & 2032
- Table 61: Rest of Asia Pacific Mumbai Data Center Market Revenue (Million) Forecast, by Application 2019 & 2032
Frequently Asked Questions
1. What is the projected Compound Annual Growth Rate (CAGR) of the Mumbai Data Center Market?
The projected CAGR is approximately 13.44%.
2. Which companies are prominent players in the Mumbai Data Center Market?
Key companies in the market include Reliance Industries, Yotta Infrastructure Solutions Llp, Princeton Digital Group, Pi Data Center Pt Ltd, WEB Werks India Private Limited, ESDS Software Solution Limited, Equinix, Sify Technologies Limited, NTT Data, CtrlS, Nxtra Data Limited, STT Telemedia, Colt Technology Services7 2 Market Share Analysis (In terms of MW)7 3 List of Companie.
3. What are the main segments of the Mumbai Data Center Market?
The market segments include DC Size, Tier Type, Absorption.
4. Can you provide details about the market size?
The market size is estimated to be USD XX Million as of 2022.
5. What are some drivers contributing to market growth?
Reduction in Power Consumption With the Use of Silicon Photonics Based Transceivers; Growing Need for High-Speed Connectivity and High Data Transfer Capabilities Across Data Centers.
6. What are the notable trends driving market growth?
Smartphones To Drive the Market Growth.
7. Are there any restraints impacting market growth?
Risk of Thermal Effect.
8. Can you provide examples of recent developments in the market?
Jan 2023: The company announced that Web Werks will open a new data center in Mumbai, India. The building, known as the Mumbai-2 data center, will have a 120,000-square-foot (11,150 square meters) footprint and a 10 MW capacity. Mumbai-2 DC will give enterprise customers the densest interconnection ecosystem in APAC, with 200+ ISPs, all major carriers, internet exchanges, cloud service providers, and content delivery networks. Mumbai-2 DC will complement the current Mumbai-1 DC.
9. What pricing options are available for accessing the report?
Pricing options include single-user, multi-user, and enterprise licenses priced at USD 3800, USD 4500, and USD 5800 respectively.
10. Is the market size provided in terms of value or volume?
The market size is provided in terms of value, measured in Million.
11. Are there any specific market keywords associated with the report?
Yes, the market keyword associated with the report is "Mumbai Data Center Market," which aids in identifying and referencing the specific market segment covered.
12. How do I determine which pricing option suits my needs best?
The pricing options vary based on user requirements and access needs. Individual users may opt for single-user licenses, while businesses requiring broader access may choose multi-user or enterprise licenses for cost-effective access to the report.
13. Are there any additional resources or data provided in the Mumbai Data Center Market report?
While the report offers comprehensive insights, it's advisable to review the specific contents or supplementary materials provided to ascertain if additional resources or data are available.
14. How can I stay updated on further developments or reports in the Mumbai Data Center Market?
To stay informed about further developments, trends, and reports in the Mumbai Data Center Market, consider subscribing to industry newsletters, following relevant companies and organizations, or regularly checking reputable industry news sources and publications.
Methodology
Step 1 - Identification of Relevant Samples Size from Population Database


Step 2 - Approaches for Defining Global Market Size (Value, Volume* & Price*)

Note*: In applicable scenarios
Step 3 - Data Sources
Primary Research
- Web Analytics
- Survey Reports
- Research Institute
- Latest Research Reports
- Opinion Leaders
Secondary Research
- Annual Reports
- White Paper
- Latest Press Release
- Industry Association
- Paid Database
- Investor Presentations

Step 4 - Data Triangulation
Involves using different sources of information in order to increase the validity of a study
These sources are likely to be stakeholders in a program - participants, other researchers, program staff, other community members, and so on.
Then we put all data in single framework & apply various statistical tools to find out the dynamic on the market.
During the analysis stage, feedback from the stakeholder groups would be compared to determine areas of agreement as well as areas of divergence


