
Key Insights
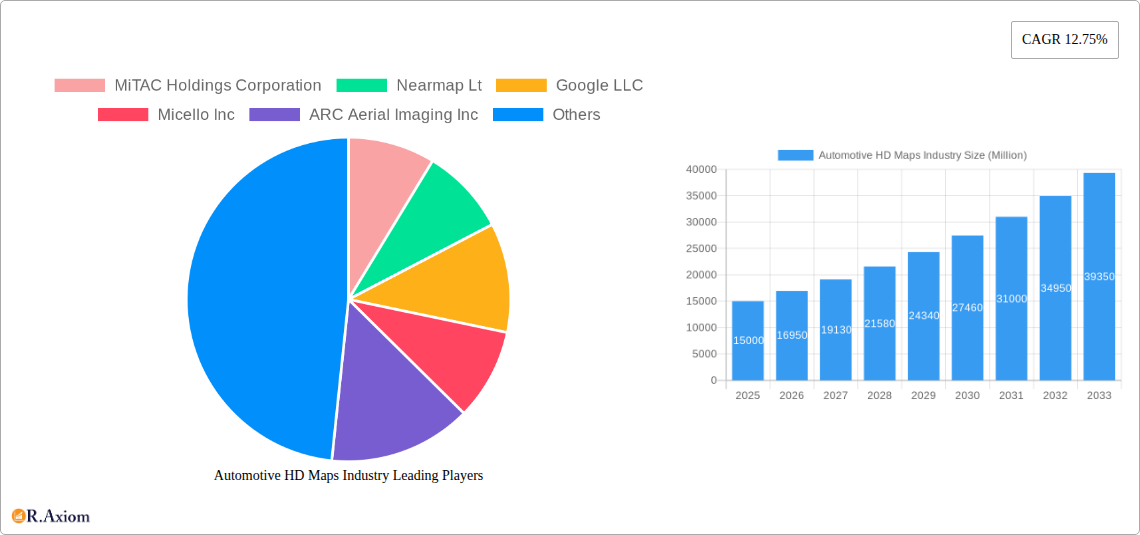
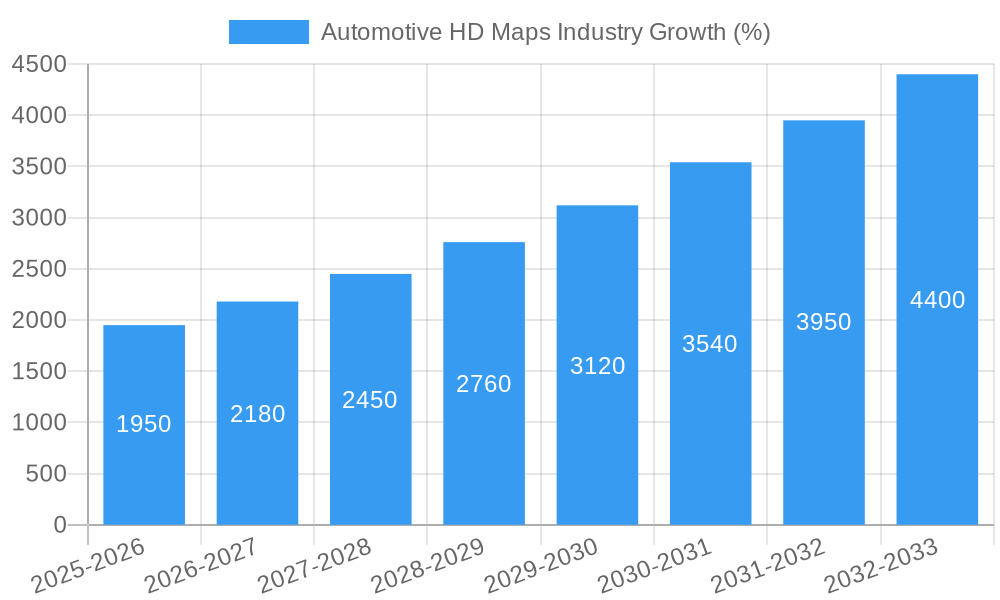
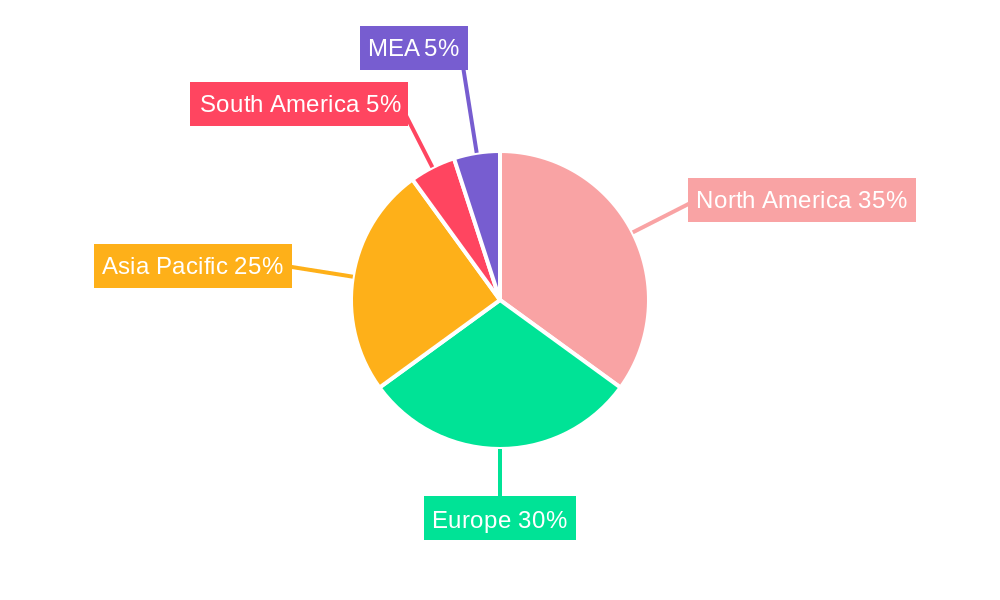
The Automotive HD Maps market is experiencing robust growth, driven by the increasing adoption of autonomous vehicles, advanced driver-assistance systems (ADAS), and fleet management solutions. The market's Compound Annual Growth Rate (CAGR) of 12.75% from 2019 to 2024 indicates significant expansion, projected to continue through 2033. This growth is fueled by several key factors: the imperative for safer and more efficient transportation, advancements in sensor technology enabling highly accurate map creation, and the rising demand for real-time location services. Key applications such as autonomous driving heavily rely on the precision and detail provided by HD maps, contributing substantially to market value. The market is segmented into components (solutions and services) and applications (autonomous cars, fleet management, and ADAS). Solutions are projected to hold a larger market share due to the increasing complexity of autonomous driving systems requiring sophisticated mapping solutions. Geographic regions such as North America and Europe are currently leading the market due to significant investments in autonomous vehicle technology and well-established infrastructure. However, rapidly developing economies in Asia-Pacific are expected to witness substantial growth in the coming years, driven by increasing vehicle ownership and government initiatives supporting technological advancements. Competition in the market is intense, with established players like Google, TomTom, and HERE Technologies competing against emerging companies specializing in specific map-related technologies.
The competitive landscape is shaping market strategies, with companies focusing on partnerships, acquisitions, and technological innovations to maintain a leading edge. Restraints to growth include the high initial investment costs associated with HD map development and deployment, concerns surrounding data security and privacy, and the need for robust regulatory frameworks to ensure safety and standardization. Despite these challenges, the long-term outlook for the Automotive HD Maps market remains optimistic, driven by continuous technological advancements, increasing government regulations promoting autonomous driving, and the ever-growing demand for improved transportation solutions globally. The market is expected to witness significant expansion across all segments and regions, particularly in emerging economies with increasing technological adoption.
Automotive HD Maps Industry: A Comprehensive Market Report (2019-2033)
This in-depth report provides a comprehensive analysis of the Automotive HD Maps industry, offering invaluable insights for stakeholders, investors, and industry professionals. Covering the period from 2019 to 2033, with a focus on 2025, this report meticulously examines market trends, competitive dynamics, and future growth prospects. The global Automotive HD Maps market is projected to reach xx Million by 2033, exhibiting a CAGR of xx% during the forecast period (2025-2033).
Automotive HD Maps Industry Market Concentration & Innovation
This section analyzes the market concentration, innovation drivers, regulatory landscape, and competitive activities within the Automotive HD Maps industry. The market exhibits a moderately concentrated structure with key players like Google LLC, TomTom NV, and HERE Technologies holding significant market share. However, the emergence of new players and technological advancements is fostering increased competition. The estimated market share for Google LLC in 2025 is xx%, followed by TomTom NV at xx% and HERE Technologies at xx%. M&A activity has been significant, with deal values exceeding xx Million in the historical period (2019-2024). Key innovation drivers include advancements in sensor technology, artificial intelligence, and high-precision positioning systems. Regulatory frameworks, particularly concerning data privacy and security, are shaping industry practices. Product substitutes, such as traditional map data, are facing increasing pressure due to the superior accuracy and features offered by HD maps. End-user trends indicate a strong preference for enhanced safety and autonomous driving capabilities, further fueling the demand for HD maps.
- Market Concentration: Moderately concentrated, with top 3 players holding xx% of market share in 2025.
- Innovation Drivers: Advancements in AI, sensor technology, and positioning systems.
- Regulatory Frameworks: Data privacy and security regulations are key considerations.
- M&A Activity: Total deal value exceeded xx Million between 2019 and 2024.
- End-User Trends: Strong preference for enhanced safety and autonomous driving features.
Automotive HD Maps Industry Industry Trends & Insights
The Automotive HD Maps industry is experiencing robust growth driven by the rapid expansion of autonomous vehicles and ADAS systems. The market is witnessing technological disruptions, including the integration of 5G technology and the increasing adoption of cloud-based map services. Consumer preferences are shifting towards seamless, real-time navigation and personalized driving experiences. Competitive dynamics are characterized by intense rivalry among established players and the emergence of new entrants, particularly in the provision of specialized map data for specific applications. The market's CAGR during the historical period (2019-2024) was xx%, and the market penetration for HD maps in autonomous vehicles reached xx% by 2024. This growth trajectory is expected to continue, driven by the increasing demand for enhanced navigation, safety, and autonomous driving functionalities. The market is witnessing a trend towards the development of highly specialized HD map solutions tailored to specific vehicle manufacturers and geographic regions.
Dominant Markets & Segments in Automotive HD Maps Industry
The North American region currently dominates the Automotive HD Maps market, driven by strong demand from the autonomous vehicle sector and the presence of major technology companies. Within applications, the Autonomous Cars segment is leading market growth, followed by ADAS. In terms of components, the Solutions segment holds a significant share, owing to its ability to offer a comprehensive suite of tools and capabilities.
Key Drivers:
- North America: High adoption of autonomous vehicles, presence of major technology companies, and favorable regulatory environment.
- Autonomous Cars Segment: Rapid growth fueled by technological advancements and increased investment in self-driving technology.
- Solutions Component: Offers comprehensive tools and capabilities, addressing diverse user requirements.
Dominance Analysis: The North American region benefits from robust investment in autonomous driving technologies and a proactive regulatory environment. This fuels the high demand for high-definition maps within the region, surpassing other geographic areas. The Autonomous Cars segment's dominance is driven by the significant investments made in developing self-driving capabilities, thus creating a need for precise, detailed map data. The Solutions component's strong position arises from its ability to offer a complete package, catering to various aspects of HD map integration and management, hence appealing to diverse clients.
Automotive HD Maps Industry Product Developments
Recent product innovations include the development of highly accurate and detailed 3D maps, incorporating real-time data updates and advanced features such as lane-level information and point cloud data. These innovations enhance safety and improve the performance of autonomous driving systems. Key competitive advantages lie in the accuracy, completeness, and frequency of map updates, as well as the integration with other vehicle systems. The market is also witnessing a trend towards the development of specialized HD maps for specific vehicle models and geographic regions.
Report Scope & Segmentation Analysis
This report segments the Automotive HD Maps market by component (Solutions, Services), and application (Autonomous Cars, Fleet Management, ADAS). The Solutions segment offers map data, software, and tools, projected to reach xx Million by 2033. The Services segment includes data updates, maintenance, and support, anticipated to reach xx Million by 2033. Autonomous Cars, the largest application segment, is expected to grow to xx Million by 2033, followed by ADAS at xx Million. The competitive landscape varies across segments; for example, the Solutions segment is characterized by intense competition amongst established players, while the Autonomous Cars segment sees significant investment and collaboration.
Key Drivers of Automotive HD Maps Industry Growth
Several key factors are driving the growth of the Automotive HD Maps industry. The increasing adoption of autonomous vehicles and ADAS systems is the primary driver, demanding highly accurate and detailed map data for safe and efficient operation. Technological advancements, such as improved sensor technology and AI algorithms, contribute to enhanced map accuracy and functionality. Government regulations and initiatives promoting autonomous driving also support market growth. Furthermore, increased investment in R&D and infrastructure development are further fueling this rapid expansion.
Challenges in the Automotive HD Maps Industry Sector
Challenges include the high cost of data acquisition and processing, the need for frequent updates to maintain accuracy, and concerns about data privacy and security. Regulatory hurdles in different regions also pose challenges for market expansion. Competition from established players and new entrants further complicates the market dynamics. These factors, collectively, can impact the overall growth trajectory and profitability of companies in the industry. The estimated impact of these challenges on market growth is a reduction of xx% in the projected revenue by 2033.
Emerging Opportunities in Automotive HD Maps Industry
Emerging opportunities include the expansion into new geographic markets, particularly in developing countries with growing automotive sectors, and the integration of HD maps with other emerging technologies, such as V2X communication. The increasing demand for personalized and location-based services also presents opportunities for specialized HD map applications. The development of highly specialized HD map solutions tailored for specific vehicle models and functionalities also creates new avenues for market expansion.
Leading Players in the Automotive HD Maps Industry Market
- MiTAC Holdings Corporation
- Nearmap Lt
- Google LLC
- Micello Inc
- ARC Aerial Imaging Inc
- Mapquest Inc
- ESRI Inc
- TomTom NV
- Apple Inc
- HERE Technologies
Key Developments in Automotive HD Maps Industry Industry
- 2022-Q4: Google LLC announced a significant expansion of its HD map coverage in North America.
- 2023-Q1: TomTom NV launched a new platform for real-time map updates.
- 2024-Q2: HERE Technologies partnered with a major automotive manufacturer to develop customized HD maps. (Further developments can be added here)
Strategic Outlook for Automotive HD Maps Industry Market
The Automotive HD Maps market is poised for significant growth, driven by technological advancements, increasing demand for autonomous driving capabilities, and supportive government regulations. The market will continue to evolve with the development of more accurate, detailed, and dynamic map data, creating new opportunities for innovation and collaboration. The focus will be on enhanced data security and privacy, as well as the integration of HD maps with other emerging technologies, including V2X communication. The market will see increased competition, with the emergence of new players and consolidation amongst existing ones.
Automotive HD Maps Industry Segmentation
-
1. Component
- 1.1. Solutions
- 1.2. Services
-
2. Application
- 2.1. Autonomous Cars
- 2.2. Fleet Management
- 2.3. Advance Driver Assistance Systems (ADAS)
Automotive HD Maps Industry Segmentation By Geography
- 1. North America
- 2. Europe
- 3. Asia Pacific
- 4. Latin America
- 5. Middle East and Africa
Automotive HD Maps Industry REPORT HIGHLIGHTS
| Aspects | Details |
|---|---|
| Study Period | 2019-2033 |
| Base Year | 2024 |
| Estimated Year | 2025 |
| Forecast Period | 2025-2033 |
| Historical Period | 2019-2024 |
| Growth Rate | CAGR of 12.75% from 2019-2033 |
| Segmentation |
|
Table of Contents
- 1. Introduction
- 1.1. Research Scope
- 1.2. Market Segmentation
- 1.3. Research Methodology
- 1.4. Definitions and Assumptions
- 2. Executive Summary
- 2.1. Introduction
- 3. Market Dynamics
- 3.1. Introduction
- 3.2. Market Drivers
- 3.2.1. ; Growth in the Number of Connected Cars; Increase in the Use of 3D Platforms
- 3.3. Market Restrains
- 3.3.1. ; Stringent Regulations and Legal Challenges for Safeguarding Privacy and Security; Lack of In-house Expertise
- 3.4. Market Trends
- 3.4.1. Advance Driver Assistance Systems (ADAS) is expected to have significant Growth Rate
- 4. Market Factor Analysis
- 4.1. Porters Five Forces
- 4.2. Supply/Value Chain
- 4.3. PESTEL analysis
- 4.4. Market Entropy
- 4.5. Patent/Trademark Analysis
- 5. Global Automotive HD Maps Industry Analysis, Insights and Forecast, 2019-2031
- 5.1. Market Analysis, Insights and Forecast - by Component
- 5.1.1. Solutions
- 5.1.2. Services
- 5.2. Market Analysis, Insights and Forecast - by Application
- 5.2.1. Autonomous Cars
- 5.2.2. Fleet Management
- 5.2.3. Advance Driver Assistance Systems (ADAS)
- 5.3. Market Analysis, Insights and Forecast - by Region
- 5.3.1. North America
- 5.3.2. Europe
- 5.3.3. Asia Pacific
- 5.3.4. Latin America
- 5.3.5. Middle East and Africa
- 5.1. Market Analysis, Insights and Forecast - by Component
- 6. North America Automotive HD Maps Industry Analysis, Insights and Forecast, 2019-2031
- 6.1. Market Analysis, Insights and Forecast - by Component
- 6.1.1. Solutions
- 6.1.2. Services
- 6.2. Market Analysis, Insights and Forecast - by Application
- 6.2.1. Autonomous Cars
- 6.2.2. Fleet Management
- 6.2.3. Advance Driver Assistance Systems (ADAS)
- 6.1. Market Analysis, Insights and Forecast - by Component
- 7. Europe Automotive HD Maps Industry Analysis, Insights and Forecast, 2019-2031
- 7.1. Market Analysis, Insights and Forecast - by Component
- 7.1.1. Solutions
- 7.1.2. Services
- 7.2. Market Analysis, Insights and Forecast - by Application
- 7.2.1. Autonomous Cars
- 7.2.2. Fleet Management
- 7.2.3. Advance Driver Assistance Systems (ADAS)
- 7.1. Market Analysis, Insights and Forecast - by Component
- 8. Asia Pacific Automotive HD Maps Industry Analysis, Insights and Forecast, 2019-2031
- 8.1. Market Analysis, Insights and Forecast - by Component
- 8.1.1. Solutions
- 8.1.2. Services
- 8.2. Market Analysis, Insights and Forecast - by Application
- 8.2.1. Autonomous Cars
- 8.2.2. Fleet Management
- 8.2.3. Advance Driver Assistance Systems (ADAS)
- 8.1. Market Analysis, Insights and Forecast - by Component
- 9. Latin America Automotive HD Maps Industry Analysis, Insights and Forecast, 2019-2031
- 9.1. Market Analysis, Insights and Forecast - by Component
- 9.1.1. Solutions
- 9.1.2. Services
- 9.2. Market Analysis, Insights and Forecast - by Application
- 9.2.1. Autonomous Cars
- 9.2.2. Fleet Management
- 9.2.3. Advance Driver Assistance Systems (ADAS)
- 9.1. Market Analysis, Insights and Forecast - by Component
- 10. Middle East and Africa Automotive HD Maps Industry Analysis, Insights and Forecast, 2019-2031
- 10.1. Market Analysis, Insights and Forecast - by Component
- 10.1.1. Solutions
- 10.1.2. Services
- 10.2. Market Analysis, Insights and Forecast - by Application
- 10.2.1. Autonomous Cars
- 10.2.2. Fleet Management
- 10.2.3. Advance Driver Assistance Systems (ADAS)
- 10.1. Market Analysis, Insights and Forecast - by Component
- 11. North America Automotive HD Maps Industry Analysis, Insights and Forecast, 2019-2031
- 11.1. Market Analysis, Insights and Forecast - By Country/Sub-region
- 11.1.1 United States
- 11.1.2 Canada
- 11.1.3 Mexico
- 12. Europe Automotive HD Maps Industry Analysis, Insights and Forecast, 2019-2031
- 12.1. Market Analysis, Insights and Forecast - By Country/Sub-region
- 12.1.1 Germany
- 12.1.2 United Kingdom
- 12.1.3 France
- 12.1.4 Spain
- 12.1.5 Italy
- 12.1.6 Spain
- 12.1.7 Belgium
- 12.1.8 Netherland
- 12.1.9 Nordics
- 12.1.10 Rest of Europe
- 13. Asia Pacific Automotive HD Maps Industry Analysis, Insights and Forecast, 2019-2031
- 13.1. Market Analysis, Insights and Forecast - By Country/Sub-region
- 13.1.1 China
- 13.1.2 Japan
- 13.1.3 India
- 13.1.4 South Korea
- 13.1.5 Southeast Asia
- 13.1.6 Australia
- 13.1.7 Indonesia
- 13.1.8 Phillipes
- 13.1.9 Singapore
- 13.1.10 Thailandc
- 13.1.11 Rest of Asia Pacific
- 14. South America Automotive HD Maps Industry Analysis, Insights and Forecast, 2019-2031
- 14.1. Market Analysis, Insights and Forecast - By Country/Sub-region
- 14.1.1 Brazil
- 14.1.2 Argentina
- 14.1.3 Peru
- 14.1.4 Chile
- 14.1.5 Colombia
- 14.1.6 Ecuador
- 14.1.7 Venezuela
- 14.1.8 Rest of South America
- 15. North America Automotive HD Maps Industry Analysis, Insights and Forecast, 2019-2031
- 15.1. Market Analysis, Insights and Forecast - By Country/Sub-region
- 15.1.1 United States
- 15.1.2 Canada
- 15.1.3 Mexico
- 16. MEA Automotive HD Maps Industry Analysis, Insights and Forecast, 2019-2031
- 16.1. Market Analysis, Insights and Forecast - By Country/Sub-region
- 16.1.1 United Arab Emirates
- 16.1.2 Saudi Arabia
- 16.1.3 South Africa
- 16.1.4 Rest of Middle East and Africa
- 17. Competitive Analysis
- 17.1. Global Market Share Analysis 2024
- 17.2. Company Profiles
- 17.2.1 MiTAC Holdings Corporation
- 17.2.1.1. Overview
- 17.2.1.2. Products
- 17.2.1.3. SWOT Analysis
- 17.2.1.4. Recent Developments
- 17.2.1.5. Financials (Based on Availability)
- 17.2.2 Nearmap Lt
- 17.2.2.1. Overview
- 17.2.2.2. Products
- 17.2.2.3. SWOT Analysis
- 17.2.2.4. Recent Developments
- 17.2.2.5. Financials (Based on Availability)
- 17.2.3 Google LLC
- 17.2.3.1. Overview
- 17.2.3.2. Products
- 17.2.3.3. SWOT Analysis
- 17.2.3.4. Recent Developments
- 17.2.3.5. Financials (Based on Availability)
- 17.2.4 Micello Inc
- 17.2.4.1. Overview
- 17.2.4.2. Products
- 17.2.4.3. SWOT Analysis
- 17.2.4.4. Recent Developments
- 17.2.4.5. Financials (Based on Availability)
- 17.2.5 ARC Aerial Imaging Inc
- 17.2.5.1. Overview
- 17.2.5.2. Products
- 17.2.5.3. SWOT Analysis
- 17.2.5.4. Recent Developments
- 17.2.5.5. Financials (Based on Availability)
- 17.2.6 Mapquest Inc
- 17.2.6.1. Overview
- 17.2.6.2. Products
- 17.2.6.3. SWOT Analysis
- 17.2.6.4. Recent Developments
- 17.2.6.5. Financials (Based on Availability)
- 17.2.7 ESRI Inc
- 17.2.7.1. Overview
- 17.2.7.2. Products
- 17.2.7.3. SWOT Analysis
- 17.2.7.4. Recent Developments
- 17.2.7.5. Financials (Based on Availability)
- 17.2.8 TomTom NV
- 17.2.8.1. Overview
- 17.2.8.2. Products
- 17.2.8.3. SWOT Analysis
- 17.2.8.4. Recent Developments
- 17.2.8.5. Financials (Based on Availability)
- 17.2.9 Apple Inc
- 17.2.9.1. Overview
- 17.2.9.2. Products
- 17.2.9.3. SWOT Analysis
- 17.2.9.4. Recent Developments
- 17.2.9.5. Financials (Based on Availability)
- 17.2.10 HERE Technologies
- 17.2.10.1. Overview
- 17.2.10.2. Products
- 17.2.10.3. SWOT Analysis
- 17.2.10.4. Recent Developments
- 17.2.10.5. Financials (Based on Availability)
- 17.2.1 MiTAC Holdings Corporation
List of Figures
- Figure 1: Global Automotive HD Maps Industry Revenue Breakdown (Million, %) by Region 2024 & 2032
- Figure 2: Global Automotive HD Maps Industry Volume Breakdown (K Unit, %) by Region 2024 & 2032
- Figure 3: North America Automotive HD Maps Industry Revenue (Million), by Country 2024 & 2032
- Figure 4: North America Automotive HD Maps Industry Volume (K Unit), by Country 2024 & 2032
- Figure 5: North America Automotive HD Maps Industry Revenue Share (%), by Country 2024 & 2032
- Figure 6: North America Automotive HD Maps Industry Volume Share (%), by Country 2024 & 2032
- Figure 7: Europe Automotive HD Maps Industry Revenue (Million), by Country 2024 & 2032
- Figure 8: Europe Automotive HD Maps Industry Volume (K Unit), by Country 2024 & 2032
- Figure 9: Europe Automotive HD Maps Industry Revenue Share (%), by Country 2024 & 2032
- Figure 10: Europe Automotive HD Maps Industry Volume Share (%), by Country 2024 & 2032
- Figure 11: Asia Pacific Automotive HD Maps Industry Revenue (Million), by Country 2024 & 2032
- Figure 12: Asia Pacific Automotive HD Maps Industry Volume (K Unit), by Country 2024 & 2032
- Figure 13: Asia Pacific Automotive HD Maps Industry Revenue Share (%), by Country 2024 & 2032
- Figure 14: Asia Pacific Automotive HD Maps Industry Volume Share (%), by Country 2024 & 2032
- Figure 15: South America Automotive HD Maps Industry Revenue (Million), by Country 2024 & 2032
- Figure 16: South America Automotive HD Maps Industry Volume (K Unit), by Country 2024 & 2032
- Figure 17: South America Automotive HD Maps Industry Revenue Share (%), by Country 2024 & 2032
- Figure 18: South America Automotive HD Maps Industry Volume Share (%), by Country 2024 & 2032
- Figure 19: North America Automotive HD Maps Industry Revenue (Million), by Country 2024 & 2032
- Figure 20: North America Automotive HD Maps Industry Volume (K Unit), by Country 2024 & 2032
- Figure 21: North America Automotive HD Maps Industry Revenue Share (%), by Country 2024 & 2032
- Figure 22: North America Automotive HD Maps Industry Volume Share (%), by Country 2024 & 2032
- Figure 23: MEA Automotive HD Maps Industry Revenue (Million), by Country 2024 & 2032
- Figure 24: MEA Automotive HD Maps Industry Volume (K Unit), by Country 2024 & 2032
- Figure 25: MEA Automotive HD Maps Industry Revenue Share (%), by Country 2024 & 2032
- Figure 26: MEA Automotive HD Maps Industry Volume Share (%), by Country 2024 & 2032
- Figure 27: North America Automotive HD Maps Industry Revenue (Million), by Component 2024 & 2032
- Figure 28: North America Automotive HD Maps Industry Volume (K Unit), by Component 2024 & 2032
- Figure 29: North America Automotive HD Maps Industry Revenue Share (%), by Component 2024 & 2032
- Figure 30: North America Automotive HD Maps Industry Volume Share (%), by Component 2024 & 2032
- Figure 31: North America Automotive HD Maps Industry Revenue (Million), by Application 2024 & 2032
- Figure 32: North America Automotive HD Maps Industry Volume (K Unit), by Application 2024 & 2032
- Figure 33: North America Automotive HD Maps Industry Revenue Share (%), by Application 2024 & 2032
- Figure 34: North America Automotive HD Maps Industry Volume Share (%), by Application 2024 & 2032
- Figure 35: North America Automotive HD Maps Industry Revenue (Million), by Country 2024 & 2032
- Figure 36: North America Automotive HD Maps Industry Volume (K Unit), by Country 2024 & 2032
- Figure 37: North America Automotive HD Maps Industry Revenue Share (%), by Country 2024 & 2032
- Figure 38: North America Automotive HD Maps Industry Volume Share (%), by Country 2024 & 2032
- Figure 39: Europe Automotive HD Maps Industry Revenue (Million), by Component 2024 & 2032
- Figure 40: Europe Automotive HD Maps Industry Volume (K Unit), by Component 2024 & 2032
- Figure 41: Europe Automotive HD Maps Industry Revenue Share (%), by Component 2024 & 2032
- Figure 42: Europe Automotive HD Maps Industry Volume Share (%), by Component 2024 & 2032
- Figure 43: Europe Automotive HD Maps Industry Revenue (Million), by Application 2024 & 2032
- Figure 44: Europe Automotive HD Maps Industry Volume (K Unit), by Application 2024 & 2032
- Figure 45: Europe Automotive HD Maps Industry Revenue Share (%), by Application 2024 & 2032
- Figure 46: Europe Automotive HD Maps Industry Volume Share (%), by Application 2024 & 2032
- Figure 47: Europe Automotive HD Maps Industry Revenue (Million), by Country 2024 & 2032
- Figure 48: Europe Automotive HD Maps Industry Volume (K Unit), by Country 2024 & 2032
- Figure 49: Europe Automotive HD Maps Industry Revenue Share (%), by Country 2024 & 2032
- Figure 50: Europe Automotive HD Maps Industry Volume Share (%), by Country 2024 & 2032
- Figure 51: Asia Pacific Automotive HD Maps Industry Revenue (Million), by Component 2024 & 2032
- Figure 52: Asia Pacific Automotive HD Maps Industry Volume (K Unit), by Component 2024 & 2032
- Figure 53: Asia Pacific Automotive HD Maps Industry Revenue Share (%), by Component 2024 & 2032
- Figure 54: Asia Pacific Automotive HD Maps Industry Volume Share (%), by Component 2024 & 2032
- Figure 55: Asia Pacific Automotive HD Maps Industry Revenue (Million), by Application 2024 & 2032
- Figure 56: Asia Pacific Automotive HD Maps Industry Volume (K Unit), by Application 2024 & 2032
- Figure 57: Asia Pacific Automotive HD Maps Industry Revenue Share (%), by Application 2024 & 2032
- Figure 58: Asia Pacific Automotive HD Maps Industry Volume Share (%), by Application 2024 & 2032
- Figure 59: Asia Pacific Automotive HD Maps Industry Revenue (Million), by Country 2024 & 2032
- Figure 60: Asia Pacific Automotive HD Maps Industry Volume (K Unit), by Country 2024 & 2032
- Figure 61: Asia Pacific Automotive HD Maps Industry Revenue Share (%), by Country 2024 & 2032
- Figure 62: Asia Pacific Automotive HD Maps Industry Volume Share (%), by Country 2024 & 2032
- Figure 63: Latin America Automotive HD Maps Industry Revenue (Million), by Component 2024 & 2032
- Figure 64: Latin America Automotive HD Maps Industry Volume (K Unit), by Component 2024 & 2032
- Figure 65: Latin America Automotive HD Maps Industry Revenue Share (%), by Component 2024 & 2032
- Figure 66: Latin America Automotive HD Maps Industry Volume Share (%), by Component 2024 & 2032
- Figure 67: Latin America Automotive HD Maps Industry Revenue (Million), by Application 2024 & 2032
- Figure 68: Latin America Automotive HD Maps Industry Volume (K Unit), by Application 2024 & 2032
- Figure 69: Latin America Automotive HD Maps Industry Revenue Share (%), by Application 2024 & 2032
- Figure 70: Latin America Automotive HD Maps Industry Volume Share (%), by Application 2024 & 2032
- Figure 71: Latin America Automotive HD Maps Industry Revenue (Million), by Country 2024 & 2032
- Figure 72: Latin America Automotive HD Maps Industry Volume (K Unit), by Country 2024 & 2032
- Figure 73: Latin America Automotive HD Maps Industry Revenue Share (%), by Country 2024 & 2032
- Figure 74: Latin America Automotive HD Maps Industry Volume Share (%), by Country 2024 & 2032
- Figure 75: Middle East and Africa Automotive HD Maps Industry Revenue (Million), by Component 2024 & 2032
- Figure 76: Middle East and Africa Automotive HD Maps Industry Volume (K Unit), by Component 2024 & 2032
- Figure 77: Middle East and Africa Automotive HD Maps Industry Revenue Share (%), by Component 2024 & 2032
- Figure 78: Middle East and Africa Automotive HD Maps Industry Volume Share (%), by Component 2024 & 2032
- Figure 79: Middle East and Africa Automotive HD Maps Industry Revenue (Million), by Application 2024 & 2032
- Figure 80: Middle East and Africa Automotive HD Maps Industry Volume (K Unit), by Application 2024 & 2032
- Figure 81: Middle East and Africa Automotive HD Maps Industry Revenue Share (%), by Application 2024 & 2032
- Figure 82: Middle East and Africa Automotive HD Maps Industry Volume Share (%), by Application 2024 & 2032
- Figure 83: Middle East and Africa Automotive HD Maps Industry Revenue (Million), by Country 2024 & 2032
- Figure 84: Middle East and Africa Automotive HD Maps Industry Volume (K Unit), by Country 2024 & 2032
- Figure 85: Middle East and Africa Automotive HD Maps Industry Revenue Share (%), by Country 2024 & 2032
- Figure 86: Middle East and Africa Automotive HD Maps Industry Volume Share (%), by Country 2024 & 2032
List of Tables
- Table 1: Global Automotive HD Maps Industry Revenue Million Forecast, by Region 2019 & 2032
- Table 2: Global Automotive HD Maps Industry Volume K Unit Forecast, by Region 2019 & 2032
- Table 3: Global Automotive HD Maps Industry Revenue Million Forecast, by Component 2019 & 2032
- Table 4: Global Automotive HD Maps Industry Volume K Unit Forecast, by Component 2019 & 2032
- Table 5: Global Automotive HD Maps Industry Revenue Million Forecast, by Application 2019 & 2032
- Table 6: Global Automotive HD Maps Industry Volume K Unit Forecast, by Application 2019 & 2032
- Table 7: Global Automotive HD Maps Industry Revenue Million Forecast, by Region 2019 & 2032
- Table 8: Global Automotive HD Maps Industry Volume K Unit Forecast, by Region 2019 & 2032
- Table 9: Global Automotive HD Maps Industry Revenue Million Forecast, by Country 2019 & 2032
- Table 10: Global Automotive HD Maps Industry Volume K Unit Forecast, by Country 2019 & 2032
- Table 11: United States Automotive HD Maps Industry Revenue (Million) Forecast, by Application 2019 & 2032
- Table 12: United States Automotive HD Maps Industry Volume (K Unit) Forecast, by Application 2019 & 2032
- Table 13: Canada Automotive HD Maps Industry Revenue (Million) Forecast, by Application 2019 & 2032
- Table 14: Canada Automotive HD Maps Industry Volume (K Unit) Forecast, by Application 2019 & 2032
- Table 15: Mexico Automotive HD Maps Industry Revenue (Million) Forecast, by Application 2019 & 2032
- Table 16: Mexico Automotive HD Maps Industry Volume (K Unit) Forecast, by Application 2019 & 2032
- Table 17: Global Automotive HD Maps Industry Revenue Million Forecast, by Country 2019 & 2032
- Table 18: Global Automotive HD Maps Industry Volume K Unit Forecast, by Country 2019 & 2032
- Table 19: Germany Automotive HD Maps Industry Revenue (Million) Forecast, by Application 2019 & 2032
- Table 20: Germany Automotive HD Maps Industry Volume (K Unit) Forecast, by Application 2019 & 2032
- Table 21: United Kingdom Automotive HD Maps Industry Revenue (Million) Forecast, by Application 2019 & 2032
- Table 22: United Kingdom Automotive HD Maps Industry Volume (K Unit) Forecast, by Application 2019 & 2032
- Table 23: France Automotive HD Maps Industry Revenue (Million) Forecast, by Application 2019 & 2032
- Table 24: France Automotive HD Maps Industry Volume (K Unit) Forecast, by Application 2019 & 2032
- Table 25: Spain Automotive HD Maps Industry Revenue (Million) Forecast, by Application 2019 & 2032
- Table 26: Spain Automotive HD Maps Industry Volume (K Unit) Forecast, by Application 2019 & 2032
- Table 27: Italy Automotive HD Maps Industry Revenue (Million) Forecast, by Application 2019 & 2032
- Table 28: Italy Automotive HD Maps Industry Volume (K Unit) Forecast, by Application 2019 & 2032
- Table 29: Spain Automotive HD Maps Industry Revenue (Million) Forecast, by Application 2019 & 2032
- Table 30: Spain Automotive HD Maps Industry Volume (K Unit) Forecast, by Application 2019 & 2032
- Table 31: Belgium Automotive HD Maps Industry Revenue (Million) Forecast, by Application 2019 & 2032
- Table 32: Belgium Automotive HD Maps Industry Volume (K Unit) Forecast, by Application 2019 & 2032
- Table 33: Netherland Automotive HD Maps Industry Revenue (Million) Forecast, by Application 2019 & 2032
- Table 34: Netherland Automotive HD Maps Industry Volume (K Unit) Forecast, by Application 2019 & 2032
- Table 35: Nordics Automotive HD Maps Industry Revenue (Million) Forecast, by Application 2019 & 2032
- Table 36: Nordics Automotive HD Maps Industry Volume (K Unit) Forecast, by Application 2019 & 2032
- Table 37: Rest of Europe Automotive HD Maps Industry Revenue (Million) Forecast, by Application 2019 & 2032
- Table 38: Rest of Europe Automotive HD Maps Industry Volume (K Unit) Forecast, by Application 2019 & 2032
- Table 39: Global Automotive HD Maps Industry Revenue Million Forecast, by Country 2019 & 2032
- Table 40: Global Automotive HD Maps Industry Volume K Unit Forecast, by Country 2019 & 2032
- Table 41: China Automotive HD Maps Industry Revenue (Million) Forecast, by Application 2019 & 2032
- Table 42: China Automotive HD Maps Industry Volume (K Unit) Forecast, by Application 2019 & 2032
- Table 43: Japan Automotive HD Maps Industry Revenue (Million) Forecast, by Application 2019 & 2032
- Table 44: Japan Automotive HD Maps Industry Volume (K Unit) Forecast, by Application 2019 & 2032
- Table 45: India Automotive HD Maps Industry Revenue (Million) Forecast, by Application 2019 & 2032
- Table 46: India Automotive HD Maps Industry Volume (K Unit) Forecast, by Application 2019 & 2032
- Table 47: South Korea Automotive HD Maps Industry Revenue (Million) Forecast, by Application 2019 & 2032
- Table 48: South Korea Automotive HD Maps Industry Volume (K Unit) Forecast, by Application 2019 & 2032
- Table 49: Southeast Asia Automotive HD Maps Industry Revenue (Million) Forecast, by Application 2019 & 2032
- Table 50: Southeast Asia Automotive HD Maps Industry Volume (K Unit) Forecast, by Application 2019 & 2032
- Table 51: Australia Automotive HD Maps Industry Revenue (Million) Forecast, by Application 2019 & 2032
- Table 52: Australia Automotive HD Maps Industry Volume (K Unit) Forecast, by Application 2019 & 2032
- Table 53: Indonesia Automotive HD Maps Industry Revenue (Million) Forecast, by Application 2019 & 2032
- Table 54: Indonesia Automotive HD Maps Industry Volume (K Unit) Forecast, by Application 2019 & 2032
- Table 55: Phillipes Automotive HD Maps Industry Revenue (Million) Forecast, by Application 2019 & 2032
- Table 56: Phillipes Automotive HD Maps Industry Volume (K Unit) Forecast, by Application 2019 & 2032
- Table 57: Singapore Automotive HD Maps Industry Revenue (Million) Forecast, by Application 2019 & 2032
- Table 58: Singapore Automotive HD Maps Industry Volume (K Unit) Forecast, by Application 2019 & 2032
- Table 59: Thailandc Automotive HD Maps Industry Revenue (Million) Forecast, by Application 2019 & 2032
- Table 60: Thailandc Automotive HD Maps Industry Volume (K Unit) Forecast, by Application 2019 & 2032
- Table 61: Rest of Asia Pacific Automotive HD Maps Industry Revenue (Million) Forecast, by Application 2019 & 2032
- Table 62: Rest of Asia Pacific Automotive HD Maps Industry Volume (K Unit) Forecast, by Application 2019 & 2032
- Table 63: Global Automotive HD Maps Industry Revenue Million Forecast, by Country 2019 & 2032
- Table 64: Global Automotive HD Maps Industry Volume K Unit Forecast, by Country 2019 & 2032
- Table 65: Brazil Automotive HD Maps Industry Revenue (Million) Forecast, by Application 2019 & 2032
- Table 66: Brazil Automotive HD Maps Industry Volume (K Unit) Forecast, by Application 2019 & 2032
- Table 67: Argentina Automotive HD Maps Industry Revenue (Million) Forecast, by Application 2019 & 2032
- Table 68: Argentina Automotive HD Maps Industry Volume (K Unit) Forecast, by Application 2019 & 2032
- Table 69: Peru Automotive HD Maps Industry Revenue (Million) Forecast, by Application 2019 & 2032
- Table 70: Peru Automotive HD Maps Industry Volume (K Unit) Forecast, by Application 2019 & 2032
- Table 71: Chile Automotive HD Maps Industry Revenue (Million) Forecast, by Application 2019 & 2032
- Table 72: Chile Automotive HD Maps Industry Volume (K Unit) Forecast, by Application 2019 & 2032
- Table 73: Colombia Automotive HD Maps Industry Revenue (Million) Forecast, by Application 2019 & 2032
- Table 74: Colombia Automotive HD Maps Industry Volume (K Unit) Forecast, by Application 2019 & 2032
- Table 75: Ecuador Automotive HD Maps Industry Revenue (Million) Forecast, by Application 2019 & 2032
- Table 76: Ecuador Automotive HD Maps Industry Volume (K Unit) Forecast, by Application 2019 & 2032
- Table 77: Venezuela Automotive HD Maps Industry Revenue (Million) Forecast, by Application 2019 & 2032
- Table 78: Venezuela Automotive HD Maps Industry Volume (K Unit) Forecast, by Application 2019 & 2032
- Table 79: Rest of South America Automotive HD Maps Industry Revenue (Million) Forecast, by Application 2019 & 2032
- Table 80: Rest of South America Automotive HD Maps Industry Volume (K Unit) Forecast, by Application 2019 & 2032
- Table 81: Global Automotive HD Maps Industry Revenue Million Forecast, by Country 2019 & 2032
- Table 82: Global Automotive HD Maps Industry Volume K Unit Forecast, by Country 2019 & 2032
- Table 83: United States Automotive HD Maps Industry Revenue (Million) Forecast, by Application 2019 & 2032
- Table 84: United States Automotive HD Maps Industry Volume (K Unit) Forecast, by Application 2019 & 2032
- Table 85: Canada Automotive HD Maps Industry Revenue (Million) Forecast, by Application 2019 & 2032
- Table 86: Canada Automotive HD Maps Industry Volume (K Unit) Forecast, by Application 2019 & 2032
- Table 87: Mexico Automotive HD Maps Industry Revenue (Million) Forecast, by Application 2019 & 2032
- Table 88: Mexico Automotive HD Maps Industry Volume (K Unit) Forecast, by Application 2019 & 2032
- Table 89: Global Automotive HD Maps Industry Revenue Million Forecast, by Country 2019 & 2032
- Table 90: Global Automotive HD Maps Industry Volume K Unit Forecast, by Country 2019 & 2032
- Table 91: United Arab Emirates Automotive HD Maps Industry Revenue (Million) Forecast, by Application 2019 & 2032
- Table 92: United Arab Emirates Automotive HD Maps Industry Volume (K Unit) Forecast, by Application 2019 & 2032
- Table 93: Saudi Arabia Automotive HD Maps Industry Revenue (Million) Forecast, by Application 2019 & 2032
- Table 94: Saudi Arabia Automotive HD Maps Industry Volume (K Unit) Forecast, by Application 2019 & 2032
- Table 95: South Africa Automotive HD Maps Industry Revenue (Million) Forecast, by Application 2019 & 2032
- Table 96: South Africa Automotive HD Maps Industry Volume (K Unit) Forecast, by Application 2019 & 2032
- Table 97: Rest of Middle East and Africa Automotive HD Maps Industry Revenue (Million) Forecast, by Application 2019 & 2032
- Table 98: Rest of Middle East and Africa Automotive HD Maps Industry Volume (K Unit) Forecast, by Application 2019 & 2032
- Table 99: Global Automotive HD Maps Industry Revenue Million Forecast, by Component 2019 & 2032
- Table 100: Global Automotive HD Maps Industry Volume K Unit Forecast, by Component 2019 & 2032
- Table 101: Global Automotive HD Maps Industry Revenue Million Forecast, by Application 2019 & 2032
- Table 102: Global Automotive HD Maps Industry Volume K Unit Forecast, by Application 2019 & 2032
- Table 103: Global Automotive HD Maps Industry Revenue Million Forecast, by Country 2019 & 2032
- Table 104: Global Automotive HD Maps Industry Volume K Unit Forecast, by Country 2019 & 2032
- Table 105: Global Automotive HD Maps Industry Revenue Million Forecast, by Component 2019 & 2032
- Table 106: Global Automotive HD Maps Industry Volume K Unit Forecast, by Component 2019 & 2032
- Table 107: Global Automotive HD Maps Industry Revenue Million Forecast, by Application 2019 & 2032
- Table 108: Global Automotive HD Maps Industry Volume K Unit Forecast, by Application 2019 & 2032
- Table 109: Global Automotive HD Maps Industry Revenue Million Forecast, by Country 2019 & 2032
- Table 110: Global Automotive HD Maps Industry Volume K Unit Forecast, by Country 2019 & 2032
- Table 111: Global Automotive HD Maps Industry Revenue Million Forecast, by Component 2019 & 2032
- Table 112: Global Automotive HD Maps Industry Volume K Unit Forecast, by Component 2019 & 2032
- Table 113: Global Automotive HD Maps Industry Revenue Million Forecast, by Application 2019 & 2032
- Table 114: Global Automotive HD Maps Industry Volume K Unit Forecast, by Application 2019 & 2032
- Table 115: Global Automotive HD Maps Industry Revenue Million Forecast, by Country 2019 & 2032
- Table 116: Global Automotive HD Maps Industry Volume K Unit Forecast, by Country 2019 & 2032
- Table 117: Global Automotive HD Maps Industry Revenue Million Forecast, by Component 2019 & 2032
- Table 118: Global Automotive HD Maps Industry Volume K Unit Forecast, by Component 2019 & 2032
- Table 119: Global Automotive HD Maps Industry Revenue Million Forecast, by Application 2019 & 2032
- Table 120: Global Automotive HD Maps Industry Volume K Unit Forecast, by Application 2019 & 2032
- Table 121: Global Automotive HD Maps Industry Revenue Million Forecast, by Country 2019 & 2032
- Table 122: Global Automotive HD Maps Industry Volume K Unit Forecast, by Country 2019 & 2032
- Table 123: Global Automotive HD Maps Industry Revenue Million Forecast, by Component 2019 & 2032
- Table 124: Global Automotive HD Maps Industry Volume K Unit Forecast, by Component 2019 & 2032
- Table 125: Global Automotive HD Maps Industry Revenue Million Forecast, by Application 2019 & 2032
- Table 126: Global Automotive HD Maps Industry Volume K Unit Forecast, by Application 2019 & 2032
- Table 127: Global Automotive HD Maps Industry Revenue Million Forecast, by Country 2019 & 2032
- Table 128: Global Automotive HD Maps Industry Volume K Unit Forecast, by Country 2019 & 2032
Frequently Asked Questions
1. What is the projected Compound Annual Growth Rate (CAGR) of the Automotive HD Maps Industry?
The projected CAGR is approximately 12.75%.
2. Which companies are prominent players in the Automotive HD Maps Industry?
Key companies in the market include MiTAC Holdings Corporation, Nearmap Lt, Google LLC, Micello Inc, ARC Aerial Imaging Inc, Mapquest Inc, ESRI Inc, TomTom NV, Apple Inc, HERE Technologies.
3. What are the main segments of the Automotive HD Maps Industry?
The market segments include Component, Application.
4. Can you provide details about the market size?
The market size is estimated to be USD XX Million as of 2022.
5. What are some drivers contributing to market growth?
; Growth in the Number of Connected Cars; Increase in the Use of 3D Platforms.
6. What are the notable trends driving market growth?
Advance Driver Assistance Systems (ADAS) is expected to have significant Growth Rate.
7. Are there any restraints impacting market growth?
; Stringent Regulations and Legal Challenges for Safeguarding Privacy and Security; Lack of In-house Expertise.
8. Can you provide examples of recent developments in the market?
N/A
9. What pricing options are available for accessing the report?
Pricing options include single-user, multi-user, and enterprise licenses priced at USD 4750, USD 5250, and USD 8750 respectively.
10. Is the market size provided in terms of value or volume?
The market size is provided in terms of value, measured in Million and volume, measured in K Unit.
11. Are there any specific market keywords associated with the report?
Yes, the market keyword associated with the report is "Automotive HD Maps Industry," which aids in identifying and referencing the specific market segment covered.
12. How do I determine which pricing option suits my needs best?
The pricing options vary based on user requirements and access needs. Individual users may opt for single-user licenses, while businesses requiring broader access may choose multi-user or enterprise licenses for cost-effective access to the report.
13. Are there any additional resources or data provided in the Automotive HD Maps Industry report?
While the report offers comprehensive insights, it's advisable to review the specific contents or supplementary materials provided to ascertain if additional resources or data are available.
14. How can I stay updated on further developments or reports in the Automotive HD Maps Industry?
To stay informed about further developments, trends, and reports in the Automotive HD Maps Industry, consider subscribing to industry newsletters, following relevant companies and organizations, or regularly checking reputable industry news sources and publications.
Methodology
Step 1 - Identification of Relevant Samples Size from Population Database


Step 2 - Approaches for Defining Global Market Size (Value, Volume* & Price*)

Note*: In applicable scenarios
Step 3 - Data Sources
Primary Research
- Web Analytics
- Survey Reports
- Research Institute
- Latest Research Reports
- Opinion Leaders
Secondary Research
- Annual Reports
- White Paper
- Latest Press Release
- Industry Association
- Paid Database
- Investor Presentations

Step 4 - Data Triangulation
Involves using different sources of information in order to increase the validity of a study
These sources are likely to be stakeholders in a program - participants, other researchers, program staff, other community members, and so on.
Then we put all data in single framework & apply various statistical tools to find out the dynamic on the market.
During the analysis stage, feedback from the stakeholder groups would be compared to determine areas of agreement as well as areas of divergence


