Armored Vehicle Navigation Systems Industry Navigating Dynamics Comprehensive Analysis and Forecasts 2025-2033

Armored Vehicle Navigation Systems Industry by Production Analysis, by Consumption Analysis, by Import Market Analysis (Value & Volume), by Export Market Analysis (Value & Volume), by Price Trend Analysis, by North America (United States, Canada, Mexico), by South America (Brazil, Argentina, Rest of South America), by Europe (United Kingdom, Germany, France, Italy, Spain, Russia, Benelux, Nordics, Rest of Europe), by Middle East & Africa (Turkey, Israel, GCC, North Africa, South Africa, Rest of Middle East & Africa), by Asia Pacific (China, India, Japan, South Korea, ASEAN, Oceania, Rest of Asia Pacific) Forecast 2025-2033

Jun 30 2025
Base Year: 2024

234 Pages
Main Logo

Armored Vehicle Navigation Systems Industry Navigating Dynamics Comprehensive Analysis and Forecasts 2025-2033


Home
Industries
Aerospace & Defense
sponsor image
sponsor image
sponsor image
sponsor image

Tailored for you

  • In-depth Analysis Tailored to Specified Regions or Segments
  • Company Profiles Customized to User Preferences
  • Comprehensive Insights Focused on Specific Segments or Regions
  • Customized Evaluation of Competitive Landscape to Meet Your Needs
  • Tailored Customization to Address Other Specific Requirements
Ask for customization


Key Insights

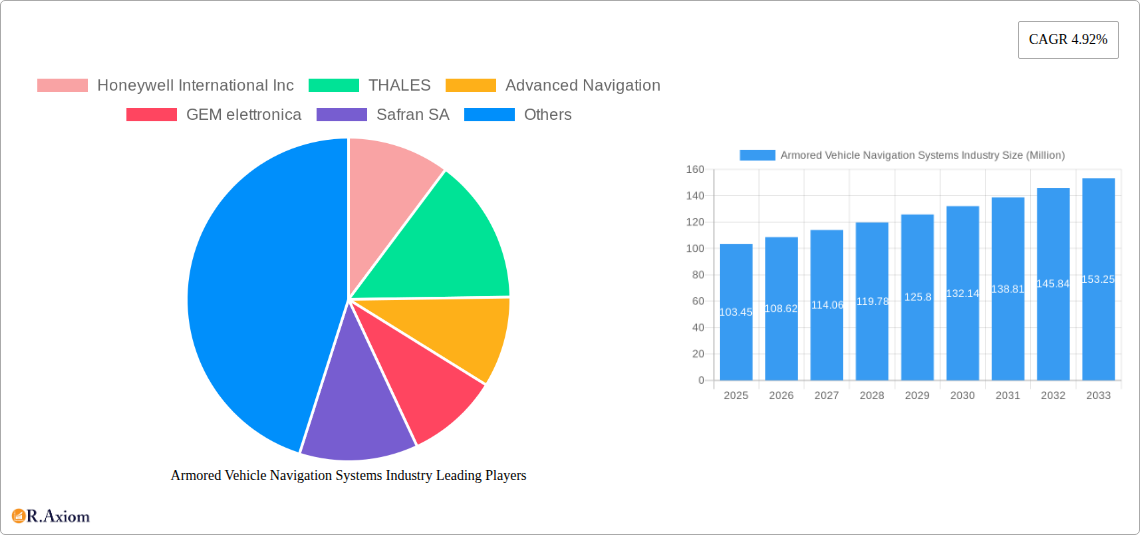
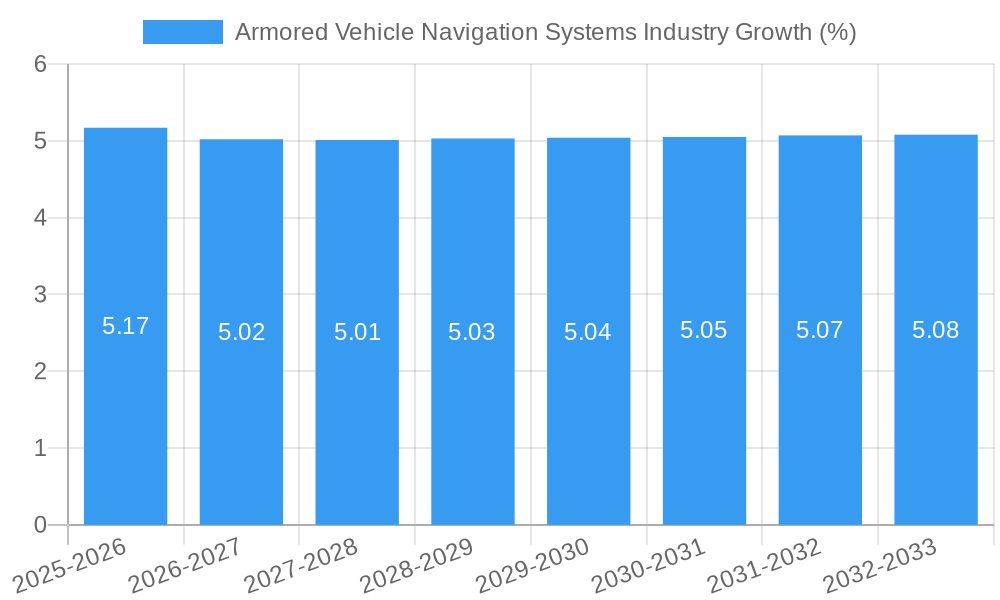
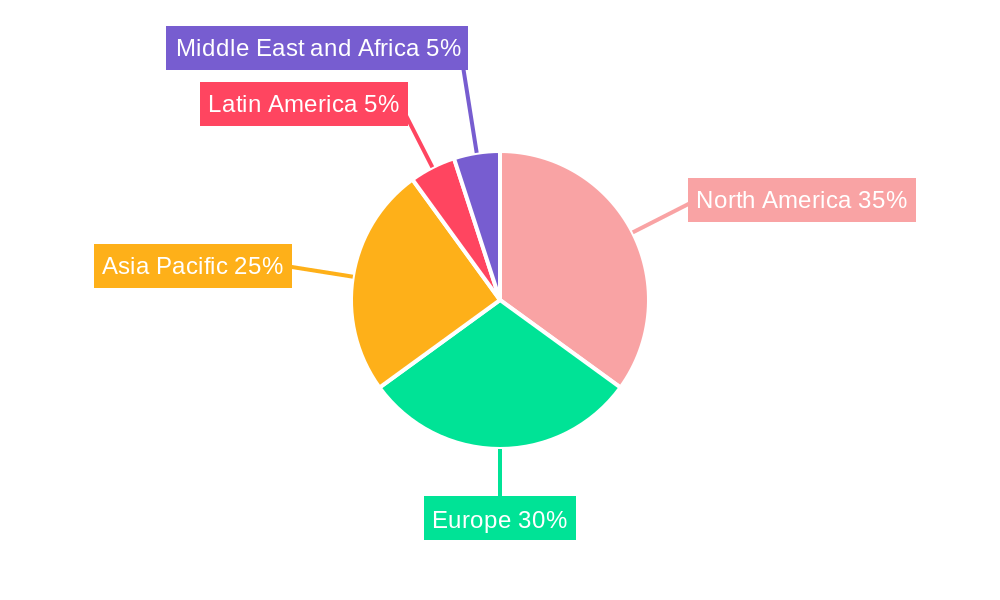
The global Armored Vehicle Navigation Systems market, valued at $103.45 million in 2025, is projected to experience robust growth, driven by increasing demand for enhanced situational awareness and precision navigation in military operations. A Compound Annual Growth Rate (CAGR) of 4.92% from 2025 to 2033 indicates a significant expansion of this market, fueled by technological advancements in inertial and satellite navigation systems, integration with advanced communication networks, and the growing adoption of autonomous and semi-autonomous armored vehicles. Key market segments include inertial navigation systems and satellite navigation systems, utilized across various armored vehicle types such as main battle tanks, infantry fighting vehicles, and armored personnel carriers. The market's growth is further bolstered by rising geopolitical instability and the consequent increase in defense spending globally. However, challenges such as high initial investment costs and the need for regular system maintenance could potentially restrain market expansion to some degree. Geographic regions like North America and Europe are expected to maintain a strong market share due to advanced technological capabilities and substantial defense budgets. The Asia-Pacific region, however, is poised for significant growth driven by increasing military modernization efforts in countries like India and China.

Leading companies such as Honeywell International Inc., Thales, and BAE Systems plc are actively engaged in developing and supplying sophisticated navigation systems to cater to the growing demand for improved accuracy and reliability in armored vehicle operations. These companies' continuous innovation and strategic partnerships are crucial factors in shaping the future landscape of the Armored Vehicle Navigation Systems market. Furthermore, the integration of advanced features such as GPS jamming countermeasures and improved cyber security measures are expected to drive market expansion in the coming years. Competition among major players is expected to intensify, prompting further technological advancements and price optimizations within the market.

Armored Vehicle Navigation Systems Industry Research Report - Market Size, Growth & Forecast

Armored Vehicle Navigation Systems Industry: A Comprehensive Market Report (2019-2033)

This detailed report provides a comprehensive analysis of the Armored Vehicle Navigation Systems market, offering invaluable insights for industry stakeholders, investors, and strategic decision-makers. The study period spans from 2019 to 2033, with 2025 serving as the base and estimated year. The report meticulously analyzes market trends, competitive landscapes, technological advancements, and future growth projections, covering a market valued at xx Million in 2025.

Armored Vehicle Navigation Systems Industry Market Concentration & Innovation

The Armored Vehicle Navigation Systems market exhibits a moderately concentrated structure, with key players like Honeywell International Inc, Thales, and BAE Systems plc holding significant market share. In 2025, the top 5 players collectively accounted for approximately 60% of the market. Innovation is driven by the demand for enhanced precision, reliability, and integration with other vehicle systems. Regulatory frameworks, particularly those concerning data security and cybersecurity, play a crucial role in shaping market dynamics. Product substitutes are limited, with the primary competition coming from alternative navigation technologies within the armored vehicle sector. End-user trends favor systems with improved situational awareness capabilities and ease of integration.

M&A activities in the sector have been moderate, with a total deal value of approximately $xx Million recorded between 2019 and 2024. Notable mergers and acquisitions include:

  • Acquisition of [Company A] by [Company B] in [Year] for $xx Million.
  • Strategic partnership between [Company C] and [Company D] in [Year] focusing on [Technology/Region].

Armored Vehicle Navigation Systems Industry Industry Trends & Insights

The global Armored Vehicle Navigation Systems market is experiencing robust growth, with a projected Compound Annual Growth Rate (CAGR) of xx% during the forecast period (2025-2033). This growth is primarily fueled by increasing defense budgets globally, modernization of existing armored vehicle fleets, and the rising demand for advanced navigation solutions in diverse geographical terrains. Technological disruptions, particularly in the areas of AI-powered navigation, improved satellite constellations, and enhanced inertial measurement units (IMUs), are significantly impacting market dynamics. Consumer preferences are shifting towards systems offering increased accuracy, resilience to jamming and spoofing, and seamless integration with other onboard systems. Competitive dynamics are characterized by intense innovation, strategic partnerships, and a focus on delivering tailored solutions to meet specific military and security needs. Market penetration of advanced navigation systems in armored vehicles is expected to reach xx% by 2033.

Armored Vehicle Navigation Systems Industry Growth

Dominant Markets & Segments in Armored Vehicle Navigation Systems Industry

The North American region currently dominates the Armored Vehicle Navigation Systems market, driven by high defense spending and technological advancements. However, the Asia-Pacific region is expected to witness significant growth in the coming years due to rising military modernization efforts and geopolitical factors.

Key Drivers:

  • North America: High defense budgets, technological leadership, and strong demand from government agencies.
  • Asia-Pacific: Increased military spending, modernization of armed forces, and geopolitical instability.
  • Europe: Significant defense expenditure, emphasis on technological upgrades, and participation in international military alliances.

Segment Dominance:

  • Navigation System: Satellite navigation systems currently hold a larger market share than inertial navigation systems due to their wider coverage and accuracy, but the demand for robust, less vulnerable inertial systems is also increasing.
  • Armored Vehicle Type: Main Battle Tanks (MBTs) represent the largest segment due to their critical role in military operations and the need for precise navigation capabilities. Infantry Fighting Vehicles (IFVs) and Armored Personnel Carriers (APCs) also constitute substantial market segments. Other armored vehicle types, including tactical trucks and MRAPs, are showing promising growth.

Armored Vehicle Navigation Systems Industry Product Developments

Recent product developments focus on integrating advanced technologies such as AI, machine learning, and improved sensor fusion to enhance situational awareness and navigation accuracy. Miniaturization and ruggedization of navigation systems are also key trends, improving their adaptability to different armored vehicle platforms and harsh operating environments. Systems offering enhanced anti-jamming capabilities and increased cyber-security are gaining traction in the market. These advancements address critical needs within the military and security sector.

Report Scope & Segmentation Analysis

This report segments the Armored Vehicle Navigation Systems market based on navigation system type (Inertial Navigation System, Satellite Navigation System) and armored vehicle type (Main Battle Tanks, Infantry Fighting Vehicles, Armored Personnel Carriers, Other Armored Vehicle Types). Each segment's market size, growth projections, and competitive dynamics are thoroughly analyzed. For instance, the Inertial Navigation System segment is expected to witness a CAGR of xx% due to its reliability in GPS-denied environments. Similarly, the MBT segment will maintain its dominance due to the high value of these vehicles and the critical nature of precise navigation in battlefield scenarios.

Key Drivers of Armored Vehicle Navigation Systems Industry Growth

Several factors drive the growth of the Armored Vehicle Navigation Systems market, including:

  • Increasing global defense budgets
  • Modernization of armored vehicle fleets
  • Technological advancements in navigation systems
  • Rising demand for enhanced situational awareness
  • Stringent security requirements

Challenges in the Armored Vehicle Navigation Systems Industry Sector

Significant challenges include:

  • High initial investment costs for advanced systems, potentially limiting adoption among smaller military forces.
  • Maintenance and operational complexities, which require skilled personnel and resources.
  • Potential vulnerability to electronic warfare (EW) and cyberattacks, requiring robust countermeasures.

Emerging Opportunities in Armored Vehicle Navigation Systems Industry

Emerging opportunities include:

  • Integration of autonomous navigation capabilities.
  • Development of hybrid and more energy-efficient navigation systems.
  • Expansion into new markets with increasing defense spending.

Leading Players in the Armored Vehicle Navigation Systems Industry Market

  • Honeywell International Inc
  • THALES
  • Advanced Navigation
  • GEM elettronica
  • Safran SA
  • Israel Aerospace Industries Ltd
  • KVH Industries Inc
  • RTX Corporation
  • BAE Systems plc
  • Northrop Grumman Corporation
  • Bharat Electronics Limited (BEL)
  • Hertz Systems

Key Developments in Armored Vehicle Navigation Systems Industry Industry

  • Jan 2023: Thales announces the launch of a new generation of highly secure navigation systems for armored vehicles.
  • June 2022: Honeywell integrates its advanced inertial navigation system with a leading armored vehicle manufacturer's platform.
  • Oct 2021: BAE Systems unveils a new system combining GPS and inertial navigation for improved accuracy in GPS-denied environments.

Strategic Outlook for Armored Vehicle Navigation Systems Industry Market

The Armored Vehicle Navigation Systems market is poised for continued growth, driven by technological advancements, increasing military spending, and growing demand for improved situational awareness and navigation precision. Emerging technologies like AI-powered navigation and resilient anti-jamming technologies will further shape the market landscape. Companies focusing on innovation, strategic partnerships, and addressing the evolving security needs of their clients will be well-positioned for success in this dynamic market.

Armored Vehicle Navigation Systems Industry Segmentation

  • 1. Production Analysis
  • 2. Consumption Analysis
  • 3. Import Market Analysis (Value & Volume)
  • 4. Export Market Analysis (Value & Volume)
  • 5. Price Trend Analysis

Armored Vehicle Navigation Systems Industry Segmentation By Geography

  • 1. North America
    • 1.1. United States
    • 1.2. Canada
    • 1.3. Mexico
  • 2. South America
    • 2.1. Brazil
    • 2.2. Argentina
    • 2.3. Rest of South America
  • 3. Europe
    • 3.1. United Kingdom
    • 3.2. Germany
    • 3.3. France
    • 3.4. Italy
    • 3.5. Spain
    • 3.6. Russia
    • 3.7. Benelux
    • 3.8. Nordics
    • 3.9. Rest of Europe
  • 4. Middle East & Africa
    • 4.1. Turkey
    • 4.2. Israel
    • 4.3. GCC
    • 4.4. North Africa
    • 4.5. South Africa
    • 4.6. Rest of Middle East & Africa
  • 5. Asia Pacific
    • 5.1. China
    • 5.2. India
    • 5.3. Japan
    • 5.4. South Korea
    • 5.5. ASEAN
    • 5.6. Oceania
    • 5.7. Rest of Asia Pacific
Armored Vehicle Navigation Systems Industry Regional Share


Armored Vehicle Navigation Systems Industry REPORT HIGHLIGHTS

AspectsDetails
Study Period 2019-2033
Base Year 2024
Estimated Year 2025
Forecast Period2025-2033
Historical Period2019-2024
Growth RateCAGR of 4.92% from 2019-2033
Segmentation
    • By Production Analysis
    • By Consumption Analysis
    • By Import Market Analysis (Value & Volume)
    • By Export Market Analysis (Value & Volume)
    • By Price Trend Analysis
  • By Geography
    • North America
      • United States
      • Canada
      • Mexico
    • South America
      • Brazil
      • Argentina
      • Rest of South America
    • Europe
      • United Kingdom
      • Germany
      • France
      • Italy
      • Spain
      • Russia
      • Benelux
      • Nordics
      • Rest of Europe
    • Middle East & Africa
      • Turkey
      • Israel
      • GCC
      • North Africa
      • South Africa
      • Rest of Middle East & Africa
    • Asia Pacific
      • China
      • India
      • Japan
      • South Korea
      • ASEAN
      • Oceania
      • Rest of Asia Pacific


Table of Contents

  1. 1. Introduction
    • 1.1. Research Scope
    • 1.2. Market Segmentation
    • 1.3. Research Methodology
    • 1.4. Definitions and Assumptions
  2. 2. Executive Summary
    • 2.1. Introduction
  3. 3. Market Dynamics
    • 3.1. Introduction
      • 3.2. Market Drivers
        • 3.2.1. ; Increased Seaborne Threats And Ambiguous Maritime Security Policies; Increasing Adoption Of Security Technologies In Bric Countries
      • 3.3. Market Restrains
        • 3.3.1. ; High Risk Rate In Ungoverned Zones; Unstructured Security Standards And Technologies
      • 3.4. Market Trends
        • 3.4.1. Inertial Navigation Systems to Exhibit the Highest Growth Rate
  4. 4. Market Factor Analysis
    • 4.1. Porters Five Forces
    • 4.2. Supply/Value Chain
    • 4.3. PESTEL analysis
    • 4.4. Market Entropy
    • 4.5. Patent/Trademark Analysis
  5. 5. Global Armored Vehicle Navigation Systems Industry Analysis, Insights and Forecast, 2019-2031
    • 5.1. Market Analysis, Insights and Forecast - by Production Analysis
      • 5.2. Market Analysis, Insights and Forecast - by Consumption Analysis
        • 5.3. Market Analysis, Insights and Forecast - by Import Market Analysis (Value & Volume)
          • 5.4. Market Analysis, Insights and Forecast - by Export Market Analysis (Value & Volume)
            • 5.5. Market Analysis, Insights and Forecast - by Price Trend Analysis
              • 5.6. Market Analysis, Insights and Forecast - by Region
                • 5.6.1. North America
                • 5.6.2. South America
                • 5.6.3. Europe
                • 5.6.4. Middle East & Africa
                • 5.6.5. Asia Pacific
            • 6. North America Armored Vehicle Navigation Systems Industry Analysis, Insights and Forecast, 2019-2031
              • 6.1. Market Analysis, Insights and Forecast - by Production Analysis
                • 6.2. Market Analysis, Insights and Forecast - by Consumption Analysis
                  • 6.3. Market Analysis, Insights and Forecast - by Import Market Analysis (Value & Volume)
                    • 6.4. Market Analysis, Insights and Forecast - by Export Market Analysis (Value & Volume)
                      • 6.5. Market Analysis, Insights and Forecast - by Price Trend Analysis
                      • 7. South America Armored Vehicle Navigation Systems Industry Analysis, Insights and Forecast, 2019-2031
                        • 7.1. Market Analysis, Insights and Forecast - by Production Analysis
                          • 7.2. Market Analysis, Insights and Forecast - by Consumption Analysis
                            • 7.3. Market Analysis, Insights and Forecast - by Import Market Analysis (Value & Volume)
                              • 7.4. Market Analysis, Insights and Forecast - by Export Market Analysis (Value & Volume)
                                • 7.5. Market Analysis, Insights and Forecast - by Price Trend Analysis
                                • 8. Europe Armored Vehicle Navigation Systems Industry Analysis, Insights and Forecast, 2019-2031
                                  • 8.1. Market Analysis, Insights and Forecast - by Production Analysis
                                    • 8.2. Market Analysis, Insights and Forecast - by Consumption Analysis
                                      • 8.3. Market Analysis, Insights and Forecast - by Import Market Analysis (Value & Volume)
                                        • 8.4. Market Analysis, Insights and Forecast - by Export Market Analysis (Value & Volume)
                                          • 8.5. Market Analysis, Insights and Forecast - by Price Trend Analysis
                                          • 9. Middle East & Africa Armored Vehicle Navigation Systems Industry Analysis, Insights and Forecast, 2019-2031
                                            • 9.1. Market Analysis, Insights and Forecast - by Production Analysis
                                              • 9.2. Market Analysis, Insights and Forecast - by Consumption Analysis
                                                • 9.3. Market Analysis, Insights and Forecast - by Import Market Analysis (Value & Volume)
                                                  • 9.4. Market Analysis, Insights and Forecast - by Export Market Analysis (Value & Volume)
                                                    • 9.5. Market Analysis, Insights and Forecast - by Price Trend Analysis
                                                    • 10. Asia Pacific Armored Vehicle Navigation Systems Industry Analysis, Insights and Forecast, 2019-2031
                                                      • 10.1. Market Analysis, Insights and Forecast - by Production Analysis
                                                        • 10.2. Market Analysis, Insights and Forecast - by Consumption Analysis
                                                          • 10.3. Market Analysis, Insights and Forecast - by Import Market Analysis (Value & Volume)
                                                            • 10.4. Market Analysis, Insights and Forecast - by Export Market Analysis (Value & Volume)
                                                              • 10.5. Market Analysis, Insights and Forecast - by Price Trend Analysis
                                                              • 11. North America Armored Vehicle Navigation Systems Industry Analysis, Insights and Forecast, 2019-2031
                                                                  • 11.1. Market Analysis, Insights and Forecast - By Country/Sub-region
                                                                    • 11.1.1 United States
                                                                    • 11.1.2 Canada
                                                              • 12. Europe Armored Vehicle Navigation Systems Industry Analysis, Insights and Forecast, 2019-2031
                                                                  • 12.1. Market Analysis, Insights and Forecast - By Country/Sub-region
                                                                    • 12.1.1 Germany
                                                                    • 12.1.2 United Kingdom
                                                                    • 12.1.3 France
                                                                    • 12.1.4 Russia
                                                                    • 12.1.5 Rest of Europe
                                                              • 13. Asia Pacific Armored Vehicle Navigation Systems Industry Analysis, Insights and Forecast, 2019-2031
                                                                  • 13.1. Market Analysis, Insights and Forecast - By Country/Sub-region
                                                                    • 13.1.1 India
                                                                    • 13.1.2 China
                                                                    • 13.1.3 Japan
                                                                    • 13.1.4 South Korea
                                                                    • 13.1.5 Australia
                                                                    • 13.1.6 Rest of Asia Pacific
                                                              • 14. Latin America Armored Vehicle Navigation Systems Industry Analysis, Insights and Forecast, 2019-2031
                                                                  • 14.1. Market Analysis, Insights and Forecast - By Country/Sub-region
                                                                    • 14.1.1 Mexico
                                                                    • 14.1.2 Brazil
                                                                    • 14.1.3 Rest Of Latin America
                                                              • 15. Middle East and Africa Armored Vehicle Navigation Systems Industry Analysis, Insights and Forecast, 2019-2031
                                                                  • 15.1. Market Analysis, Insights and Forecast - By Country/Sub-region
                                                                    • 15.1.1 United Arab Emirates
                                                                    • 15.1.2 Saudi Arabia
                                                                    • 15.1.3 Israel
                                                                    • 15.1.4 Rest of Middle East and Africa
                                                              • 16. Competitive Analysis
                                                                • 16.1. Global Market Share Analysis 2024
                                                                  • 16.2. Company Profiles
                                                                    • 16.2.1 Honeywell International Inc
                                                                      • 16.2.1.1. Overview
                                                                      • 16.2.1.2. Products
                                                                      • 16.2.1.3. SWOT Analysis
                                                                      • 16.2.1.4. Recent Developments
                                                                      • 16.2.1.5. Financials (Based on Availability)
                                                                    • 16.2.2 THALES
                                                                      • 16.2.2.1. Overview
                                                                      • 16.2.2.2. Products
                                                                      • 16.2.2.3. SWOT Analysis
                                                                      • 16.2.2.4. Recent Developments
                                                                      • 16.2.2.5. Financials (Based on Availability)
                                                                    • 16.2.3 Advanced Navigation
                                                                      • 16.2.3.1. Overview
                                                                      • 16.2.3.2. Products
                                                                      • 16.2.3.3. SWOT Analysis
                                                                      • 16.2.3.4. Recent Developments
                                                                      • 16.2.3.5. Financials (Based on Availability)
                                                                    • 16.2.4 GEM elettronica
                                                                      • 16.2.4.1. Overview
                                                                      • 16.2.4.2. Products
                                                                      • 16.2.4.3. SWOT Analysis
                                                                      • 16.2.4.4. Recent Developments
                                                                      • 16.2.4.5. Financials (Based on Availability)
                                                                    • 16.2.5 Safran SA
                                                                      • 16.2.5.1. Overview
                                                                      • 16.2.5.2. Products
                                                                      • 16.2.5.3. SWOT Analysis
                                                                      • 16.2.5.4. Recent Developments
                                                                      • 16.2.5.5. Financials (Based on Availability)
                                                                    • 16.2.6 Israel Aerospace Industries Ltd
                                                                      • 16.2.6.1. Overview
                                                                      • 16.2.6.2. Products
                                                                      • 16.2.6.3. SWOT Analysis
                                                                      • 16.2.6.4. Recent Developments
                                                                      • 16.2.6.5. Financials (Based on Availability)
                                                                    • 16.2.7 KVH Industries Inc
                                                                      • 16.2.7.1. Overview
                                                                      • 16.2.7.2. Products
                                                                      • 16.2.7.3. SWOT Analysis
                                                                      • 16.2.7.4. Recent Developments
                                                                      • 16.2.7.5. Financials (Based on Availability)
                                                                    • 16.2.8 RTX Corporatio
                                                                      • 16.2.8.1. Overview
                                                                      • 16.2.8.2. Products
                                                                      • 16.2.8.3. SWOT Analysis
                                                                      • 16.2.8.4. Recent Developments
                                                                      • 16.2.8.5. Financials (Based on Availability)
                                                                    • 16.2.9 BAE Systems plc
                                                                      • 16.2.9.1. Overview
                                                                      • 16.2.9.2. Products
                                                                      • 16.2.9.3. SWOT Analysis
                                                                      • 16.2.9.4. Recent Developments
                                                                      • 16.2.9.5. Financials (Based on Availability)
                                                                    • 16.2.10 Northrop Grumman Corporation
                                                                      • 16.2.10.1. Overview
                                                                      • 16.2.10.2. Products
                                                                      • 16.2.10.3. SWOT Analysis
                                                                      • 16.2.10.4. Recent Developments
                                                                      • 16.2.10.5. Financials (Based on Availability)
                                                                    • 16.2.11 Bharat Electronics Limited (BEL)
                                                                      • 16.2.11.1. Overview
                                                                      • 16.2.11.2. Products
                                                                      • 16.2.11.3. SWOT Analysis
                                                                      • 16.2.11.4. Recent Developments
                                                                      • 16.2.11.5. Financials (Based on Availability)
                                                                    • 16.2.12 Hertz Systems
                                                                      • 16.2.12.1. Overview
                                                                      • 16.2.12.2. Products
                                                                      • 16.2.12.3. SWOT Analysis
                                                                      • 16.2.12.4. Recent Developments
                                                                      • 16.2.12.5. Financials (Based on Availability)

                                                              List of Figures

                                                              1. Figure 1: Global Armored Vehicle Navigation Systems Industry Revenue Breakdown (Million, %) by Region 2024 & 2032
                                                              2. Figure 2: North America Armored Vehicle Navigation Systems Industry Revenue (Million), by Country 2024 & 2032
                                                              3. Figure 3: North America Armored Vehicle Navigation Systems Industry Revenue Share (%), by Country 2024 & 2032
                                                              4. Figure 4: Europe Armored Vehicle Navigation Systems Industry Revenue (Million), by Country 2024 & 2032
                                                              5. Figure 5: Europe Armored Vehicle Navigation Systems Industry Revenue Share (%), by Country 2024 & 2032
                                                              6. Figure 6: Asia Pacific Armored Vehicle Navigation Systems Industry Revenue (Million), by Country 2024 & 2032
                                                              7. Figure 7: Asia Pacific Armored Vehicle Navigation Systems Industry Revenue Share (%), by Country 2024 & 2032
                                                              8. Figure 8: Latin America Armored Vehicle Navigation Systems Industry Revenue (Million), by Country 2024 & 2032
                                                              9. Figure 9: Latin America Armored Vehicle Navigation Systems Industry Revenue Share (%), by Country 2024 & 2032
                                                              10. Figure 10: Middle East and Africa Armored Vehicle Navigation Systems Industry Revenue (Million), by Country 2024 & 2032
                                                              11. Figure 11: Middle East and Africa Armored Vehicle Navigation Systems Industry Revenue Share (%), by Country 2024 & 2032
                                                              12. Figure 12: North America Armored Vehicle Navigation Systems Industry Revenue (Million), by Production Analysis 2024 & 2032
                                                              13. Figure 13: North America Armored Vehicle Navigation Systems Industry Revenue Share (%), by Production Analysis 2024 & 2032
                                                              14. Figure 14: North America Armored Vehicle Navigation Systems Industry Revenue (Million), by Consumption Analysis 2024 & 2032
                                                              15. Figure 15: North America Armored Vehicle Navigation Systems Industry Revenue Share (%), by Consumption Analysis 2024 & 2032
                                                              16. Figure 16: North America Armored Vehicle Navigation Systems Industry Revenue (Million), by Import Market Analysis (Value & Volume) 2024 & 2032
                                                              17. Figure 17: North America Armored Vehicle Navigation Systems Industry Revenue Share (%), by Import Market Analysis (Value & Volume) 2024 & 2032
                                                              18. Figure 18: North America Armored Vehicle Navigation Systems Industry Revenue (Million), by Export Market Analysis (Value & Volume) 2024 & 2032
                                                              19. Figure 19: North America Armored Vehicle Navigation Systems Industry Revenue Share (%), by Export Market Analysis (Value & Volume) 2024 & 2032
                                                              20. Figure 20: North America Armored Vehicle Navigation Systems Industry Revenue (Million), by Price Trend Analysis 2024 & 2032
                                                              21. Figure 21: North America Armored Vehicle Navigation Systems Industry Revenue Share (%), by Price Trend Analysis 2024 & 2032
                                                              22. Figure 22: North America Armored Vehicle Navigation Systems Industry Revenue (Million), by Country 2024 & 2032
                                                              23. Figure 23: North America Armored Vehicle Navigation Systems Industry Revenue Share (%), by Country 2024 & 2032
                                                              24. Figure 24: South America Armored Vehicle Navigation Systems Industry Revenue (Million), by Production Analysis 2024 & 2032
                                                              25. Figure 25: South America Armored Vehicle Navigation Systems Industry Revenue Share (%), by Production Analysis 2024 & 2032
                                                              26. Figure 26: South America Armored Vehicle Navigation Systems Industry Revenue (Million), by Consumption Analysis 2024 & 2032
                                                              27. Figure 27: South America Armored Vehicle Navigation Systems Industry Revenue Share (%), by Consumption Analysis 2024 & 2032
                                                              28. Figure 28: South America Armored Vehicle Navigation Systems Industry Revenue (Million), by Import Market Analysis (Value & Volume) 2024 & 2032
                                                              29. Figure 29: South America Armored Vehicle Navigation Systems Industry Revenue Share (%), by Import Market Analysis (Value & Volume) 2024 & 2032
                                                              30. Figure 30: South America Armored Vehicle Navigation Systems Industry Revenue (Million), by Export Market Analysis (Value & Volume) 2024 & 2032
                                                              31. Figure 31: South America Armored Vehicle Navigation Systems Industry Revenue Share (%), by Export Market Analysis (Value & Volume) 2024 & 2032
                                                              32. Figure 32: South America Armored Vehicle Navigation Systems Industry Revenue (Million), by Price Trend Analysis 2024 & 2032
                                                              33. Figure 33: South America Armored Vehicle Navigation Systems Industry Revenue Share (%), by Price Trend Analysis 2024 & 2032
                                                              34. Figure 34: South America Armored Vehicle Navigation Systems Industry Revenue (Million), by Country 2024 & 2032
                                                              35. Figure 35: South America Armored Vehicle Navigation Systems Industry Revenue Share (%), by Country 2024 & 2032
                                                              36. Figure 36: Europe Armored Vehicle Navigation Systems Industry Revenue (Million), by Production Analysis 2024 & 2032
                                                              37. Figure 37: Europe Armored Vehicle Navigation Systems Industry Revenue Share (%), by Production Analysis 2024 & 2032
                                                              38. Figure 38: Europe Armored Vehicle Navigation Systems Industry Revenue (Million), by Consumption Analysis 2024 & 2032
                                                              39. Figure 39: Europe Armored Vehicle Navigation Systems Industry Revenue Share (%), by Consumption Analysis 2024 & 2032
                                                              40. Figure 40: Europe Armored Vehicle Navigation Systems Industry Revenue (Million), by Import Market Analysis (Value & Volume) 2024 & 2032
                                                              41. Figure 41: Europe Armored Vehicle Navigation Systems Industry Revenue Share (%), by Import Market Analysis (Value & Volume) 2024 & 2032
                                                              42. Figure 42: Europe Armored Vehicle Navigation Systems Industry Revenue (Million), by Export Market Analysis (Value & Volume) 2024 & 2032
                                                              43. Figure 43: Europe Armored Vehicle Navigation Systems Industry Revenue Share (%), by Export Market Analysis (Value & Volume) 2024 & 2032
                                                              44. Figure 44: Europe Armored Vehicle Navigation Systems Industry Revenue (Million), by Price Trend Analysis 2024 & 2032
                                                              45. Figure 45: Europe Armored Vehicle Navigation Systems Industry Revenue Share (%), by Price Trend Analysis 2024 & 2032
                                                              46. Figure 46: Europe Armored Vehicle Navigation Systems Industry Revenue (Million), by Country 2024 & 2032
                                                              47. Figure 47: Europe Armored Vehicle Navigation Systems Industry Revenue Share (%), by Country 2024 & 2032
                                                              48. Figure 48: Middle East & Africa Armored Vehicle Navigation Systems Industry Revenue (Million), by Production Analysis 2024 & 2032
                                                              49. Figure 49: Middle East & Africa Armored Vehicle Navigation Systems Industry Revenue Share (%), by Production Analysis 2024 & 2032
                                                              50. Figure 50: Middle East & Africa Armored Vehicle Navigation Systems Industry Revenue (Million), by Consumption Analysis 2024 & 2032
                                                              51. Figure 51: Middle East & Africa Armored Vehicle Navigation Systems Industry Revenue Share (%), by Consumption Analysis 2024 & 2032
                                                              52. Figure 52: Middle East & Africa Armored Vehicle Navigation Systems Industry Revenue (Million), by Import Market Analysis (Value & Volume) 2024 & 2032
                                                              53. Figure 53: Middle East & Africa Armored Vehicle Navigation Systems Industry Revenue Share (%), by Import Market Analysis (Value & Volume) 2024 & 2032
                                                              54. Figure 54: Middle East & Africa Armored Vehicle Navigation Systems Industry Revenue (Million), by Export Market Analysis (Value & Volume) 2024 & 2032
                                                              55. Figure 55: Middle East & Africa Armored Vehicle Navigation Systems Industry Revenue Share (%), by Export Market Analysis (Value & Volume) 2024 & 2032
                                                              56. Figure 56: Middle East & Africa Armored Vehicle Navigation Systems Industry Revenue (Million), by Price Trend Analysis 2024 & 2032
                                                              57. Figure 57: Middle East & Africa Armored Vehicle Navigation Systems Industry Revenue Share (%), by Price Trend Analysis 2024 & 2032
                                                              58. Figure 58: Middle East & Africa Armored Vehicle Navigation Systems Industry Revenue (Million), by Country 2024 & 2032
                                                              59. Figure 59: Middle East & Africa Armored Vehicle Navigation Systems Industry Revenue Share (%), by Country 2024 & 2032
                                                              60. Figure 60: Asia Pacific Armored Vehicle Navigation Systems Industry Revenue (Million), by Production Analysis 2024 & 2032
                                                              61. Figure 61: Asia Pacific Armored Vehicle Navigation Systems Industry Revenue Share (%), by Production Analysis 2024 & 2032
                                                              62. Figure 62: Asia Pacific Armored Vehicle Navigation Systems Industry Revenue (Million), by Consumption Analysis 2024 & 2032
                                                              63. Figure 63: Asia Pacific Armored Vehicle Navigation Systems Industry Revenue Share (%), by Consumption Analysis 2024 & 2032
                                                              64. Figure 64: Asia Pacific Armored Vehicle Navigation Systems Industry Revenue (Million), by Import Market Analysis (Value & Volume) 2024 & 2032
                                                              65. Figure 65: Asia Pacific Armored Vehicle Navigation Systems Industry Revenue Share (%), by Import Market Analysis (Value & Volume) 2024 & 2032
                                                              66. Figure 66: Asia Pacific Armored Vehicle Navigation Systems Industry Revenue (Million), by Export Market Analysis (Value & Volume) 2024 & 2032
                                                              67. Figure 67: Asia Pacific Armored Vehicle Navigation Systems Industry Revenue Share (%), by Export Market Analysis (Value & Volume) 2024 & 2032
                                                              68. Figure 68: Asia Pacific Armored Vehicle Navigation Systems Industry Revenue (Million), by Price Trend Analysis 2024 & 2032
                                                              69. Figure 69: Asia Pacific Armored Vehicle Navigation Systems Industry Revenue Share (%), by Price Trend Analysis 2024 & 2032
                                                              70. Figure 70: Asia Pacific Armored Vehicle Navigation Systems Industry Revenue (Million), by Country 2024 & 2032
                                                              71. Figure 71: Asia Pacific Armored Vehicle Navigation Systems Industry Revenue Share (%), by Country 2024 & 2032

                                                              List of Tables

                                                              1. Table 1: Global Armored Vehicle Navigation Systems Industry Revenue Million Forecast, by Region 2019 & 2032
                                                              2. Table 2: Global Armored Vehicle Navigation Systems Industry Revenue Million Forecast, by Production Analysis 2019 & 2032
                                                              3. Table 3: Global Armored Vehicle Navigation Systems Industry Revenue Million Forecast, by Consumption Analysis 2019 & 2032
                                                              4. Table 4: Global Armored Vehicle Navigation Systems Industry Revenue Million Forecast, by Import Market Analysis (Value & Volume) 2019 & 2032
                                                              5. Table 5: Global Armored Vehicle Navigation Systems Industry Revenue Million Forecast, by Export Market Analysis (Value & Volume) 2019 & 2032
                                                              6. Table 6: Global Armored Vehicle Navigation Systems Industry Revenue Million Forecast, by Price Trend Analysis 2019 & 2032
                                                              7. Table 7: Global Armored Vehicle Navigation Systems Industry Revenue Million Forecast, by Region 2019 & 2032
                                                              8. Table 8: Global Armored Vehicle Navigation Systems Industry Revenue Million Forecast, by Country 2019 & 2032
                                                              9. Table 9: United States Armored Vehicle Navigation Systems Industry Revenue (Million) Forecast, by Application 2019 & 2032
                                                              10. Table 10: Canada Armored Vehicle Navigation Systems Industry Revenue (Million) Forecast, by Application 2019 & 2032
                                                              11. Table 11: Global Armored Vehicle Navigation Systems Industry Revenue Million Forecast, by Country 2019 & 2032
                                                              12. Table 12: Germany Armored Vehicle Navigation Systems Industry Revenue (Million) Forecast, by Application 2019 & 2032
                                                              13. Table 13: United Kingdom Armored Vehicle Navigation Systems Industry Revenue (Million) Forecast, by Application 2019 & 2032
                                                              14. Table 14: France Armored Vehicle Navigation Systems Industry Revenue (Million) Forecast, by Application 2019 & 2032
                                                              15. Table 15: Russia Armored Vehicle Navigation Systems Industry Revenue (Million) Forecast, by Application 2019 & 2032
                                                              16. Table 16: Rest of Europe Armored Vehicle Navigation Systems Industry Revenue (Million) Forecast, by Application 2019 & 2032
                                                              17. Table 17: Global Armored Vehicle Navigation Systems Industry Revenue Million Forecast, by Country 2019 & 2032
                                                              18. Table 18: India Armored Vehicle Navigation Systems Industry Revenue (Million) Forecast, by Application 2019 & 2032
                                                              19. Table 19: China Armored Vehicle Navigation Systems Industry Revenue (Million) Forecast, by Application 2019 & 2032
                                                              20. Table 20: Japan Armored Vehicle Navigation Systems Industry Revenue (Million) Forecast, by Application 2019 & 2032
                                                              21. Table 21: South Korea Armored Vehicle Navigation Systems Industry Revenue (Million) Forecast, by Application 2019 & 2032
                                                              22. Table 22: Australia Armored Vehicle Navigation Systems Industry Revenue (Million) Forecast, by Application 2019 & 2032
                                                              23. Table 23: Rest of Asia Pacific Armored Vehicle Navigation Systems Industry Revenue (Million) Forecast, by Application 2019 & 2032
                                                              24. Table 24: Global Armored Vehicle Navigation Systems Industry Revenue Million Forecast, by Country 2019 & 2032
                                                              25. Table 25: Mexico Armored Vehicle Navigation Systems Industry Revenue (Million) Forecast, by Application 2019 & 2032
                                                              26. Table 26: Brazil Armored Vehicle Navigation Systems Industry Revenue (Million) Forecast, by Application 2019 & 2032
                                                              27. Table 27: Rest Of Latin America Armored Vehicle Navigation Systems Industry Revenue (Million) Forecast, by Application 2019 & 2032
                                                              28. Table 28: Global Armored Vehicle Navigation Systems Industry Revenue Million Forecast, by Country 2019 & 2032
                                                              29. Table 29: United Arab Emirates Armored Vehicle Navigation Systems Industry Revenue (Million) Forecast, by Application 2019 & 2032
                                                              30. Table 30: Saudi Arabia Armored Vehicle Navigation Systems Industry Revenue (Million) Forecast, by Application 2019 & 2032
                                                              31. Table 31: Israel Armored Vehicle Navigation Systems Industry Revenue (Million) Forecast, by Application 2019 & 2032
                                                              32. Table 32: Rest of Middle East and Africa Armored Vehicle Navigation Systems Industry Revenue (Million) Forecast, by Application 2019 & 2032
                                                              33. Table 33: Global Armored Vehicle Navigation Systems Industry Revenue Million Forecast, by Production Analysis 2019 & 2032
                                                              34. Table 34: Global Armored Vehicle Navigation Systems Industry Revenue Million Forecast, by Consumption Analysis 2019 & 2032
                                                              35. Table 35: Global Armored Vehicle Navigation Systems Industry Revenue Million Forecast, by Import Market Analysis (Value & Volume) 2019 & 2032
                                                              36. Table 36: Global Armored Vehicle Navigation Systems Industry Revenue Million Forecast, by Export Market Analysis (Value & Volume) 2019 & 2032
                                                              37. Table 37: Global Armored Vehicle Navigation Systems Industry Revenue Million Forecast, by Price Trend Analysis 2019 & 2032
                                                              38. Table 38: Global Armored Vehicle Navigation Systems Industry Revenue Million Forecast, by Country 2019 & 2032
                                                              39. Table 39: United States Armored Vehicle Navigation Systems Industry Revenue (Million) Forecast, by Application 2019 & 2032
                                                              40. Table 40: Canada Armored Vehicle Navigation Systems Industry Revenue (Million) Forecast, by Application 2019 & 2032
                                                              41. Table 41: Mexico Armored Vehicle Navigation Systems Industry Revenue (Million) Forecast, by Application 2019 & 2032
                                                              42. Table 42: Global Armored Vehicle Navigation Systems Industry Revenue Million Forecast, by Production Analysis 2019 & 2032
                                                              43. Table 43: Global Armored Vehicle Navigation Systems Industry Revenue Million Forecast, by Consumption Analysis 2019 & 2032
                                                              44. Table 44: Global Armored Vehicle Navigation Systems Industry Revenue Million Forecast, by Import Market Analysis (Value & Volume) 2019 & 2032
                                                              45. Table 45: Global Armored Vehicle Navigation Systems Industry Revenue Million Forecast, by Export Market Analysis (Value & Volume) 2019 & 2032
                                                              46. Table 46: Global Armored Vehicle Navigation Systems Industry Revenue Million Forecast, by Price Trend Analysis 2019 & 2032
                                                              47. Table 47: Global Armored Vehicle Navigation Systems Industry Revenue Million Forecast, by Country 2019 & 2032
                                                              48. Table 48: Brazil Armored Vehicle Navigation Systems Industry Revenue (Million) Forecast, by Application 2019 & 2032
                                                              49. Table 49: Argentina Armored Vehicle Navigation Systems Industry Revenue (Million) Forecast, by Application 2019 & 2032
                                                              50. Table 50: Rest of South America Armored Vehicle Navigation Systems Industry Revenue (Million) Forecast, by Application 2019 & 2032
                                                              51. Table 51: Global Armored Vehicle Navigation Systems Industry Revenue Million Forecast, by Production Analysis 2019 & 2032
                                                              52. Table 52: Global Armored Vehicle Navigation Systems Industry Revenue Million Forecast, by Consumption Analysis 2019 & 2032
                                                              53. Table 53: Global Armored Vehicle Navigation Systems Industry Revenue Million Forecast, by Import Market Analysis (Value & Volume) 2019 & 2032
                                                              54. Table 54: Global Armored Vehicle Navigation Systems Industry Revenue Million Forecast, by Export Market Analysis (Value & Volume) 2019 & 2032
                                                              55. Table 55: Global Armored Vehicle Navigation Systems Industry Revenue Million Forecast, by Price Trend Analysis 2019 & 2032
                                                              56. Table 56: Global Armored Vehicle Navigation Systems Industry Revenue Million Forecast, by Country 2019 & 2032
                                                              57. Table 57: United Kingdom Armored Vehicle Navigation Systems Industry Revenue (Million) Forecast, by Application 2019 & 2032
                                                              58. Table 58: Germany Armored Vehicle Navigation Systems Industry Revenue (Million) Forecast, by Application 2019 & 2032
                                                              59. Table 59: France Armored Vehicle Navigation Systems Industry Revenue (Million) Forecast, by Application 2019 & 2032
                                                              60. Table 60: Italy Armored Vehicle Navigation Systems Industry Revenue (Million) Forecast, by Application 2019 & 2032
                                                              61. Table 61: Spain Armored Vehicle Navigation Systems Industry Revenue (Million) Forecast, by Application 2019 & 2032
                                                              62. Table 62: Russia Armored Vehicle Navigation Systems Industry Revenue (Million) Forecast, by Application 2019 & 2032
                                                              63. Table 63: Benelux Armored Vehicle Navigation Systems Industry Revenue (Million) Forecast, by Application 2019 & 2032
                                                              64. Table 64: Nordics Armored Vehicle Navigation Systems Industry Revenue (Million) Forecast, by Application 2019 & 2032
                                                              65. Table 65: Rest of Europe Armored Vehicle Navigation Systems Industry Revenue (Million) Forecast, by Application 2019 & 2032
                                                              66. Table 66: Global Armored Vehicle Navigation Systems Industry Revenue Million Forecast, by Production Analysis 2019 & 2032
                                                              67. Table 67: Global Armored Vehicle Navigation Systems Industry Revenue Million Forecast, by Consumption Analysis 2019 & 2032
                                                              68. Table 68: Global Armored Vehicle Navigation Systems Industry Revenue Million Forecast, by Import Market Analysis (Value & Volume) 2019 & 2032
                                                              69. Table 69: Global Armored Vehicle Navigation Systems Industry Revenue Million Forecast, by Export Market Analysis (Value & Volume) 2019 & 2032
                                                              70. Table 70: Global Armored Vehicle Navigation Systems Industry Revenue Million Forecast, by Price Trend Analysis 2019 & 2032
                                                              71. Table 71: Global Armored Vehicle Navigation Systems Industry Revenue Million Forecast, by Country 2019 & 2032
                                                              72. Table 72: Turkey Armored Vehicle Navigation Systems Industry Revenue (Million) Forecast, by Application 2019 & 2032
                                                              73. Table 73: Israel Armored Vehicle Navigation Systems Industry Revenue (Million) Forecast, by Application 2019 & 2032
                                                              74. Table 74: GCC Armored Vehicle Navigation Systems Industry Revenue (Million) Forecast, by Application 2019 & 2032
                                                              75. Table 75: North Africa Armored Vehicle Navigation Systems Industry Revenue (Million) Forecast, by Application 2019 & 2032
                                                              76. Table 76: South Africa Armored Vehicle Navigation Systems Industry Revenue (Million) Forecast, by Application 2019 & 2032
                                                              77. Table 77: Rest of Middle East & Africa Armored Vehicle Navigation Systems Industry Revenue (Million) Forecast, by Application 2019 & 2032
                                                              78. Table 78: Global Armored Vehicle Navigation Systems Industry Revenue Million Forecast, by Production Analysis 2019 & 2032
                                                              79. Table 79: Global Armored Vehicle Navigation Systems Industry Revenue Million Forecast, by Consumption Analysis 2019 & 2032
                                                              80. Table 80: Global Armored Vehicle Navigation Systems Industry Revenue Million Forecast, by Import Market Analysis (Value & Volume) 2019 & 2032
                                                              81. Table 81: Global Armored Vehicle Navigation Systems Industry Revenue Million Forecast, by Export Market Analysis (Value & Volume) 2019 & 2032
                                                              82. Table 82: Global Armored Vehicle Navigation Systems Industry Revenue Million Forecast, by Price Trend Analysis 2019 & 2032
                                                              83. Table 83: Global Armored Vehicle Navigation Systems Industry Revenue Million Forecast, by Country 2019 & 2032
                                                              84. Table 84: China Armored Vehicle Navigation Systems Industry Revenue (Million) Forecast, by Application 2019 & 2032
                                                              85. Table 85: India Armored Vehicle Navigation Systems Industry Revenue (Million) Forecast, by Application 2019 & 2032
                                                              86. Table 86: Japan Armored Vehicle Navigation Systems Industry Revenue (Million) Forecast, by Application 2019 & 2032
                                                              87. Table 87: South Korea Armored Vehicle Navigation Systems Industry Revenue (Million) Forecast, by Application 2019 & 2032
                                                              88. Table 88: ASEAN Armored Vehicle Navigation Systems Industry Revenue (Million) Forecast, by Application 2019 & 2032
                                                              89. Table 89: Oceania Armored Vehicle Navigation Systems Industry Revenue (Million) Forecast, by Application 2019 & 2032
                                                              90. Table 90: Rest of Asia Pacific Armored Vehicle Navigation Systems Industry Revenue (Million) Forecast, by Application 2019 & 2032


                                                              Frequently Asked Questions

                                                              1. What is the projected Compound Annual Growth Rate (CAGR) of the Armored Vehicle Navigation Systems Industry?

                                                              The projected CAGR is approximately 4.92%.

                                                              2. Which companies are prominent players in the Armored Vehicle Navigation Systems Industry?

                                                              Key companies in the market include Honeywell International Inc, THALES, Advanced Navigation, GEM elettronica, Safran SA, Israel Aerospace Industries Ltd, KVH Industries Inc, RTX Corporatio, BAE Systems plc, Northrop Grumman Corporation, Bharat Electronics Limited (BEL), Hertz Systems.

                                                              3. What are the main segments of the Armored Vehicle Navigation Systems Industry?

                                                              The market segments include Production Analysis, Consumption Analysis, Import Market Analysis (Value & Volume), Export Market Analysis (Value & Volume), Price Trend Analysis.

                                                              4. Can you provide details about the market size?

                                                              The market size is estimated to be USD 103.45 Million as of 2022.

                                                              5. What are some drivers contributing to market growth?

                                                              ; Increased Seaborne Threats And Ambiguous Maritime Security Policies; Increasing Adoption Of Security Technologies In Bric Countries.

                                                              6. What are the notable trends driving market growth?

                                                              Inertial Navigation Systems to Exhibit the Highest Growth Rate.

                                                              7. Are there any restraints impacting market growth?

                                                              ; High Risk Rate In Ungoverned Zones; Unstructured Security Standards And Technologies.

                                                              8. Can you provide examples of recent developments in the market?

                                                              N/A

                                                              9. What pricing options are available for accessing the report?

                                                              Pricing options include single-user, multi-user, and enterprise licenses priced at USD 4750, USD 5250, and USD 8750 respectively.

                                                              10. Is the market size provided in terms of value or volume?

                                                              The market size is provided in terms of value, measured in Million.

                                                              11. Are there any specific market keywords associated with the report?

                                                              Yes, the market keyword associated with the report is "Armored Vehicle Navigation Systems Industry," which aids in identifying and referencing the specific market segment covered.

                                                              12. How do I determine which pricing option suits my needs best?

                                                              The pricing options vary based on user requirements and access needs. Individual users may opt for single-user licenses, while businesses requiring broader access may choose multi-user or enterprise licenses for cost-effective access to the report.

                                                              13. Are there any additional resources or data provided in the Armored Vehicle Navigation Systems Industry report?

                                                              While the report offers comprehensive insights, it's advisable to review the specific contents or supplementary materials provided to ascertain if additional resources or data are available.

                                                              14. How can I stay updated on further developments or reports in the Armored Vehicle Navigation Systems Industry?

                                                              To stay informed about further developments, trends, and reports in the Armored Vehicle Navigation Systems Industry, consider subscribing to industry newsletters, following relevant companies and organizations, or regularly checking reputable industry news sources and publications.


                                                              Methodology

                                                              Step 1 - Identification of Relevant Samples Size from Population Database

                                                              Step Chart
                                                              Bar Chart
                                                              Method Chart

                                                              Step 2 - Approaches for Defining Global Market Size (Value, Volume* & Price*)

                                                              Approach Chart
                                                              Top-down and bottom-up approaches are used to validate the global market size and estimate the market size for manufactures, regional segments, product, and application.

                                                              Note*: In applicable scenarios

                                                              Step 3 - Data Sources

                                                              Primary Research

                                                              • Web Analytics
                                                              • Survey Reports
                                                              • Research Institute
                                                              • Latest Research Reports
                                                              • Opinion Leaders

                                                              Secondary Research

                                                              • Annual Reports
                                                              • White Paper
                                                              • Latest Press Release
                                                              • Industry Association
                                                              • Paid Database
                                                              • Investor Presentations
                                                              Analyst Chart

                                                              Step 4 - Data Triangulation

                                                              Involves using different sources of information in order to increase the validity of a study

                                                              These sources are likely to be stakeholders in a program - participants, other researchers, program staff, other community members, and so on.

                                                              Then we put all data in single framework & apply various statistical tools to find out the dynamic on the market.

                                                              During the analysis stage, feedback from the stakeholder groups would be compared to determine areas of agreement as well as areas of divergence

                                                              Additionally, after gathering mixed and scattered data from a wide range of sources, data is triangulated and correlated to come up with estimated figures which are further validated through primary mediums or industry experts, opinion leaders.

                                                              About Research Axiom

                                                              Research Axiom delivers in-depth market research, industry analysis, and consulting for pharmaceuticals, automotive, IT, and consumer goods. Our reports provide the clarity you need to make informed decisions and drive innovation.

                                                              Our team combines primary research, advanced analytics, and sector expertise to deliver actionable intelligence. We offer syndicated reports, custom research, and consulting services tailored to your business needs.

                                                              At Research Axiom, we are committed to quality, transparency, and client satisfaction. Every report is rigorously validated to ensure accuracy and relevance. Our global perspective and local expertise help you understand both the big picture and the finer details of your market.

                                                              Stay informed with Research Axiom. Subscribe to our newsletter for the latest updates and research highlights, and follow us on social media for real-time insights. Research Axiom – Turning Data into Business Advantage.

                                                              • Home
                                                              • About Us
                                                              • Industries
                                                                • Aerospace & Defense
                                                                • Agriculture
                                                                • Animal Nutrition & Wellness
                                                                • Automotive
                                                                • Chemicals & Materials
                                                                • Consumer Goods and Services
                                                                • Energy & Power
                                                                • Financial Services and Investment Intelligence
                                                                • Food & Beverage
                                                                • Home and Property Improvement
                                                                • Hospitality and Tourism
                                                                • Logistics
                                                                • Manufacturing Products and Services
                                                                • Packaging
                                                                • Professional and Commercial Services
                                                                • Real Estate and Construction
                                                                • Retail
                                                                • Technology, Media and Telecom
                                                                • Healthcare
                                                              • Services
                                                              • Contact
                                                              Main Logo
                                                              • Home
                                                              • About Us
                                                              • Industries
                                                                • Aerospace & Defense
                                                                • Agriculture
                                                                • Animal Nutrition & Wellness
                                                                • Automotive
                                                                • Chemicals & Materials
                                                                • Consumer Goods and Services
                                                                • Energy & Power
                                                                • Financial Services and Investment Intelligence
                                                                • Food & Beverage
                                                                • Home and Property Improvement
                                                                • Hospitality and Tourism
                                                                • Logistics
                                                                • Manufacturing Products and Services
                                                                • Packaging
                                                                • Professional and Commercial Services
                                                                • Real Estate and Construction
                                                                • Retail
                                                                • Technology, Media and Telecom
                                                                • Healthcare
                                                              • Services
                                                              • Contact
                                                              +17162654855
                                                              [email protected]

                                                              +17162654855

                                                              [email protected]

                                                              Business Address

                                                              Head Office

                                                              Office no. A 5010, fifth floor, Solitaire Business Hub, Near Phoenix mall, Pune, Maharashtra 411014

                                                              Contact Information

                                                              Craig Francis

                                                              Business Development Head

                                                              +17162654855

                                                              [email protected]

                                                              Connect With Us

                                                              Secure Payment Partners

                                                              payment image
                                                              RetailLogisticsPackagingAutomotiveHealthcareAgricultureEnergy & PowerFood & BeverageAerospace & DefenseChemicals & MaterialsHospitality and TourismAnimal Nutrition & WellnessConsumer Goods and ServicesReal Estate and ConstructionHome and Property ImprovementTechnology, Media and TelecomManufacturing Products and ServicesFinancial Services and Investment Intelligence

                                                              © 2025 All rights reserved


                                                              Privacy Policy
                                                              Terms and Conditions
                                                              FAQ
                                                              artwork spiralartwork spiralRelated Reports
                                                              artwork underline

                                                              Southeast Asia, Middle-East And Africa Small Arms And Ammunition Market 2025-2033: Preparing for Growth and Change

                                                              The Southeast Asia, Middle East & Africa small arms and ammunition market is projected to reach \$1.07 billion by 2033, growing at a CAGR of 1.83%. This report analyzes market drivers, restraints, and key players, offering valuable insights into this dynamic sector. Explore regional breakdowns and future projections.

                                                              July 2025
                                                              Base Year: 2024
                                                              No Of Pages: 234
                                                              Price: $4750

                                                              Naval Combat Weapons Market Strategic Roadmap: Analysis and Forecasts 2025-2033

                                                              The Naval Combat Weapons market is booming, projected to reach $XX million by 2033 with a 4% CAGR. This comprehensive analysis explores market drivers, trends, restraints, and key players like General Dynamics and Lockheed Martin, covering segments like underwater and surface-based weapons across diverse regions. Discover the future of naval warfare technology.

                                                              July 2025
                                                              Base Year: 2024
                                                              No Of Pages: 234
                                                              Price: $4750

                                                              Target Acquisition Systems Market Report 2025: Growth Driven by Government Incentives and Partnerships

                                                              Discover the explosive growth in the Target Acquisition Systems market, projected to exceed a 5.5% CAGR through 2033. This in-depth analysis reveals key drivers, market segments (land, airborne, naval), leading companies, and regional trends. Learn how technological advancements and geopolitical factors are shaping this lucrative sector.

                                                              July 2025
                                                              Base Year: 2024
                                                              No Of Pages: 234
                                                              Price: $4750

                                                              Aerospace Plastics Industry Market Outlook and Strategic Insights

                                                              The Aerospace Plastics Market is booming, projected to reach $25 billion by 2033 at a CAGR of 7.66%. Driven by lightweighting and fuel efficiency demands, this report analyzes market trends, key players (Premium AEROTEC, Toray Industries), regional growth (North America, Asia-Pacific), and segment applications (aerostructures, cabin interiors). Discover insights into this rapidly expanding sector.

                                                              July 2025
                                                              Base Year: 2024
                                                              No Of Pages: 234
                                                              Price: $4750

                                                              Challenges to Overcome in Commercial Airport Lighting Market Market Growth: Analysis 2025-2033

                                                              The commercial airport lighting market is booming, projected to reach [estimated 2033 market size] by 2033, driven by LED adoption and infrastructure expansion. Learn about market trends, key players (Honeywell, ADB SAFEGATE, etc.), and regional growth in this in-depth analysis.

                                                              July 2025
                                                              Base Year: 2024
                                                              No Of Pages: 234
                                                              Price: $4750

                                                              North America Small Satellite Market 2025-2033 Trends: Unveiling Growth Opportunities and Competitor Dynamics

                                                              The North American small satellite market is booming, with a projected CAGR of 5.18% through 2033. Driven by commercial and government demand for Earth observation, communication, and navigation, this report analyzes market size, key players (SpaceX, Swarm Technologies, etc.), and emerging trends in LEO, GEO, and MEO satellite technology. Discover the opportunities and challenges shaping this dynamic sector.

                                                              July 2025
                                                              Base Year: 2024
                                                              No Of Pages: 197
                                                              Price: $3800

                                                              Aircraft Door Market CAGR Growth Drivers and Trends: Forecasts 2025-2033

                                                              The aircraft door market is booming, projected to reach $8.48 billion by 2033 at a CAGR of 5.69%. This in-depth analysis explores market drivers, trends, restraints, segmentation (commercial, military, general aviation; passenger, cargo, emergency doors), key players (Safran, Collins Aerospace, etc.), and regional growth forecasts. Discover the opportunities and challenges shaping this dynamic sector.

                                                              July 2025
                                                              Base Year: 2024
                                                              No Of Pages: 234
                                                              Price: $4750

                                                              Future-Forward Strategies for EMEA Aviation Infrastructure Industry Industry

                                                              The EMEA aviation infrastructure market is booming, projected to reach $1.47 billion by 2033 with a 4.42% CAGR. Discover key market trends, drivers, restraints, and major players shaping this dynamic sector. Explore regional breakdowns and infrastructure segment analyses.

                                                              July 2025
                                                              Base Year: 2024
                                                              No Of Pages: 234
                                                              Price: $4750

                                                              APAC Military Aircraft Modernization and Retrofit Market 2025 Market Trends and 2033 Forecasts: Exploring Growth Potential

                                                              The APAC military aircraft modernization and retrofit market is booming, projected to reach $13.71 billion by 2025, driven by geopolitical tensions and technological advancements. Learn about key market trends, major players, and growth forecasts until 2033.

                                                              July 2025
                                                              Base Year: 2024
                                                              No Of Pages: 197
                                                              Price: $3800

                                                              Future-Ready Strategies for North America Charter Jet Services Market Market Growth

                                                              The North America charter jet services market is booming, projected to reach \$24.2 billion by 2033 with a 9.1% CAGR. Discover key trends, drivers, and leading companies shaping this lucrative private aviation sector. Learn about market segmentation by aircraft size and regional analysis focusing on the US, Canada, and Mexico.

                                                              July 2025
                                                              Base Year: 2024
                                                              No Of Pages: 234
                                                              Price: $4750

                                                              Middle East Aviation Market Report Probes the XXX Million Size, Share, Growth Report and Future Analysis by 2033

                                                              The Middle East aviation market, a $27.18 billion industry in 2025, is booming. Discover key trends, growth drivers (tourism, infrastructure investments), and leading companies shaping this rapidly expanding sector with a projected 4.40% CAGR until 2033. Explore regional market shares and future projections for commercial, military, and general aviation.

                                                              July 2025
                                                              Base Year: 2024
                                                              No Of Pages: 234
                                                              Price: $4750

                                                              Commercial Airport Radar Systems Industry Future-proof Strategies: Trends, Competitor Dynamics, and Opportunities 2025-2033

                                                              The Commercial Airport Radar Systems market is booming, projected to reach $5.98B in 2025 with a 7.48% CAGR. Discover key trends, drivers, restraints, and leading companies shaping this vital sector for air traffic management. Learn about market segmentation by application (surveillance, weather, approach radars) and regional analysis.

                                                              July 2025
                                                              Base Year: 2024
                                                              No Of Pages: 234
                                                              Price: $4750

                                                              Market Deep Dive: Exploring Defense Aircraft Materials Market Trends 2025-2033

                                                              Discover the booming defense aircraft materials market! This comprehensive analysis reveals key trends, drivers, and restraints impacting growth through 2033, covering materials like aluminum alloys, titanium, and composites, and major players like Toray and DuPont. Explore regional market shares and forecast data.

                                                              July 2025
                                                              Base Year: 2024
                                                              No Of Pages: 234
                                                              Price: $4750

                                                              Future Trends Shaping Naval ISR Market Growth

                                                              Discover the booming Naval ISR market, projected to reach $XX million by 2033 with a 3.5% CAGR. Explore market drivers, trends, and key players like Lockheed Martin and General Dynamics. Learn about regional growth in North America, Europe, and Asia-Pacific. Get the insights you need for strategic planning.

                                                              July 2025
                                                              Base Year: 2024
                                                              No Of Pages: 234
                                                              Price: $4750

                                                              Latin America Inflight Services Market Market’s Growth Blueprint

                                                              Discover the booming Latin American inflight services market! This comprehensive analysis reveals a $1.11B market in 2025, projecting 9.91% CAGR growth to 2033. Explore key drivers, trends, and challenges impacting airlines, catering companies, and passenger experiences. Learn about market segmentation, leading players, and regional opportunities.

                                                              July 2025
                                                              Base Year: 2024
                                                              No Of Pages: 234
                                                              Price: $4750

                                                              Airport Ground Handling Vehicles Industry 2025-2033 Trends: Unveiling Growth Opportunities and Competitor Dynamics

                                                              The Airport Ground Handling Vehicles market is booming, projected to reach $8.94B by 2025 with a 5.99% CAGR. Discover key trends, drivers, and restraints shaping this industry, including the rise of electric vehicles and regional market analysis. Learn about leading companies and future growth forecasts.

                                                              July 2025
                                                              Base Year: 2024
                                                              No Of Pages: 234
                                                              Price: $4750

                                                              Exploring Opportunities in Naval Gas Turbine Market Sector

                                                              Discover the booming Naval Gas Turbine Market, projected to reach $X million by 2033 with a CAGR exceeding 7.80%. Explore market drivers, trends, restraints, key players (GE, Rolls Royce, Mitsubishi), and regional analysis (North America, Europe, Asia-Pacific). Get the insights you need to navigate this high-growth sector.

                                                              July 2025
                                                              Base Year: 2024
                                                              No Of Pages: 234
                                                              Price: $4750

                                                              Middle East Civil Aviation Flight Training and Simulation Market in Emerging Markets: Analysis and Projections 2025-2033

                                                              The Middle East Civil Aviation Flight Training & Simulation Market is booming, with a CAGR exceeding 15%! Discover key trends, drivers, restraints, and leading companies shaping this lucrative sector. Explore market size projections to 2033 and regional breakdowns for the UAE, Saudi Arabia, and more.

                                                              July 2025
                                                              Base Year: 2024
                                                              No Of Pages: 234
                                                              Price: $4750

                                                              Aircraft Winglets Market Market Expansion: Growth Outlook 2025-2033

                                                              The Aircraft Winglets Market is booming, projected to reach \$4.78 billion by 2033, with a CAGR of 7.90%. This report analyzes market drivers, trends, and key players like Aviation Partners Boeing and BLR Aerospace, offering insights into fuel-efficient aviation technologies.

                                                              July 2025
                                                              Base Year: 2024
                                                              No Of Pages: 234
                                                              Price: $4750

                                                              SATCOM Industry Market Expansion Strategies

                                                              The global SATCOM market is booming, with a projected 23.54% CAGR through 2033. Driven by IoT, cloud computing, and government initiatives, this report analyzes market size, segments (LEO, GEO, MEO, satellite mass), key players (SpaceX, Intelsat, Airbus), and regional trends. Discover the future of satellite communication!

                                                              July 2025
                                                              Base Year: 2024
                                                              No Of Pages: 197
                                                              Price: $3800