
Key Insights
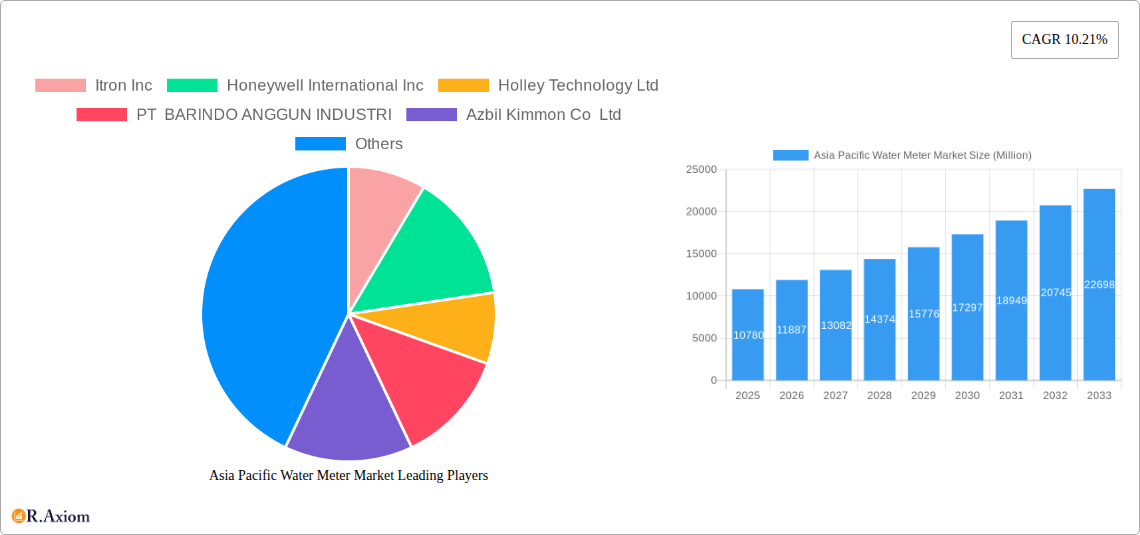
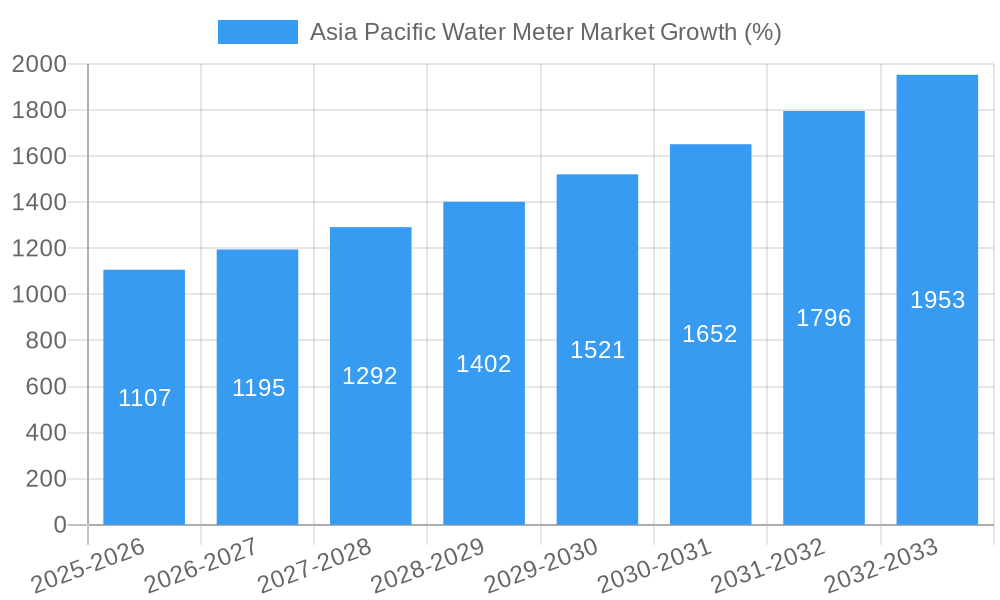
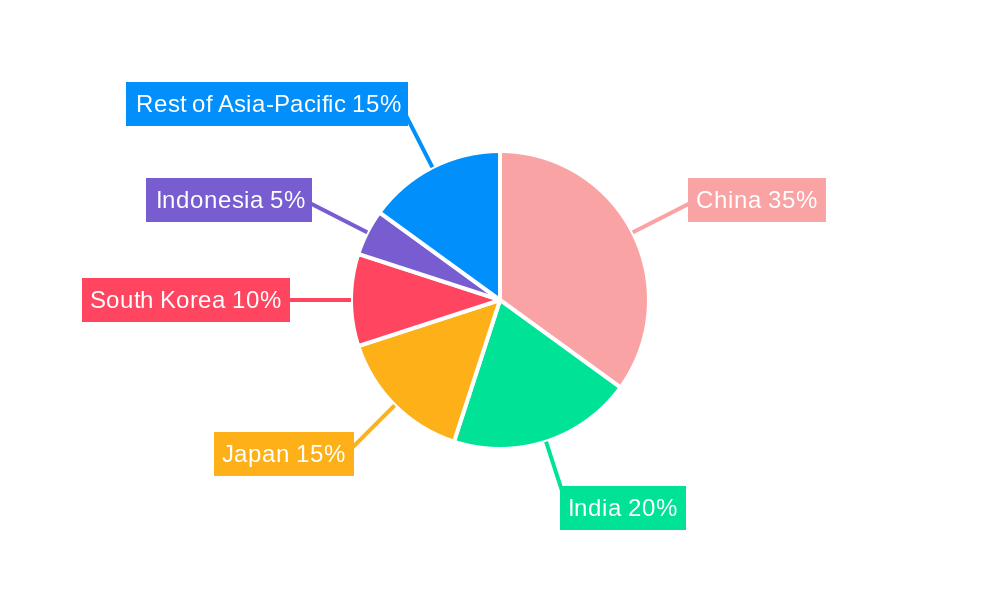
The Asia-Pacific water meter market, valued at $10.78 billion in 2025, is poised for robust growth, exhibiting a Compound Annual Growth Rate (CAGR) of 10.21% from 2025 to 2033. This expansion is driven by several key factors. Firstly, increasing urbanization and industrialization across the region necessitate efficient water management systems, boosting demand for accurate and reliable water meters. Secondly, governments in several Asia-Pacific countries are implementing stringent water conservation policies and upgrading aging water infrastructure, creating a significant market opportunity for smart water meter technology. This shift towards smart meters, offering functionalities like remote monitoring, leak detection, and automated billing, is a significant trend shaping market growth. Furthermore, rising concerns about water scarcity and the need for improved water resource management are further fueling adoption. Competition among major players like Itron Inc., Honeywell International Inc., and Holley Technology Ltd. is also driving innovation and price competitiveness within the market. China, India, and Japan are the leading markets within the region, but significant growth potential exists in rapidly developing economies like Indonesia and South Korea. Challenges such as high initial investment costs for smart meter deployment and infrastructural limitations in certain regions could potentially restrain market growth to some extent.
The market segmentation highlights the dominance of smart meters over basic meters, reflecting the ongoing technological advancement in water management. The industrial sector represents a key application area, due to higher water consumption compared to residential users. However, the water utilities sector is also experiencing considerable growth as companies prioritize enhancing their operational efficiency and reducing water loss. The continued focus on improving water infrastructure across the Asia-Pacific region, coupled with technological advancements in water metering and increasing government support for water conservation initiatives, ensures the long-term growth trajectory of this dynamic market. The forecast period of 2025-2033 presents considerable opportunities for both established players and new entrants, given the projected growth rate and diverse applications of water meters.
This in-depth report provides a comprehensive analysis of the Asia Pacific water meter market, offering invaluable insights for industry stakeholders, investors, and strategic decision-makers. Covering the period from 2019 to 2033, with a base year of 2025, this report meticulously examines market dynamics, growth drivers, challenges, and emerging opportunities. The report segments the market by country (China, India, Japan, South Korea, Indonesia, and Rest of Asia-Pacific), type (Basic Meters and Smart Meters), and application (Industrial and Water Utilities). Key players such as Itron Inc, Honeywell International Inc, and others are profiled, providing a clear picture of the competitive landscape. The report also includes detailed analysis of recent industry developments impacting market growth and future projections.
Asia Pacific Water Meter Market Concentration & Innovation
The Asia Pacific water meter market exhibits a moderately concentrated landscape, with a few major players holding significant market share. Itron Inc, Honeywell International Inc, and Holley Technology Ltd are among the leading companies, characterized by strong brand recognition, established distribution networks, and advanced technological capabilities. Market share data for 2024 suggests Itron holds approximately xx%, Honeywell xx%, and Holley xx%, while the remaining market share is distributed among regional players and smaller companies like PT BARINDO ANGGUN INDUSTRI, Azbil Kimmon Co Ltd, and others.
Innovation is a key driver, with smart water meter technology leading the charge. This is fueled by growing demand for efficient water management, improved data analytics, and reduced water loss. The regulatory landscape varies across countries, with some governments actively promoting smart meter adoption through subsidies and incentives, driving innovation and adoption rates. Product substitutes are minimal, mainly focusing on older, less efficient mechanical meters. However, the push for smart meters is slowly replacing these older technologies. End-user trends show a clear preference for smart meters due to their enhanced monitoring capabilities and reduced operational costs. M&A activity has been moderate, with deal values in the xx Million range in recent years, primarily focused on enhancing technological capabilities and expanding geographic reach.
Asia Pacific Water Meter Market Industry Trends & Insights
The Asia Pacific water meter market is experiencing robust growth, driven by factors such as increasing urbanization, rising water scarcity concerns, government initiatives to improve water infrastructure, and the growing adoption of smart technologies. The market is projected to witness a CAGR of xx% during the forecast period (2025-2033). Smart meter penetration is increasing significantly, driven by the desire for better water management and cost reduction. Consumer preference shifts towards advanced metering infrastructure (AMI) systems, which provide real-time data and remote monitoring capabilities. Technological advancements, such as the integration of IoT and AI, are further enhancing the capabilities of smart water meters. Competitive dynamics are characterized by intense competition among established players and the emergence of innovative startups, leading to product differentiation, price competition, and strategic partnerships. The market penetration of smart meters in the region is estimated at xx% in 2024, and projected to reach xx% by 2033.
Dominant Markets & Segments in Asia Pacific Water Meter Market
By Country: China dominates the Asia Pacific water meter market, driven by its large population, rapid urbanization, and significant investments in water infrastructure. India is another key market, with significant growth potential due to its expanding economy and increasing focus on water conservation. Japan and South Korea are mature markets with high smart meter adoption rates. Indonesia represents a rapidly developing market with increasing investments in water infrastructure.
By Type: Smart meters are experiencing the highest growth rate, driven by their advanced functionalities, which include remote monitoring, data analytics, and leak detection. However, basic meters still hold a considerable market share, especially in less developed regions.
By Application: The water utilities segment accounts for the largest share, driven by the increasing need for efficient water management and reduced non-revenue water. The industrial segment is also growing steadily, as industries increasingly adopt water metering for process optimization and cost control. Economic policies promoting infrastructure development, coupled with stringent regulations regarding water conservation, are key drivers for market growth in specific countries.
Asia Pacific Water Meter Market Product Developments
Recent product developments emphasize integration with advanced technologies like IoT, AI, and cloud computing. Smart water meters now offer improved data analytics, real-time monitoring, and remote control capabilities. This enhances water management efficiency, leak detection, and revenue optimization. These innovations cater to the growing demand for sophisticated water management systems and support sustainability initiatives. New products focus on improved accuracy, durability, and ease of installation, addressing key market requirements.
Report Scope & Segmentation Analysis
This report comprehensively segments the Asia Pacific water meter market by country (China, India, Japan, South Korea, Indonesia, Rest of Asia-Pacific), meter type (Basic Meters, Smart Meters), and application (Industrial, Water Utilities). Each segment's growth projections, market sizes, and competitive dynamics are analyzed in detail. For instance, the Smart Meters segment is expected to experience significant growth due to technological advancements and government support. The Water Utilities application segment dominates due to the vast scale of municipal water distribution networks and the need for efficient water management. Growth projections vary across countries, with faster growth expected in developing economies due to investments in water infrastructure.
Key Drivers of Asia Pacific Water Meter Market Growth
Several factors fuel the growth of the Asia Pacific water meter market:
- Increasing urbanization and population growth: Demand for efficient water management solutions is escalating.
- Rising water scarcity: Governments are investing in water infrastructure and conservation measures.
- Government initiatives and regulations: Policies promoting water conservation and smart city initiatives drive adoption.
- Technological advancements: Smart meter technology offers improved efficiency and data analytics.
Challenges in the Asia Pacific Water Meter Market Sector
The Asia Pacific water meter market faces challenges such as:
- High initial investment costs for smart meters: This can hinder adoption, particularly in developing regions.
- Lack of awareness and understanding of smart meter benefits: Education and outreach are crucial.
- Cybersecurity concerns: Data security is paramount in smart metering systems.
- Supply chain disruptions: Global events can impact the availability of components.
Emerging Opportunities in Asia Pacific Water Meter Market
Emerging opportunities include:
- Expansion into rural areas: Providing water metering solutions to underserved communities.
- Integration with other smart city technologies: Creating integrated water management systems.
- Development of advanced analytics tools: Extracting valuable insights from meter data.
- Focus on sustainable and environmentally friendly solutions: Meeting increasing sustainability goals.
Leading Players in the Asia Pacific Water Meter Market Market
- Itron Inc
- Honeywell International Inc
- Holley Technology Ltd
- PT BARINDO ANGGUN INDUSTRI
- Azbil Kimmon Co Ltd
- Arad Group
- Diehl Stiftung & Co KG
- ASMA Industrial Corporation
- Adept Fluidyne Pvt Ltd
- UPC Instruments Pvt Ltd
- Aichi Tokei Denki Co Ltd
Key Developments in Asia Pacific Water Meter Market Industry
November 2022: A Union Housing and Urban Affairs Ministry team proposed installing 2.8 lakh smart water meters in Aurangabad, Maharashtra, as part of a new water pipeline scheme. This signifies significant growth potential in the Indian smart water meter market.
May 2022: Semtech Corporation collaborated with Cranberry Analytics to integrate LoRaWAN technology into ultrasonic smart water meters, improving data transmission and cost efficiency. Panaji Municipal Corporation's adoption underscores the technology's growing market appeal.
March 2022: Wasa and Xiang Lahore Water Metering Company signed a contract to deploy 711,000 smart water meters in Lahore, Pakistan, highlighting the increasing adoption of smart meters in public-private partnerships.
Strategic Outlook for Asia Pacific Water Meter Market Market
The Asia Pacific water meter market holds substantial growth potential, driven by sustained urbanization, increasing water scarcity, and government investments in water infrastructure. The ongoing shift toward smart metering solutions, coupled with technological advancements and supportive regulatory frameworks, presents significant opportunities for market players. Focus on innovation, strategic partnerships, and expansion into underserved markets will be crucial for success in this dynamic landscape. The market's future is promising, with significant growth projected throughout the forecast period.
Asia Pacific Water Meter Market Segmentation
-
1. Type
- 1.1. Basic Meters
- 1.2. Smart Meters
-
2. Application
- 2.1. Industrial
- 2.2. Water Utilities
Asia Pacific Water Meter Market Segmentation By Geography
-
1. Asia Pacific
- 1.1. China
- 1.2. Japan
- 1.3. South Korea
- 1.4. India
- 1.5. Australia
- 1.6. New Zealand
- 1.7. Indonesia
- 1.8. Malaysia
- 1.9. Singapore
- 1.10. Thailand
- 1.11. Vietnam
- 1.12. Philippines
Asia Pacific Water Meter Market REPORT HIGHLIGHTS
| Aspects | Details |
|---|---|
| Study Period | 2019-2033 |
| Base Year | 2024 |
| Estimated Year | 2025 |
| Forecast Period | 2025-2033 |
| Historical Period | 2019-2024 |
| Growth Rate | CAGR of 10.21% from 2019-2033 |
| Segmentation |
|
Table of Contents
- 1. Introduction
- 1.1. Research Scope
- 1.2. Market Segmentation
- 1.3. Research Methodology
- 1.4. Definitions and Assumptions
- 2. Executive Summary
- 2.1. Introduction
- 3. Market Dynamics
- 3.1. Introduction
- 3.2. Market Drivers
- 3.2.1. Need for Improvement in Utility Usage and Efficiency; Growing Awareness on the Wastage of Water and Supportive Regulations
- 3.3. Market Restrains
- 3.3.1. Reluctance/Lack of Awareness to Use Self-Checkout Systems
- 3.4. Market Trends
- 3.4.1. Installation of Smart Meters to Grow Significantly
- 4. Market Factor Analysis
- 4.1. Porters Five Forces
- 4.2. Supply/Value Chain
- 4.3. PESTEL analysis
- 4.4. Market Entropy
- 4.5. Patent/Trademark Analysis
- 5. Asia Pacific Water Meter Market Analysis, Insights and Forecast, 2019-2031
- 5.1. Market Analysis, Insights and Forecast - by Type
- 5.1.1. Basic Meters
- 5.1.2. Smart Meters
- 5.2. Market Analysis, Insights and Forecast - by Application
- 5.2.1. Industrial
- 5.2.2. Water Utilities
- 5.3. Market Analysis, Insights and Forecast - by Region
- 5.3.1. Asia Pacific
- 5.1. Market Analysis, Insights and Forecast - by Type
- 6. China Asia Pacific Water Meter Market Analysis, Insights and Forecast, 2019-2031
- 7. Japan Asia Pacific Water Meter Market Analysis, Insights and Forecast, 2019-2031
- 8. India Asia Pacific Water Meter Market Analysis, Insights and Forecast, 2019-2031
- 9. South Korea Asia Pacific Water Meter Market Analysis, Insights and Forecast, 2019-2031
- 10. Taiwan Asia Pacific Water Meter Market Analysis, Insights and Forecast, 2019-2031
- 11. Australia Asia Pacific Water Meter Market Analysis, Insights and Forecast, 2019-2031
- 12. Rest of Asia-Pacific Asia Pacific Water Meter Market Analysis, Insights and Forecast, 2019-2031
- 13. Competitive Analysis
- 13.1. Market Share Analysis 2024
- 13.2. Company Profiles
- 13.2.1 Itron Inc
- 13.2.1.1. Overview
- 13.2.1.2. Products
- 13.2.1.3. SWOT Analysis
- 13.2.1.4. Recent Developments
- 13.2.1.5. Financials (Based on Availability)
- 13.2.2 Honeywell International Inc
- 13.2.2.1. Overview
- 13.2.2.2. Products
- 13.2.2.3. SWOT Analysis
- 13.2.2.4. Recent Developments
- 13.2.2.5. Financials (Based on Availability)
- 13.2.3 Holley Technology Ltd
- 13.2.3.1. Overview
- 13.2.3.2. Products
- 13.2.3.3. SWOT Analysis
- 13.2.3.4. Recent Developments
- 13.2.3.5. Financials (Based on Availability)
- 13.2.4 PT BARINDO ANGGUN INDUSTRI
- 13.2.4.1. Overview
- 13.2.4.2. Products
- 13.2.4.3. SWOT Analysis
- 13.2.4.4. Recent Developments
- 13.2.4.5. Financials (Based on Availability)
- 13.2.5 Azbil Kimmon Co Ltd
- 13.2.5.1. Overview
- 13.2.5.2. Products
- 13.2.5.3. SWOT Analysis
- 13.2.5.4. Recent Developments
- 13.2.5.5. Financials (Based on Availability)
- 13.2.6 Arad Group
- 13.2.6.1. Overview
- 13.2.6.2. Products
- 13.2.6.3. SWOT Analysis
- 13.2.6.4. Recent Developments
- 13.2.6.5. Financials (Based on Availability)
- 13.2.7 Diehl Stiftung & Co KG
- 13.2.7.1. Overview
- 13.2.7.2. Products
- 13.2.7.3. SWOT Analysis
- 13.2.7.4. Recent Developments
- 13.2.7.5. Financials (Based on Availability)
- 13.2.8 ASMA Industrial Corporation
- 13.2.8.1. Overview
- 13.2.8.2. Products
- 13.2.8.3. SWOT Analysis
- 13.2.8.4. Recent Developments
- 13.2.8.5. Financials (Based on Availability)
- 13.2.9 Adept Fluidyne Pvt Ltd
- 13.2.9.1. Overview
- 13.2.9.2. Products
- 13.2.9.3. SWOT Analysis
- 13.2.9.4. Recent Developments
- 13.2.9.5. Financials (Based on Availability)
- 13.2.10 UPC Instruments Pvt Ltd
- 13.2.10.1. Overview
- 13.2.10.2. Products
- 13.2.10.3. SWOT Analysis
- 13.2.10.4. Recent Developments
- 13.2.10.5. Financials (Based on Availability)
- 13.2.11 Aichi Tokei Denki Co Ltd
- 13.2.11.1. Overview
- 13.2.11.2. Products
- 13.2.11.3. SWOT Analysis
- 13.2.11.4. Recent Developments
- 13.2.11.5. Financials (Based on Availability)
- 13.2.1 Itron Inc
List of Figures
- Figure 1: Asia Pacific Water Meter Market Revenue Breakdown (Million, %) by Product 2024 & 2032
- Figure 2: Asia Pacific Water Meter Market Share (%) by Company 2024
List of Tables
- Table 1: Asia Pacific Water Meter Market Revenue Million Forecast, by Region 2019 & 2032
- Table 2: Asia Pacific Water Meter Market Volume K Unit Forecast, by Region 2019 & 2032
- Table 3: Asia Pacific Water Meter Market Revenue Million Forecast, by Type 2019 & 2032
- Table 4: Asia Pacific Water Meter Market Volume K Unit Forecast, by Type 2019 & 2032
- Table 5: Asia Pacific Water Meter Market Revenue Million Forecast, by Application 2019 & 2032
- Table 6: Asia Pacific Water Meter Market Volume K Unit Forecast, by Application 2019 & 2032
- Table 7: Asia Pacific Water Meter Market Revenue Million Forecast, by Region 2019 & 2032
- Table 8: Asia Pacific Water Meter Market Volume K Unit Forecast, by Region 2019 & 2032
- Table 9: Asia Pacific Water Meter Market Revenue Million Forecast, by Country 2019 & 2032
- Table 10: Asia Pacific Water Meter Market Volume K Unit Forecast, by Country 2019 & 2032
- Table 11: China Asia Pacific Water Meter Market Revenue (Million) Forecast, by Application 2019 & 2032
- Table 12: China Asia Pacific Water Meter Market Volume (K Unit) Forecast, by Application 2019 & 2032
- Table 13: Japan Asia Pacific Water Meter Market Revenue (Million) Forecast, by Application 2019 & 2032
- Table 14: Japan Asia Pacific Water Meter Market Volume (K Unit) Forecast, by Application 2019 & 2032
- Table 15: India Asia Pacific Water Meter Market Revenue (Million) Forecast, by Application 2019 & 2032
- Table 16: India Asia Pacific Water Meter Market Volume (K Unit) Forecast, by Application 2019 & 2032
- Table 17: South Korea Asia Pacific Water Meter Market Revenue (Million) Forecast, by Application 2019 & 2032
- Table 18: South Korea Asia Pacific Water Meter Market Volume (K Unit) Forecast, by Application 2019 & 2032
- Table 19: Taiwan Asia Pacific Water Meter Market Revenue (Million) Forecast, by Application 2019 & 2032
- Table 20: Taiwan Asia Pacific Water Meter Market Volume (K Unit) Forecast, by Application 2019 & 2032
- Table 21: Australia Asia Pacific Water Meter Market Revenue (Million) Forecast, by Application 2019 & 2032
- Table 22: Australia Asia Pacific Water Meter Market Volume (K Unit) Forecast, by Application 2019 & 2032
- Table 23: Rest of Asia-Pacific Asia Pacific Water Meter Market Revenue (Million) Forecast, by Application 2019 & 2032
- Table 24: Rest of Asia-Pacific Asia Pacific Water Meter Market Volume (K Unit) Forecast, by Application 2019 & 2032
- Table 25: Asia Pacific Water Meter Market Revenue Million Forecast, by Type 2019 & 2032
- Table 26: Asia Pacific Water Meter Market Volume K Unit Forecast, by Type 2019 & 2032
- Table 27: Asia Pacific Water Meter Market Revenue Million Forecast, by Application 2019 & 2032
- Table 28: Asia Pacific Water Meter Market Volume K Unit Forecast, by Application 2019 & 2032
- Table 29: Asia Pacific Water Meter Market Revenue Million Forecast, by Country 2019 & 2032
- Table 30: Asia Pacific Water Meter Market Volume K Unit Forecast, by Country 2019 & 2032
- Table 31: China Asia Pacific Water Meter Market Revenue (Million) Forecast, by Application 2019 & 2032
- Table 32: China Asia Pacific Water Meter Market Volume (K Unit) Forecast, by Application 2019 & 2032
- Table 33: Japan Asia Pacific Water Meter Market Revenue (Million) Forecast, by Application 2019 & 2032
- Table 34: Japan Asia Pacific Water Meter Market Volume (K Unit) Forecast, by Application 2019 & 2032
- Table 35: South Korea Asia Pacific Water Meter Market Revenue (Million) Forecast, by Application 2019 & 2032
- Table 36: South Korea Asia Pacific Water Meter Market Volume (K Unit) Forecast, by Application 2019 & 2032
- Table 37: India Asia Pacific Water Meter Market Revenue (Million) Forecast, by Application 2019 & 2032
- Table 38: India Asia Pacific Water Meter Market Volume (K Unit) Forecast, by Application 2019 & 2032
- Table 39: Australia Asia Pacific Water Meter Market Revenue (Million) Forecast, by Application 2019 & 2032
- Table 40: Australia Asia Pacific Water Meter Market Volume (K Unit) Forecast, by Application 2019 & 2032
- Table 41: New Zealand Asia Pacific Water Meter Market Revenue (Million) Forecast, by Application 2019 & 2032
- Table 42: New Zealand Asia Pacific Water Meter Market Volume (K Unit) Forecast, by Application 2019 & 2032
- Table 43: Indonesia Asia Pacific Water Meter Market Revenue (Million) Forecast, by Application 2019 & 2032
- Table 44: Indonesia Asia Pacific Water Meter Market Volume (K Unit) Forecast, by Application 2019 & 2032
- Table 45: Malaysia Asia Pacific Water Meter Market Revenue (Million) Forecast, by Application 2019 & 2032
- Table 46: Malaysia Asia Pacific Water Meter Market Volume (K Unit) Forecast, by Application 2019 & 2032
- Table 47: Singapore Asia Pacific Water Meter Market Revenue (Million) Forecast, by Application 2019 & 2032
- Table 48: Singapore Asia Pacific Water Meter Market Volume (K Unit) Forecast, by Application 2019 & 2032
- Table 49: Thailand Asia Pacific Water Meter Market Revenue (Million) Forecast, by Application 2019 & 2032
- Table 50: Thailand Asia Pacific Water Meter Market Volume (K Unit) Forecast, by Application 2019 & 2032
- Table 51: Vietnam Asia Pacific Water Meter Market Revenue (Million) Forecast, by Application 2019 & 2032
- Table 52: Vietnam Asia Pacific Water Meter Market Volume (K Unit) Forecast, by Application 2019 & 2032
- Table 53: Philippines Asia Pacific Water Meter Market Revenue (Million) Forecast, by Application 2019 & 2032
- Table 54: Philippines Asia Pacific Water Meter Market Volume (K Unit) Forecast, by Application 2019 & 2032
Frequently Asked Questions
1. What is the projected Compound Annual Growth Rate (CAGR) of the Asia Pacific Water Meter Market?
The projected CAGR is approximately 10.21%.
2. Which companies are prominent players in the Asia Pacific Water Meter Market?
Key companies in the market include Itron Inc, Honeywell International Inc, Holley Technology Ltd , PT BARINDO ANGGUN INDUSTRI, Azbil Kimmon Co Ltd, Arad Group, Diehl Stiftung & Co KG, ASMA Industrial Corporation, Adept Fluidyne Pvt Ltd, UPC Instruments Pvt Ltd, Aichi Tokei Denki Co Ltd.
3. What are the main segments of the Asia Pacific Water Meter Market?
The market segments include Type, Application.
4. Can you provide details about the market size?
The market size is estimated to be USD 10.78 Million as of 2022.
5. What are some drivers contributing to market growth?
Need for Improvement in Utility Usage and Efficiency; Growing Awareness on the Wastage of Water and Supportive Regulations.
6. What are the notable trends driving market growth?
Installation of Smart Meters to Grow Significantly.
7. Are there any restraints impacting market growth?
Reluctance/Lack of Awareness to Use Self-Checkout Systems.
8. Can you provide examples of recent developments in the market?
November 2022: A Union Housing and Urban Affairs Ministry team has suggested installing smart water meters as part of the under-construction water pipeline scheme in Maharashtra's Aurangabad city. The plan aims to install 2.8 lakh meters and provide 24-hour water to the city till 2052.
9. What pricing options are available for accessing the report?
Pricing options include single-user, multi-user, and enterprise licenses priced at USD 3800, USD 4500, and USD 5800 respectively.
10. Is the market size provided in terms of value or volume?
The market size is provided in terms of value, measured in Million and volume, measured in K Unit.
11. Are there any specific market keywords associated with the report?
Yes, the market keyword associated with the report is "Asia Pacific Water Meter Market," which aids in identifying and referencing the specific market segment covered.
12. How do I determine which pricing option suits my needs best?
The pricing options vary based on user requirements and access needs. Individual users may opt for single-user licenses, while businesses requiring broader access may choose multi-user or enterprise licenses for cost-effective access to the report.
13. Are there any additional resources or data provided in the Asia Pacific Water Meter Market report?
While the report offers comprehensive insights, it's advisable to review the specific contents or supplementary materials provided to ascertain if additional resources or data are available.
14. How can I stay updated on further developments or reports in the Asia Pacific Water Meter Market?
To stay informed about further developments, trends, and reports in the Asia Pacific Water Meter Market, consider subscribing to industry newsletters, following relevant companies and organizations, or regularly checking reputable industry news sources and publications.
Methodology
Step 1 - Identification of Relevant Samples Size from Population Database


Step 2 - Approaches for Defining Global Market Size (Value, Volume* & Price*)

Note*: In applicable scenarios
Step 3 - Data Sources
Primary Research
- Web Analytics
- Survey Reports
- Research Institute
- Latest Research Reports
- Opinion Leaders
Secondary Research
- Annual Reports
- White Paper
- Latest Press Release
- Industry Association
- Paid Database
- Investor Presentations

Step 4 - Data Triangulation
Involves using different sources of information in order to increase the validity of a study
These sources are likely to be stakeholders in a program - participants, other researchers, program staff, other community members, and so on.
Then we put all data in single framework & apply various statistical tools to find out the dynamic on the market.
During the analysis stage, feedback from the stakeholder groups would be compared to determine areas of agreement as well as areas of divergence


