
Key Insights
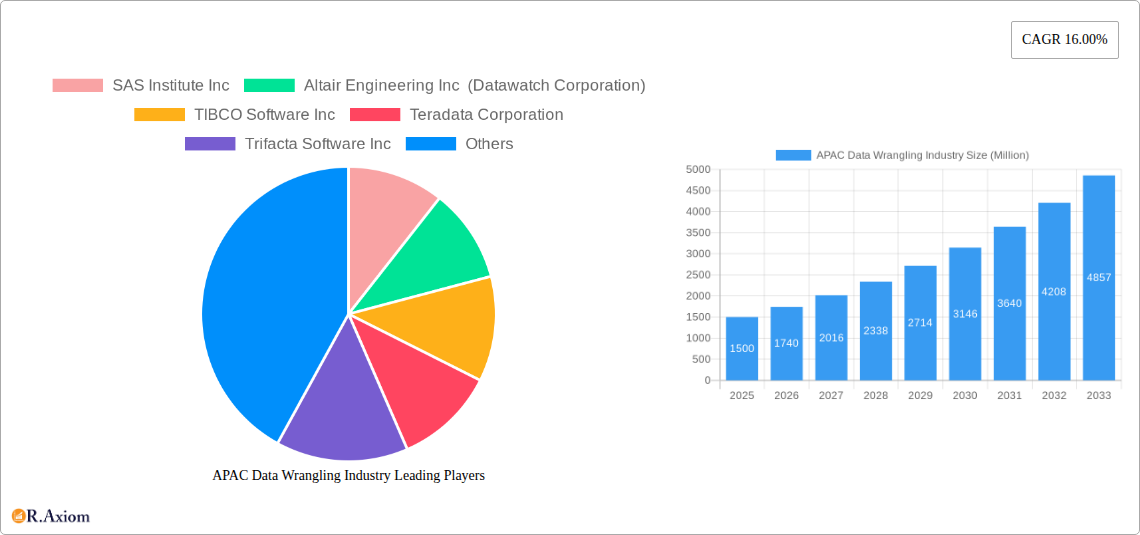
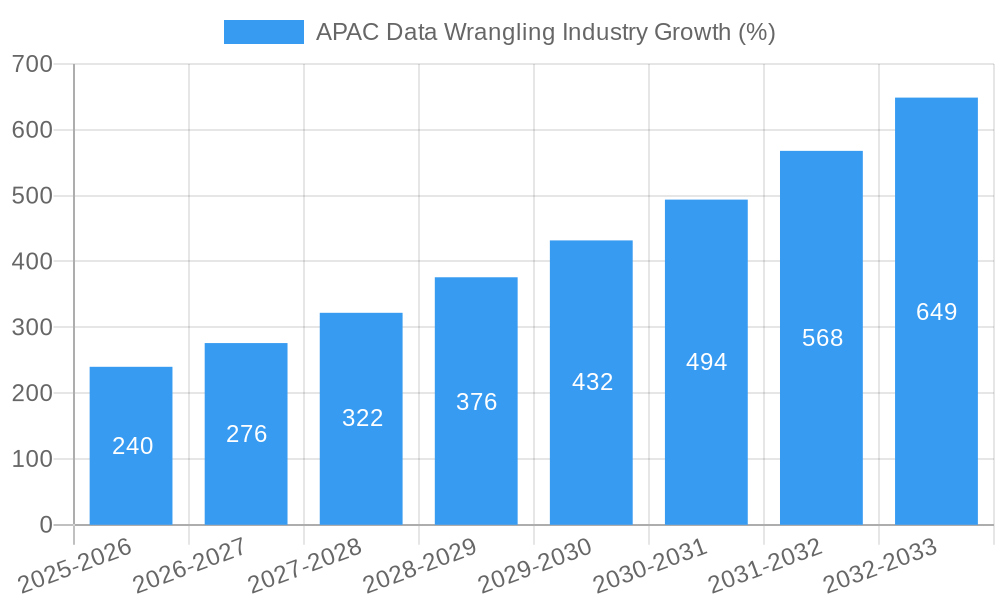
The Asia-Pacific (APAC) data wrangling market is experiencing robust growth, fueled by the increasing adoption of big data analytics and cloud computing across diverse industries. The region's burgeoning digital economy, coupled with a rising number of data-driven organizations, is creating significant demand for efficient data preparation solutions. A compound annual growth rate (CAGR) of 16% from 2019 to 2024 suggests a substantial market expansion, and this momentum is expected to continue into the forecast period (2025-2033). Key drivers include the growing need to improve data quality, reduce data processing time, and gain actionable insights from increasingly complex datasets. Furthermore, the rising adoption of cloud-based data wrangling tools offers scalability and cost-effectiveness, accelerating market penetration. While data security concerns and the lack of skilled professionals pose challenges, the overall market outlook remains positive.
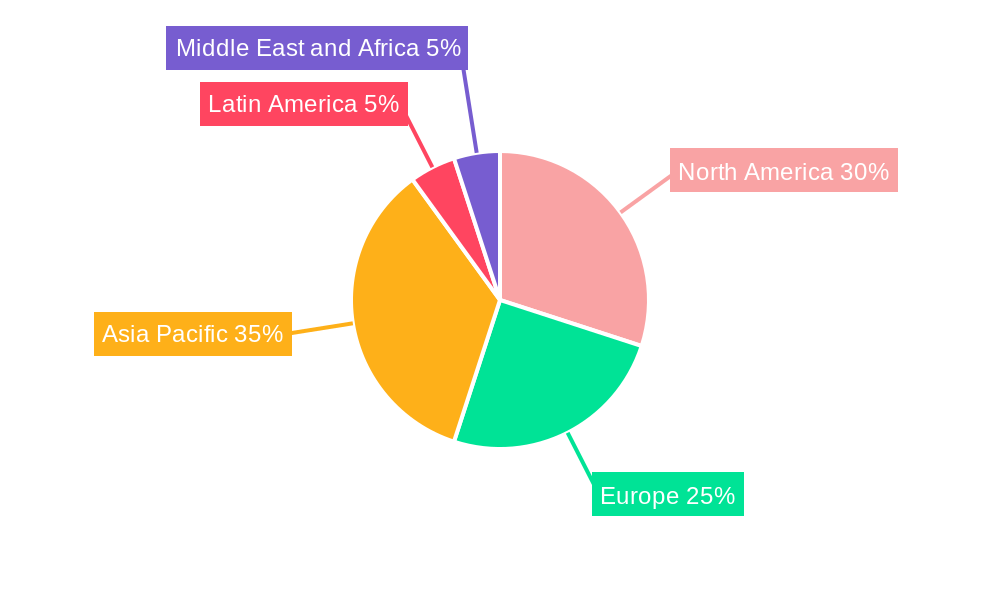
The APAC data wrangling market is segmented by deployment (on-premises and cloud), enterprise type (large and small/medium enterprises), end-user industry (IT & telecommunications, retail, government, BFSI, healthcare, and others), and component (tools and services). The cloud segment is anticipated to dominate due to its inherent flexibility and scalability. Large enterprises are the primary adopters of data wrangling solutions, followed by the rapidly growing SME segment. Industries like BFSI and healthcare are exhibiting particularly high growth rates owing to their rigorous data compliance needs and growing reliance on data-driven decision-making. China, Japan, and Australia are key markets within APAC, driving a significant share of the regional market value. However, other countries in the region are also witnessing increasing adoption, indicating a widespread expansion of data wrangling capabilities across APAC. Competition is intense, with both established players and emerging startups vying for market share. The ongoing development of advanced analytical tools and the integration of artificial intelligence (AI) and machine learning (ML) capabilities are set to further shape the market's trajectory.
APAC Data Wrangling Industry: 2019-2033 Market Analysis & Forecast
This comprehensive report provides an in-depth analysis of the Asia-Pacific (APAC) data wrangling industry, covering market size, growth drivers, challenges, and future opportunities from 2019 to 2033. The study incorporates detailed segmentation by deployment (on-premises, cloud), enterprise type (large, small and medium), end-user industry (IT & telecommunications, retail, government, BFSI, healthcare, others), country (China, Japan, Australia, Singapore, Rest of APAC), and component (tools, services). Key players like SAS Institute Inc, Altair Engineering Inc (Datawatch Corporation), TIBCO Software Inc, Teradata Corporation, Trifacta Software Inc, Paxata Inc, Alteryx Inc, Oracle Corporation, and Talend Inc are profiled, providing a 360-degree view of the competitive landscape. The base year is 2025, with estimates for 2025 and forecasts spanning 2025-2033. The historical period covered is 2019-2024.
APAC Data Wrangling Industry Market Concentration & Innovation
The APAC data wrangling market exhibits a moderately concentrated landscape, with the top five players holding approximately xx% of the market share in 2025. This concentration is driven by the significant investments these players have made in R&D, resulting in advanced data wrangling tools and services. Innovation in the sector is fueled by the increasing demand for big data analytics, the rise of cloud-based solutions, and the adoption of AI and machine learning technologies for automated data preparation. Regulatory frameworks, such as data privacy regulations (e.g., GDPR’s influence in certain APAC regions), are shaping product development and influencing market growth. Product substitutes, such as spreadsheet software with basic data cleaning capabilities, present a limited challenge. However, the increasing complexity of data and the need for efficient data integration are driving adoption of dedicated data wrangling solutions. End-user trends show a preference for cloud-based solutions due to scalability and cost-effectiveness. M&A activities have been moderate, with xx Million in deal value recorded between 2019 and 2024. Key deals have focused on enhancing capabilities in AI and cloud-based offerings.
- Market Share (Top 5 Players, 2025): xx%
- M&A Deal Value (2019-2024): xx Million
APAC Data Wrangling Industry Industry Trends & Insights
The APAC data wrangling market is experiencing robust growth, with a CAGR of xx% projected from 2025 to 2033. This growth is primarily driven by the increasing volume and variety of data generated across various sectors, coupled with the growing need for actionable insights. Technological disruptions, particularly the rise of cloud computing, AI, and machine learning, are transforming data wrangling processes, enabling faster and more accurate data preparation. Consumer preferences are shifting towards user-friendly, self-service data wrangling tools that require minimal coding expertise. Competitive dynamics are characterized by intense competition among established players and the emergence of innovative startups offering niche solutions. Market penetration of data wrangling solutions is xx% in 2025, expected to rise to xx% by 2033. The increasing adoption of big data analytics across various industries, particularly in BFSI and IT & Telecommunications, is a key market driver.
Dominant Markets & Segments in APAC Data Wrangling Industry
China represents the dominant market in APAC, driven by strong economic growth, increasing digitalization, and government initiatives promoting data-driven decision-making. The cloud deployment model is gaining significant traction, owing to its scalability, flexibility, and cost-effectiveness. Large enterprises are the primary consumers of data wrangling solutions, due to their greater need for sophisticated data management capabilities. The IT & telecommunication sector is a leading end-user industry, followed by the BFSI sector.
- Key Drivers for China's Dominance:
- Rapid economic growth fueling data generation.
- Government initiatives promoting digital transformation.
- Strong investments in IT infrastructure.
- Cloud Deployment Dominance:
- Scalability and cost-effectiveness.
- Ease of access and deployment.
- Increased adoption of SaaS models.
- Large Enterprise Dominance:
- Need for sophisticated data management.
- Higher budgets for technology investments.
- Greater data volumes requiring advanced tools.
APAC Data Wrangling Industry Product Developments
Recent product innovations focus on incorporating advanced analytics capabilities, such as AI-powered data cleansing and automated data transformation. Several vendors are integrating data wrangling tools into broader data analytics platforms, offering seamless workflows and improved efficiency. The key competitive advantage lies in the ease of use, scalability, and integration capabilities of the offerings. The market is moving towards self-service, user-friendly platforms to cater to a wider range of users. The trend towards automation and AI-driven solutions is expected to dominate future developments.
Report Scope & Segmentation Analysis
This report segments the APAC data wrangling market by deployment (on-premises and cloud), enterprise type (large and small and medium enterprises), end-user industry (IT & telecommunications, retail, government, BFSI, healthcare, and others), country (China, Japan, Australia, Singapore, and Rest of APAC), and component (tools and services). Each segment's growth projection, market size, and competitive dynamics are analyzed separately. The cloud deployment segment shows the highest growth, while large enterprises dominate market share. The IT & telecommunication sector is leading in adoption, while China represents the largest country market. The services segment shows a larger market size compared to the tools segment, though both are crucial components of the industry.
Key Drivers of APAC Data Wrangling Industry Growth
The APAC data wrangling market’s growth is driven by several factors: the exponential growth of data volume and variety, the rising demand for data-driven decision-making across various industries, the increasing adoption of cloud computing and big data analytics, and government initiatives promoting digital transformation in several APAC countries. Technological advancements such as AI and machine learning are further accelerating market growth.
Challenges in the APAC Data Wrangling Industry Sector
Challenges include the high cost of data wrangling solutions, particularly for SMEs, the lack of skilled professionals capable of effectively using these tools, and concerns surrounding data security and privacy, resulting in slower adoption in certain sectors. Data heterogeneity and the complexity involved in integrating data from diverse sources also pose a significant challenge.
Emerging Opportunities in APAC Data Wrangling Industry
Emerging opportunities include the increasing demand for AI-powered data wrangling solutions, the growth of the Internet of Things (IoT) generating massive datasets, and the need for improved data governance and compliance. The rising focus on data quality and data literacy programs creates opportunities for specialized services and training programs.
Leading Players in the APAC Data Wrangling Industry Market
- SAS Institute Inc
- Altair Engineering Inc (Datawatch Corporation)
- TIBCO Software Inc
- Teradata Corporation
- Trifacta Software Inc
- Paxata Inc
- Alteryx Inc
- Oracle Corporation
- Talend Inc
Key Developments in APAC Data Wrangling Industry Industry
- 2022 Q4: SAS Institute Inc launched a new cloud-based data wrangling platform.
- 2023 Q1: Alteryx Inc acquired a smaller data preparation startup, expanding its AI capabilities.
- 2023 Q3: New data privacy regulations implemented in Singapore impact data wrangling practices. (Further specific examples would be added here based on available data.)
Strategic Outlook for APAC Data Wrangling Industry Market
The APAC data wrangling market is poised for significant growth, driven by ongoing digital transformation, increasing data volumes, and the expanding adoption of advanced analytics. Opportunities exist for companies offering innovative, user-friendly, and AI-powered solutions. Focus on addressing data security and privacy concerns, coupled with investments in skilled workforce development, will be crucial for sustained market growth.
APAC Data Wrangling Industry Segmentation
-
1. Component
- 1.1. Tools
- 1.2. Services
-
2. Deployment
- 2.1. On-premises
- 2.2. Cloud
-
3. Enterprise Type
- 3.1. Large Enterprise
- 3.2. Small and Medium Enterprise
-
4. End-User Industry
- 4.1. IT and Telecommunication
- 4.2. Retail
- 4.3. Government
- 4.4. BFSI
- 4.5. Healthcare
- 4.6. Other End-user Industries
APAC Data Wrangling Industry Segmentation By Geography
-
1. North America
- 1.1. United States
- 1.2. Canada
- 1.3. Mexico
-
2. South America
- 2.1. Brazil
- 2.2. Argentina
- 2.3. Rest of South America
-
3. Europe
- 3.1. United Kingdom
- 3.2. Germany
- 3.3. France
- 3.4. Italy
- 3.5. Spain
- 3.6. Russia
- 3.7. Benelux
- 3.8. Nordics
- 3.9. Rest of Europe
-
4. Middle East & Africa
- 4.1. Turkey
- 4.2. Israel
- 4.3. GCC
- 4.4. North Africa
- 4.5. South Africa
- 4.6. Rest of Middle East & Africa
-
5. Asia Pacific
- 5.1. China
- 5.2. India
- 5.3. Japan
- 5.4. South Korea
- 5.5. ASEAN
- 5.6. Oceania
- 5.7. Rest of Asia Pacific
APAC Data Wrangling Industry REPORT HIGHLIGHTS
| Aspects | Details |
|---|---|
| Study Period | 2019-2033 |
| Base Year | 2024 |
| Estimated Year | 2025 |
| Forecast Period | 2025-2033 |
| Historical Period | 2019-2024 |
| Growth Rate | CAGR of 16.00% from 2019-2033 |
| Segmentation |
|
Table of Contents
- 1. Introduction
- 1.1. Research Scope
- 1.2. Market Segmentation
- 1.3. Research Methodology
- 1.4. Definitions and Assumptions
- 2. Executive Summary
- 2.1. Introduction
- 3. Market Dynamics
- 3.1. Introduction
- 3.2. Market Drivers
- 3.2.1 Increasing Automation Trends in the Manufacturing Sector; Increased penetration of digitalization
- 3.2.2 coupled with growing demand for improved efficiency and reduced operating costs; Growing applications of RPA and AI
- 3.3. Market Restrains
- 3.3.1. High initial cost of adoption; Lack of skilled personnel
- 3.4. Market Trends
- 3.4.1. Cloud is Expected to Witness Significant Growth
- 4. Market Factor Analysis
- 4.1. Porters Five Forces
- 4.2. Supply/Value Chain
- 4.3. PESTEL analysis
- 4.4. Market Entropy
- 4.5. Patent/Trademark Analysis
- 5. Global APAC Data Wrangling Industry Analysis, Insights and Forecast, 2019-2031
- 5.1. Market Analysis, Insights and Forecast - by Component
- 5.1.1. Tools
- 5.1.2. Services
- 5.2. Market Analysis, Insights and Forecast - by Deployment
- 5.2.1. On-premises
- 5.2.2. Cloud
- 5.3. Market Analysis, Insights and Forecast - by Enterprise Type
- 5.3.1. Large Enterprise
- 5.3.2. Small and Medium Enterprise
- 5.4. Market Analysis, Insights and Forecast - by End-User Industry
- 5.4.1. IT and Telecommunication
- 5.4.2. Retail
- 5.4.3. Government
- 5.4.4. BFSI
- 5.4.5. Healthcare
- 5.4.6. Other End-user Industries
- 5.5. Market Analysis, Insights and Forecast - by Region
- 5.5.1. North America
- 5.5.2. South America
- 5.5.3. Europe
- 5.5.4. Middle East & Africa
- 5.5.5. Asia Pacific
- 5.1. Market Analysis, Insights and Forecast - by Component
- 6. North America APAC Data Wrangling Industry Analysis, Insights and Forecast, 2019-2031
- 6.1. Market Analysis, Insights and Forecast - by Component
- 6.1.1. Tools
- 6.1.2. Services
- 6.2. Market Analysis, Insights and Forecast - by Deployment
- 6.2.1. On-premises
- 6.2.2. Cloud
- 6.3. Market Analysis, Insights and Forecast - by Enterprise Type
- 6.3.1. Large Enterprise
- 6.3.2. Small and Medium Enterprise
- 6.4. Market Analysis, Insights and Forecast - by End-User Industry
- 6.4.1. IT and Telecommunication
- 6.4.2. Retail
- 6.4.3. Government
- 6.4.4. BFSI
- 6.4.5. Healthcare
- 6.4.6. Other End-user Industries
- 6.1. Market Analysis, Insights and Forecast - by Component
- 7. South America APAC Data Wrangling Industry Analysis, Insights and Forecast, 2019-2031
- 7.1. Market Analysis, Insights and Forecast - by Component
- 7.1.1. Tools
- 7.1.2. Services
- 7.2. Market Analysis, Insights and Forecast - by Deployment
- 7.2.1. On-premises
- 7.2.2. Cloud
- 7.3. Market Analysis, Insights and Forecast - by Enterprise Type
- 7.3.1. Large Enterprise
- 7.3.2. Small and Medium Enterprise
- 7.4. Market Analysis, Insights and Forecast - by End-User Industry
- 7.4.1. IT and Telecommunication
- 7.4.2. Retail
- 7.4.3. Government
- 7.4.4. BFSI
- 7.4.5. Healthcare
- 7.4.6. Other End-user Industries
- 7.1. Market Analysis, Insights and Forecast - by Component
- 8. Europe APAC Data Wrangling Industry Analysis, Insights and Forecast, 2019-2031
- 8.1. Market Analysis, Insights and Forecast - by Component
- 8.1.1. Tools
- 8.1.2. Services
- 8.2. Market Analysis, Insights and Forecast - by Deployment
- 8.2.1. On-premises
- 8.2.2. Cloud
- 8.3. Market Analysis, Insights and Forecast - by Enterprise Type
- 8.3.1. Large Enterprise
- 8.3.2. Small and Medium Enterprise
- 8.4. Market Analysis, Insights and Forecast - by End-User Industry
- 8.4.1. IT and Telecommunication
- 8.4.2. Retail
- 8.4.3. Government
- 8.4.4. BFSI
- 8.4.5. Healthcare
- 8.4.6. Other End-user Industries
- 8.1. Market Analysis, Insights and Forecast - by Component
- 9. Middle East & Africa APAC Data Wrangling Industry Analysis, Insights and Forecast, 2019-2031
- 9.1. Market Analysis, Insights and Forecast - by Component
- 9.1.1. Tools
- 9.1.2. Services
- 9.2. Market Analysis, Insights and Forecast - by Deployment
- 9.2.1. On-premises
- 9.2.2. Cloud
- 9.3. Market Analysis, Insights and Forecast - by Enterprise Type
- 9.3.1. Large Enterprise
- 9.3.2. Small and Medium Enterprise
- 9.4. Market Analysis, Insights and Forecast - by End-User Industry
- 9.4.1. IT and Telecommunication
- 9.4.2. Retail
- 9.4.3. Government
- 9.4.4. BFSI
- 9.4.5. Healthcare
- 9.4.6. Other End-user Industries
- 9.1. Market Analysis, Insights and Forecast - by Component
- 10. Asia Pacific APAC Data Wrangling Industry Analysis, Insights and Forecast, 2019-2031
- 10.1. Market Analysis, Insights and Forecast - by Component
- 10.1.1. Tools
- 10.1.2. Services
- 10.2. Market Analysis, Insights and Forecast - by Deployment
- 10.2.1. On-premises
- 10.2.2. Cloud
- 10.3. Market Analysis, Insights and Forecast - by Enterprise Type
- 10.3.1. Large Enterprise
- 10.3.2. Small and Medium Enterprise
- 10.4. Market Analysis, Insights and Forecast - by End-User Industry
- 10.4.1. IT and Telecommunication
- 10.4.2. Retail
- 10.4.3. Government
- 10.4.4. BFSI
- 10.4.5. Healthcare
- 10.4.6. Other End-user Industries
- 10.1. Market Analysis, Insights and Forecast - by Component
- 11. North America APAC Data Wrangling Industry Analysis, Insights and Forecast, 2019-2031
- 11.1. Market Analysis, Insights and Forecast - By Country/Sub-region
- 11.1.1.
- 12. Asia Pacific APAC Data Wrangling Industry Analysis, Insights and Forecast, 2019-2031
- 12.1. Market Analysis, Insights and Forecast - By Country/Sub-region
- 12.1.1.
- 13. Europe APAC Data Wrangling Industry Analysis, Insights and Forecast, 2019-2031
- 13.1. Market Analysis, Insights and Forecast - By Country/Sub-region
- 13.1.1.
- 14. Latin America APAC Data Wrangling Industry Analysis, Insights and Forecast, 2019-2031
- 14.1. Market Analysis, Insights and Forecast - By Country/Sub-region
- 14.1.1.
- 15. Middle East and Africa APAC Data Wrangling Industry Analysis, Insights and Forecast, 2019-2031
- 15.1. Market Analysis, Insights and Forecast - By Country/Sub-region
- 15.1.1.
- 16. Competitive Analysis
- 16.1. Global Market Share Analysis 2024
- 16.2. Company Profiles
- 16.2.1 SAS Institute Inc
- 16.2.1.1. Overview
- 16.2.1.2. Products
- 16.2.1.3. SWOT Analysis
- 16.2.1.4. Recent Developments
- 16.2.1.5. Financials (Based on Availability)
- 16.2.2 Altair Engineering Inc (Datawatch Corporation)
- 16.2.2.1. Overview
- 16.2.2.2. Products
- 16.2.2.3. SWOT Analysis
- 16.2.2.4. Recent Developments
- 16.2.2.5. Financials (Based on Availability)
- 16.2.3 TIBCO Software Inc
- 16.2.3.1. Overview
- 16.2.3.2. Products
- 16.2.3.3. SWOT Analysis
- 16.2.3.4. Recent Developments
- 16.2.3.5. Financials (Based on Availability)
- 16.2.4 Teradata Corporation
- 16.2.4.1. Overview
- 16.2.4.2. Products
- 16.2.4.3. SWOT Analysis
- 16.2.4.4. Recent Developments
- 16.2.4.5. Financials (Based on Availability)
- 16.2.5 Trifacta Software Inc
- 16.2.5.1. Overview
- 16.2.5.2. Products
- 16.2.5.3. SWOT Analysis
- 16.2.5.4. Recent Developments
- 16.2.5.5. Financials (Based on Availability)
- 16.2.6 Paxata Inc
- 16.2.6.1. Overview
- 16.2.6.2. Products
- 16.2.6.3. SWOT Analysis
- 16.2.6.4. Recent Developments
- 16.2.6.5. Financials (Based on Availability)
- 16.2.7 Alteryx Inc
- 16.2.7.1. Overview
- 16.2.7.2. Products
- 16.2.7.3. SWOT Analysis
- 16.2.7.4. Recent Developments
- 16.2.7.5. Financials (Based on Availability)
- 16.2.8 Oracle Corporation
- 16.2.8.1. Overview
- 16.2.8.2. Products
- 16.2.8.3. SWOT Analysis
- 16.2.8.4. Recent Developments
- 16.2.8.5. Financials (Based on Availability)
- 16.2.9 Talend Inc
- 16.2.9.1. Overview
- 16.2.9.2. Products
- 16.2.9.3. SWOT Analysis
- 16.2.9.4. Recent Developments
- 16.2.9.5. Financials (Based on Availability)
- 16.2.1 SAS Institute Inc
List of Figures
- Figure 1: Global APAC Data Wrangling Industry Revenue Breakdown (Million, %) by Region 2024 & 2032
- Figure 2: Global APAC Data Wrangling Industry Volume Breakdown (K Unit, %) by Region 2024 & 2032
- Figure 3: North America APAC Data Wrangling Industry Revenue (Million), by Country 2024 & 2032
- Figure 4: North America APAC Data Wrangling Industry Volume (K Unit), by Country 2024 & 2032
- Figure 5: North America APAC Data Wrangling Industry Revenue Share (%), by Country 2024 & 2032
- Figure 6: North America APAC Data Wrangling Industry Volume Share (%), by Country 2024 & 2032
- Figure 7: Asia Pacific APAC Data Wrangling Industry Revenue (Million), by Country 2024 & 2032
- Figure 8: Asia Pacific APAC Data Wrangling Industry Volume (K Unit), by Country 2024 & 2032
- Figure 9: Asia Pacific APAC Data Wrangling Industry Revenue Share (%), by Country 2024 & 2032
- Figure 10: Asia Pacific APAC Data Wrangling Industry Volume Share (%), by Country 2024 & 2032
- Figure 11: Europe APAC Data Wrangling Industry Revenue (Million), by Country 2024 & 2032
- Figure 12: Europe APAC Data Wrangling Industry Volume (K Unit), by Country 2024 & 2032
- Figure 13: Europe APAC Data Wrangling Industry Revenue Share (%), by Country 2024 & 2032
- Figure 14: Europe APAC Data Wrangling Industry Volume Share (%), by Country 2024 & 2032
- Figure 15: Latin America APAC Data Wrangling Industry Revenue (Million), by Country 2024 & 2032
- Figure 16: Latin America APAC Data Wrangling Industry Volume (K Unit), by Country 2024 & 2032
- Figure 17: Latin America APAC Data Wrangling Industry Revenue Share (%), by Country 2024 & 2032
- Figure 18: Latin America APAC Data Wrangling Industry Volume Share (%), by Country 2024 & 2032
- Figure 19: Middle East and Africa APAC Data Wrangling Industry Revenue (Million), by Country 2024 & 2032
- Figure 20: Middle East and Africa APAC Data Wrangling Industry Volume (K Unit), by Country 2024 & 2032
- Figure 21: Middle East and Africa APAC Data Wrangling Industry Revenue Share (%), by Country 2024 & 2032
- Figure 22: Middle East and Africa APAC Data Wrangling Industry Volume Share (%), by Country 2024 & 2032
- Figure 23: North America APAC Data Wrangling Industry Revenue (Million), by Component 2024 & 2032
- Figure 24: North America APAC Data Wrangling Industry Volume (K Unit), by Component 2024 & 2032
- Figure 25: North America APAC Data Wrangling Industry Revenue Share (%), by Component 2024 & 2032
- Figure 26: North America APAC Data Wrangling Industry Volume Share (%), by Component 2024 & 2032
- Figure 27: North America APAC Data Wrangling Industry Revenue (Million), by Deployment 2024 & 2032
- Figure 28: North America APAC Data Wrangling Industry Volume (K Unit), by Deployment 2024 & 2032
- Figure 29: North America APAC Data Wrangling Industry Revenue Share (%), by Deployment 2024 & 2032
- Figure 30: North America APAC Data Wrangling Industry Volume Share (%), by Deployment 2024 & 2032
- Figure 31: North America APAC Data Wrangling Industry Revenue (Million), by Enterprise Type 2024 & 2032
- Figure 32: North America APAC Data Wrangling Industry Volume (K Unit), by Enterprise Type 2024 & 2032
- Figure 33: North America APAC Data Wrangling Industry Revenue Share (%), by Enterprise Type 2024 & 2032
- Figure 34: North America APAC Data Wrangling Industry Volume Share (%), by Enterprise Type 2024 & 2032
- Figure 35: North America APAC Data Wrangling Industry Revenue (Million), by End-User Industry 2024 & 2032
- Figure 36: North America APAC Data Wrangling Industry Volume (K Unit), by End-User Industry 2024 & 2032
- Figure 37: North America APAC Data Wrangling Industry Revenue Share (%), by End-User Industry 2024 & 2032
- Figure 38: North America APAC Data Wrangling Industry Volume Share (%), by End-User Industry 2024 & 2032
- Figure 39: North America APAC Data Wrangling Industry Revenue (Million), by Country 2024 & 2032
- Figure 40: North America APAC Data Wrangling Industry Volume (K Unit), by Country 2024 & 2032
- Figure 41: North America APAC Data Wrangling Industry Revenue Share (%), by Country 2024 & 2032
- Figure 42: North America APAC Data Wrangling Industry Volume Share (%), by Country 2024 & 2032
- Figure 43: South America APAC Data Wrangling Industry Revenue (Million), by Component 2024 & 2032
- Figure 44: South America APAC Data Wrangling Industry Volume (K Unit), by Component 2024 & 2032
- Figure 45: South America APAC Data Wrangling Industry Revenue Share (%), by Component 2024 & 2032
- Figure 46: South America APAC Data Wrangling Industry Volume Share (%), by Component 2024 & 2032
- Figure 47: South America APAC Data Wrangling Industry Revenue (Million), by Deployment 2024 & 2032
- Figure 48: South America APAC Data Wrangling Industry Volume (K Unit), by Deployment 2024 & 2032
- Figure 49: South America APAC Data Wrangling Industry Revenue Share (%), by Deployment 2024 & 2032
- Figure 50: South America APAC Data Wrangling Industry Volume Share (%), by Deployment 2024 & 2032
- Figure 51: South America APAC Data Wrangling Industry Revenue (Million), by Enterprise Type 2024 & 2032
- Figure 52: South America APAC Data Wrangling Industry Volume (K Unit), by Enterprise Type 2024 & 2032
- Figure 53: South America APAC Data Wrangling Industry Revenue Share (%), by Enterprise Type 2024 & 2032
- Figure 54: South America APAC Data Wrangling Industry Volume Share (%), by Enterprise Type 2024 & 2032
- Figure 55: South America APAC Data Wrangling Industry Revenue (Million), by End-User Industry 2024 & 2032
- Figure 56: South America APAC Data Wrangling Industry Volume (K Unit), by End-User Industry 2024 & 2032
- Figure 57: South America APAC Data Wrangling Industry Revenue Share (%), by End-User Industry 2024 & 2032
- Figure 58: South America APAC Data Wrangling Industry Volume Share (%), by End-User Industry 2024 & 2032
- Figure 59: South America APAC Data Wrangling Industry Revenue (Million), by Country 2024 & 2032
- Figure 60: South America APAC Data Wrangling Industry Volume (K Unit), by Country 2024 & 2032
- Figure 61: South America APAC Data Wrangling Industry Revenue Share (%), by Country 2024 & 2032
- Figure 62: South America APAC Data Wrangling Industry Volume Share (%), by Country 2024 & 2032
- Figure 63: Europe APAC Data Wrangling Industry Revenue (Million), by Component 2024 & 2032
- Figure 64: Europe APAC Data Wrangling Industry Volume (K Unit), by Component 2024 & 2032
- Figure 65: Europe APAC Data Wrangling Industry Revenue Share (%), by Component 2024 & 2032
- Figure 66: Europe APAC Data Wrangling Industry Volume Share (%), by Component 2024 & 2032
- Figure 67: Europe APAC Data Wrangling Industry Revenue (Million), by Deployment 2024 & 2032
- Figure 68: Europe APAC Data Wrangling Industry Volume (K Unit), by Deployment 2024 & 2032
- Figure 69: Europe APAC Data Wrangling Industry Revenue Share (%), by Deployment 2024 & 2032
- Figure 70: Europe APAC Data Wrangling Industry Volume Share (%), by Deployment 2024 & 2032
- Figure 71: Europe APAC Data Wrangling Industry Revenue (Million), by Enterprise Type 2024 & 2032
- Figure 72: Europe APAC Data Wrangling Industry Volume (K Unit), by Enterprise Type 2024 & 2032
- Figure 73: Europe APAC Data Wrangling Industry Revenue Share (%), by Enterprise Type 2024 & 2032
- Figure 74: Europe APAC Data Wrangling Industry Volume Share (%), by Enterprise Type 2024 & 2032
- Figure 75: Europe APAC Data Wrangling Industry Revenue (Million), by End-User Industry 2024 & 2032
- Figure 76: Europe APAC Data Wrangling Industry Volume (K Unit), by End-User Industry 2024 & 2032
- Figure 77: Europe APAC Data Wrangling Industry Revenue Share (%), by End-User Industry 2024 & 2032
- Figure 78: Europe APAC Data Wrangling Industry Volume Share (%), by End-User Industry 2024 & 2032
- Figure 79: Europe APAC Data Wrangling Industry Revenue (Million), by Country 2024 & 2032
- Figure 80: Europe APAC Data Wrangling Industry Volume (K Unit), by Country 2024 & 2032
- Figure 81: Europe APAC Data Wrangling Industry Revenue Share (%), by Country 2024 & 2032
- Figure 82: Europe APAC Data Wrangling Industry Volume Share (%), by Country 2024 & 2032
- Figure 83: Middle East & Africa APAC Data Wrangling Industry Revenue (Million), by Component 2024 & 2032
- Figure 84: Middle East & Africa APAC Data Wrangling Industry Volume (K Unit), by Component 2024 & 2032
- Figure 85: Middle East & Africa APAC Data Wrangling Industry Revenue Share (%), by Component 2024 & 2032
- Figure 86: Middle East & Africa APAC Data Wrangling Industry Volume Share (%), by Component 2024 & 2032
- Figure 87: Middle East & Africa APAC Data Wrangling Industry Revenue (Million), by Deployment 2024 & 2032
- Figure 88: Middle East & Africa APAC Data Wrangling Industry Volume (K Unit), by Deployment 2024 & 2032
- Figure 89: Middle East & Africa APAC Data Wrangling Industry Revenue Share (%), by Deployment 2024 & 2032
- Figure 90: Middle East & Africa APAC Data Wrangling Industry Volume Share (%), by Deployment 2024 & 2032
- Figure 91: Middle East & Africa APAC Data Wrangling Industry Revenue (Million), by Enterprise Type 2024 & 2032
- Figure 92: Middle East & Africa APAC Data Wrangling Industry Volume (K Unit), by Enterprise Type 2024 & 2032
- Figure 93: Middle East & Africa APAC Data Wrangling Industry Revenue Share (%), by Enterprise Type 2024 & 2032
- Figure 94: Middle East & Africa APAC Data Wrangling Industry Volume Share (%), by Enterprise Type 2024 & 2032
- Figure 95: Middle East & Africa APAC Data Wrangling Industry Revenue (Million), by End-User Industry 2024 & 2032
- Figure 96: Middle East & Africa APAC Data Wrangling Industry Volume (K Unit), by End-User Industry 2024 & 2032
- Figure 97: Middle East & Africa APAC Data Wrangling Industry Revenue Share (%), by End-User Industry 2024 & 2032
- Figure 98: Middle East & Africa APAC Data Wrangling Industry Volume Share (%), by End-User Industry 2024 & 2032
- Figure 99: Middle East & Africa APAC Data Wrangling Industry Revenue (Million), by Country 2024 & 2032
- Figure 100: Middle East & Africa APAC Data Wrangling Industry Volume (K Unit), by Country 2024 & 2032
- Figure 101: Middle East & Africa APAC Data Wrangling Industry Revenue Share (%), by Country 2024 & 2032
- Figure 102: Middle East & Africa APAC Data Wrangling Industry Volume Share (%), by Country 2024 & 2032
- Figure 103: Asia Pacific APAC Data Wrangling Industry Revenue (Million), by Component 2024 & 2032
- Figure 104: Asia Pacific APAC Data Wrangling Industry Volume (K Unit), by Component 2024 & 2032
- Figure 105: Asia Pacific APAC Data Wrangling Industry Revenue Share (%), by Component 2024 & 2032
- Figure 106: Asia Pacific APAC Data Wrangling Industry Volume Share (%), by Component 2024 & 2032
- Figure 107: Asia Pacific APAC Data Wrangling Industry Revenue (Million), by Deployment 2024 & 2032
- Figure 108: Asia Pacific APAC Data Wrangling Industry Volume (K Unit), by Deployment 2024 & 2032
- Figure 109: Asia Pacific APAC Data Wrangling Industry Revenue Share (%), by Deployment 2024 & 2032
- Figure 110: Asia Pacific APAC Data Wrangling Industry Volume Share (%), by Deployment 2024 & 2032
- Figure 111: Asia Pacific APAC Data Wrangling Industry Revenue (Million), by Enterprise Type 2024 & 2032
- Figure 112: Asia Pacific APAC Data Wrangling Industry Volume (K Unit), by Enterprise Type 2024 & 2032
- Figure 113: Asia Pacific APAC Data Wrangling Industry Revenue Share (%), by Enterprise Type 2024 & 2032
- Figure 114: Asia Pacific APAC Data Wrangling Industry Volume Share (%), by Enterprise Type 2024 & 2032
- Figure 115: Asia Pacific APAC Data Wrangling Industry Revenue (Million), by End-User Industry 2024 & 2032
- Figure 116: Asia Pacific APAC Data Wrangling Industry Volume (K Unit), by End-User Industry 2024 & 2032
- Figure 117: Asia Pacific APAC Data Wrangling Industry Revenue Share (%), by End-User Industry 2024 & 2032
- Figure 118: Asia Pacific APAC Data Wrangling Industry Volume Share (%), by End-User Industry 2024 & 2032
- Figure 119: Asia Pacific APAC Data Wrangling Industry Revenue (Million), by Country 2024 & 2032
- Figure 120: Asia Pacific APAC Data Wrangling Industry Volume (K Unit), by Country 2024 & 2032
- Figure 121: Asia Pacific APAC Data Wrangling Industry Revenue Share (%), by Country 2024 & 2032
- Figure 122: Asia Pacific APAC Data Wrangling Industry Volume Share (%), by Country 2024 & 2032
List of Tables
- Table 1: Global APAC Data Wrangling Industry Revenue Million Forecast, by Region 2019 & 2032
- Table 2: Global APAC Data Wrangling Industry Volume K Unit Forecast, by Region 2019 & 2032
- Table 3: Global APAC Data Wrangling Industry Revenue Million Forecast, by Component 2019 & 2032
- Table 4: Global APAC Data Wrangling Industry Volume K Unit Forecast, by Component 2019 & 2032
- Table 5: Global APAC Data Wrangling Industry Revenue Million Forecast, by Deployment 2019 & 2032
- Table 6: Global APAC Data Wrangling Industry Volume K Unit Forecast, by Deployment 2019 & 2032
- Table 7: Global APAC Data Wrangling Industry Revenue Million Forecast, by Enterprise Type 2019 & 2032
- Table 8: Global APAC Data Wrangling Industry Volume K Unit Forecast, by Enterprise Type 2019 & 2032
- Table 9: Global APAC Data Wrangling Industry Revenue Million Forecast, by End-User Industry 2019 & 2032
- Table 10: Global APAC Data Wrangling Industry Volume K Unit Forecast, by End-User Industry 2019 & 2032
- Table 11: Global APAC Data Wrangling Industry Revenue Million Forecast, by Region 2019 & 2032
- Table 12: Global APAC Data Wrangling Industry Volume K Unit Forecast, by Region 2019 & 2032
- Table 13: Global APAC Data Wrangling Industry Revenue Million Forecast, by Country 2019 & 2032
- Table 14: Global APAC Data Wrangling Industry Volume K Unit Forecast, by Country 2019 & 2032
- Table 15: APAC Data Wrangling Industry Revenue (Million) Forecast, by Application 2019 & 2032
- Table 16: APAC Data Wrangling Industry Volume (K Unit) Forecast, by Application 2019 & 2032
- Table 17: Global APAC Data Wrangling Industry Revenue Million Forecast, by Country 2019 & 2032
- Table 18: Global APAC Data Wrangling Industry Volume K Unit Forecast, by Country 2019 & 2032
- Table 19: APAC Data Wrangling Industry Revenue (Million) Forecast, by Application 2019 & 2032
- Table 20: APAC Data Wrangling Industry Volume (K Unit) Forecast, by Application 2019 & 2032
- Table 21: Global APAC Data Wrangling Industry Revenue Million Forecast, by Country 2019 & 2032
- Table 22: Global APAC Data Wrangling Industry Volume K Unit Forecast, by Country 2019 & 2032
- Table 23: APAC Data Wrangling Industry Revenue (Million) Forecast, by Application 2019 & 2032
- Table 24: APAC Data Wrangling Industry Volume (K Unit) Forecast, by Application 2019 & 2032
- Table 25: Global APAC Data Wrangling Industry Revenue Million Forecast, by Country 2019 & 2032
- Table 26: Global APAC Data Wrangling Industry Volume K Unit Forecast, by Country 2019 & 2032
- Table 27: APAC Data Wrangling Industry Revenue (Million) Forecast, by Application 2019 & 2032
- Table 28: APAC Data Wrangling Industry Volume (K Unit) Forecast, by Application 2019 & 2032
- Table 29: Global APAC Data Wrangling Industry Revenue Million Forecast, by Country 2019 & 2032
- Table 30: Global APAC Data Wrangling Industry Volume K Unit Forecast, by Country 2019 & 2032
- Table 31: APAC Data Wrangling Industry Revenue (Million) Forecast, by Application 2019 & 2032
- Table 32: APAC Data Wrangling Industry Volume (K Unit) Forecast, by Application 2019 & 2032
- Table 33: Global APAC Data Wrangling Industry Revenue Million Forecast, by Component 2019 & 2032
- Table 34: Global APAC Data Wrangling Industry Volume K Unit Forecast, by Component 2019 & 2032
- Table 35: Global APAC Data Wrangling Industry Revenue Million Forecast, by Deployment 2019 & 2032
- Table 36: Global APAC Data Wrangling Industry Volume K Unit Forecast, by Deployment 2019 & 2032
- Table 37: Global APAC Data Wrangling Industry Revenue Million Forecast, by Enterprise Type 2019 & 2032
- Table 38: Global APAC Data Wrangling Industry Volume K Unit Forecast, by Enterprise Type 2019 & 2032
- Table 39: Global APAC Data Wrangling Industry Revenue Million Forecast, by End-User Industry 2019 & 2032
- Table 40: Global APAC Data Wrangling Industry Volume K Unit Forecast, by End-User Industry 2019 & 2032
- Table 41: Global APAC Data Wrangling Industry Revenue Million Forecast, by Country 2019 & 2032
- Table 42: Global APAC Data Wrangling Industry Volume K Unit Forecast, by Country 2019 & 2032
- Table 43: United States APAC Data Wrangling Industry Revenue (Million) Forecast, by Application 2019 & 2032
- Table 44: United States APAC Data Wrangling Industry Volume (K Unit) Forecast, by Application 2019 & 2032
- Table 45: Canada APAC Data Wrangling Industry Revenue (Million) Forecast, by Application 2019 & 2032
- Table 46: Canada APAC Data Wrangling Industry Volume (K Unit) Forecast, by Application 2019 & 2032
- Table 47: Mexico APAC Data Wrangling Industry Revenue (Million) Forecast, by Application 2019 & 2032
- Table 48: Mexico APAC Data Wrangling Industry Volume (K Unit) Forecast, by Application 2019 & 2032
- Table 49: Global APAC Data Wrangling Industry Revenue Million Forecast, by Component 2019 & 2032
- Table 50: Global APAC Data Wrangling Industry Volume K Unit Forecast, by Component 2019 & 2032
- Table 51: Global APAC Data Wrangling Industry Revenue Million Forecast, by Deployment 2019 & 2032
- Table 52: Global APAC Data Wrangling Industry Volume K Unit Forecast, by Deployment 2019 & 2032
- Table 53: Global APAC Data Wrangling Industry Revenue Million Forecast, by Enterprise Type 2019 & 2032
- Table 54: Global APAC Data Wrangling Industry Volume K Unit Forecast, by Enterprise Type 2019 & 2032
- Table 55: Global APAC Data Wrangling Industry Revenue Million Forecast, by End-User Industry 2019 & 2032
- Table 56: Global APAC Data Wrangling Industry Volume K Unit Forecast, by End-User Industry 2019 & 2032
- Table 57: Global APAC Data Wrangling Industry Revenue Million Forecast, by Country 2019 & 2032
- Table 58: Global APAC Data Wrangling Industry Volume K Unit Forecast, by Country 2019 & 2032
- Table 59: Brazil APAC Data Wrangling Industry Revenue (Million) Forecast, by Application 2019 & 2032
- Table 60: Brazil APAC Data Wrangling Industry Volume (K Unit) Forecast, by Application 2019 & 2032
- Table 61: Argentina APAC Data Wrangling Industry Revenue (Million) Forecast, by Application 2019 & 2032
- Table 62: Argentina APAC Data Wrangling Industry Volume (K Unit) Forecast, by Application 2019 & 2032
- Table 63: Rest of South America APAC Data Wrangling Industry Revenue (Million) Forecast, by Application 2019 & 2032
- Table 64: Rest of South America APAC Data Wrangling Industry Volume (K Unit) Forecast, by Application 2019 & 2032
- Table 65: Global APAC Data Wrangling Industry Revenue Million Forecast, by Component 2019 & 2032
- Table 66: Global APAC Data Wrangling Industry Volume K Unit Forecast, by Component 2019 & 2032
- Table 67: Global APAC Data Wrangling Industry Revenue Million Forecast, by Deployment 2019 & 2032
- Table 68: Global APAC Data Wrangling Industry Volume K Unit Forecast, by Deployment 2019 & 2032
- Table 69: Global APAC Data Wrangling Industry Revenue Million Forecast, by Enterprise Type 2019 & 2032
- Table 70: Global APAC Data Wrangling Industry Volume K Unit Forecast, by Enterprise Type 2019 & 2032
- Table 71: Global APAC Data Wrangling Industry Revenue Million Forecast, by End-User Industry 2019 & 2032
- Table 72: Global APAC Data Wrangling Industry Volume K Unit Forecast, by End-User Industry 2019 & 2032
- Table 73: Global APAC Data Wrangling Industry Revenue Million Forecast, by Country 2019 & 2032
- Table 74: Global APAC Data Wrangling Industry Volume K Unit Forecast, by Country 2019 & 2032
- Table 75: United Kingdom APAC Data Wrangling Industry Revenue (Million) Forecast, by Application 2019 & 2032
- Table 76: United Kingdom APAC Data Wrangling Industry Volume (K Unit) Forecast, by Application 2019 & 2032
- Table 77: Germany APAC Data Wrangling Industry Revenue (Million) Forecast, by Application 2019 & 2032
- Table 78: Germany APAC Data Wrangling Industry Volume (K Unit) Forecast, by Application 2019 & 2032
- Table 79: France APAC Data Wrangling Industry Revenue (Million) Forecast, by Application 2019 & 2032
- Table 80: France APAC Data Wrangling Industry Volume (K Unit) Forecast, by Application 2019 & 2032
- Table 81: Italy APAC Data Wrangling Industry Revenue (Million) Forecast, by Application 2019 & 2032
- Table 82: Italy APAC Data Wrangling Industry Volume (K Unit) Forecast, by Application 2019 & 2032
- Table 83: Spain APAC Data Wrangling Industry Revenue (Million) Forecast, by Application 2019 & 2032
- Table 84: Spain APAC Data Wrangling Industry Volume (K Unit) Forecast, by Application 2019 & 2032
- Table 85: Russia APAC Data Wrangling Industry Revenue (Million) Forecast, by Application 2019 & 2032
- Table 86: Russia APAC Data Wrangling Industry Volume (K Unit) Forecast, by Application 2019 & 2032
- Table 87: Benelux APAC Data Wrangling Industry Revenue (Million) Forecast, by Application 2019 & 2032
- Table 88: Benelux APAC Data Wrangling Industry Volume (K Unit) Forecast, by Application 2019 & 2032
- Table 89: Nordics APAC Data Wrangling Industry Revenue (Million) Forecast, by Application 2019 & 2032
- Table 90: Nordics APAC Data Wrangling Industry Volume (K Unit) Forecast, by Application 2019 & 2032
- Table 91: Rest of Europe APAC Data Wrangling Industry Revenue (Million) Forecast, by Application 2019 & 2032
- Table 92: Rest of Europe APAC Data Wrangling Industry Volume (K Unit) Forecast, by Application 2019 & 2032
- Table 93: Global APAC Data Wrangling Industry Revenue Million Forecast, by Component 2019 & 2032
- Table 94: Global APAC Data Wrangling Industry Volume K Unit Forecast, by Component 2019 & 2032
- Table 95: Global APAC Data Wrangling Industry Revenue Million Forecast, by Deployment 2019 & 2032
- Table 96: Global APAC Data Wrangling Industry Volume K Unit Forecast, by Deployment 2019 & 2032
- Table 97: Global APAC Data Wrangling Industry Revenue Million Forecast, by Enterprise Type 2019 & 2032
- Table 98: Global APAC Data Wrangling Industry Volume K Unit Forecast, by Enterprise Type 2019 & 2032
- Table 99: Global APAC Data Wrangling Industry Revenue Million Forecast, by End-User Industry 2019 & 2032
- Table 100: Global APAC Data Wrangling Industry Volume K Unit Forecast, by End-User Industry 2019 & 2032
- Table 101: Global APAC Data Wrangling Industry Revenue Million Forecast, by Country 2019 & 2032
- Table 102: Global APAC Data Wrangling Industry Volume K Unit Forecast, by Country 2019 & 2032
- Table 103: Turkey APAC Data Wrangling Industry Revenue (Million) Forecast, by Application 2019 & 2032
- Table 104: Turkey APAC Data Wrangling Industry Volume (K Unit) Forecast, by Application 2019 & 2032
- Table 105: Israel APAC Data Wrangling Industry Revenue (Million) Forecast, by Application 2019 & 2032
- Table 106: Israel APAC Data Wrangling Industry Volume (K Unit) Forecast, by Application 2019 & 2032
- Table 107: GCC APAC Data Wrangling Industry Revenue (Million) Forecast, by Application 2019 & 2032
- Table 108: GCC APAC Data Wrangling Industry Volume (K Unit) Forecast, by Application 2019 & 2032
- Table 109: North Africa APAC Data Wrangling Industry Revenue (Million) Forecast, by Application 2019 & 2032
- Table 110: North Africa APAC Data Wrangling Industry Volume (K Unit) Forecast, by Application 2019 & 2032
- Table 111: South Africa APAC Data Wrangling Industry Revenue (Million) Forecast, by Application 2019 & 2032
- Table 112: South Africa APAC Data Wrangling Industry Volume (K Unit) Forecast, by Application 2019 & 2032
- Table 113: Rest of Middle East & Africa APAC Data Wrangling Industry Revenue (Million) Forecast, by Application 2019 & 2032
- Table 114: Rest of Middle East & Africa APAC Data Wrangling Industry Volume (K Unit) Forecast, by Application 2019 & 2032
- Table 115: Global APAC Data Wrangling Industry Revenue Million Forecast, by Component 2019 & 2032
- Table 116: Global APAC Data Wrangling Industry Volume K Unit Forecast, by Component 2019 & 2032
- Table 117: Global APAC Data Wrangling Industry Revenue Million Forecast, by Deployment 2019 & 2032
- Table 118: Global APAC Data Wrangling Industry Volume K Unit Forecast, by Deployment 2019 & 2032
- Table 119: Global APAC Data Wrangling Industry Revenue Million Forecast, by Enterprise Type 2019 & 2032
- Table 120: Global APAC Data Wrangling Industry Volume K Unit Forecast, by Enterprise Type 2019 & 2032
- Table 121: Global APAC Data Wrangling Industry Revenue Million Forecast, by End-User Industry 2019 & 2032
- Table 122: Global APAC Data Wrangling Industry Volume K Unit Forecast, by End-User Industry 2019 & 2032
- Table 123: Global APAC Data Wrangling Industry Revenue Million Forecast, by Country 2019 & 2032
- Table 124: Global APAC Data Wrangling Industry Volume K Unit Forecast, by Country 2019 & 2032
- Table 125: China APAC Data Wrangling Industry Revenue (Million) Forecast, by Application 2019 & 2032
- Table 126: China APAC Data Wrangling Industry Volume (K Unit) Forecast, by Application 2019 & 2032
- Table 127: India APAC Data Wrangling Industry Revenue (Million) Forecast, by Application 2019 & 2032
- Table 128: India APAC Data Wrangling Industry Volume (K Unit) Forecast, by Application 2019 & 2032
- Table 129: Japan APAC Data Wrangling Industry Revenue (Million) Forecast, by Application 2019 & 2032
- Table 130: Japan APAC Data Wrangling Industry Volume (K Unit) Forecast, by Application 2019 & 2032
- Table 131: South Korea APAC Data Wrangling Industry Revenue (Million) Forecast, by Application 2019 & 2032
- Table 132: South Korea APAC Data Wrangling Industry Volume (K Unit) Forecast, by Application 2019 & 2032
- Table 133: ASEAN APAC Data Wrangling Industry Revenue (Million) Forecast, by Application 2019 & 2032
- Table 134: ASEAN APAC Data Wrangling Industry Volume (K Unit) Forecast, by Application 2019 & 2032
- Table 135: Oceania APAC Data Wrangling Industry Revenue (Million) Forecast, by Application 2019 & 2032
- Table 136: Oceania APAC Data Wrangling Industry Volume (K Unit) Forecast, by Application 2019 & 2032
- Table 137: Rest of Asia Pacific APAC Data Wrangling Industry Revenue (Million) Forecast, by Application 2019 & 2032
- Table 138: Rest of Asia Pacific APAC Data Wrangling Industry Volume (K Unit) Forecast, by Application 2019 & 2032
Frequently Asked Questions
1. What is the projected Compound Annual Growth Rate (CAGR) of the APAC Data Wrangling Industry?
The projected CAGR is approximately 16.00%.
2. Which companies are prominent players in the APAC Data Wrangling Industry?
Key companies in the market include SAS Institute Inc, Altair Engineering Inc (Datawatch Corporation), TIBCO Software Inc, Teradata Corporation, Trifacta Software Inc, Paxata Inc , Alteryx Inc, Oracle Corporation, Talend Inc.
3. What are the main segments of the APAC Data Wrangling Industry?
The market segments include Component, Deployment, Enterprise Type, End-User Industry.
4. Can you provide details about the market size?
The market size is estimated to be USD XX Million as of 2022.
5. What are some drivers contributing to market growth?
Increasing Automation Trends in the Manufacturing Sector; Increased penetration of digitalization. coupled with growing demand for improved efficiency and reduced operating costs; Growing applications of RPA and AI.
6. What are the notable trends driving market growth?
Cloud is Expected to Witness Significant Growth.
7. Are there any restraints impacting market growth?
High initial cost of adoption; Lack of skilled personnel.
8. Can you provide examples of recent developments in the market?
N/A
9. What pricing options are available for accessing the report?
Pricing options include single-user, multi-user, and enterprise licenses priced at USD 4750, USD 4950, and USD 6800 respectively.
10. Is the market size provided in terms of value or volume?
The market size is provided in terms of value, measured in Million and volume, measured in K Unit.
11. Are there any specific market keywords associated with the report?
Yes, the market keyword associated with the report is "APAC Data Wrangling Industry," which aids in identifying and referencing the specific market segment covered.
12. How do I determine which pricing option suits my needs best?
The pricing options vary based on user requirements and access needs. Individual users may opt for single-user licenses, while businesses requiring broader access may choose multi-user or enterprise licenses for cost-effective access to the report.
13. Are there any additional resources or data provided in the APAC Data Wrangling Industry report?
While the report offers comprehensive insights, it's advisable to review the specific contents or supplementary materials provided to ascertain if additional resources or data are available.
14. How can I stay updated on further developments or reports in the APAC Data Wrangling Industry?
To stay informed about further developments, trends, and reports in the APAC Data Wrangling Industry, consider subscribing to industry newsletters, following relevant companies and organizations, or regularly checking reputable industry news sources and publications.
Methodology
Step 1 - Identification of Relevant Samples Size from Population Database


Step 2 - Approaches for Defining Global Market Size (Value, Volume* & Price*)

Note*: In applicable scenarios
Step 3 - Data Sources
Primary Research
- Web Analytics
- Survey Reports
- Research Institute
- Latest Research Reports
- Opinion Leaders
Secondary Research
- Annual Reports
- White Paper
- Latest Press Release
- Industry Association
- Paid Database
- Investor Presentations

Step 4 - Data Triangulation
Involves using different sources of information in order to increase the validity of a study
These sources are likely to be stakeholders in a program - participants, other researchers, program staff, other community members, and so on.
Then we put all data in single framework & apply various statistical tools to find out the dynamic on the market.
During the analysis stage, feedback from the stakeholder groups would be compared to determine areas of agreement as well as areas of divergence


