
Key Insights
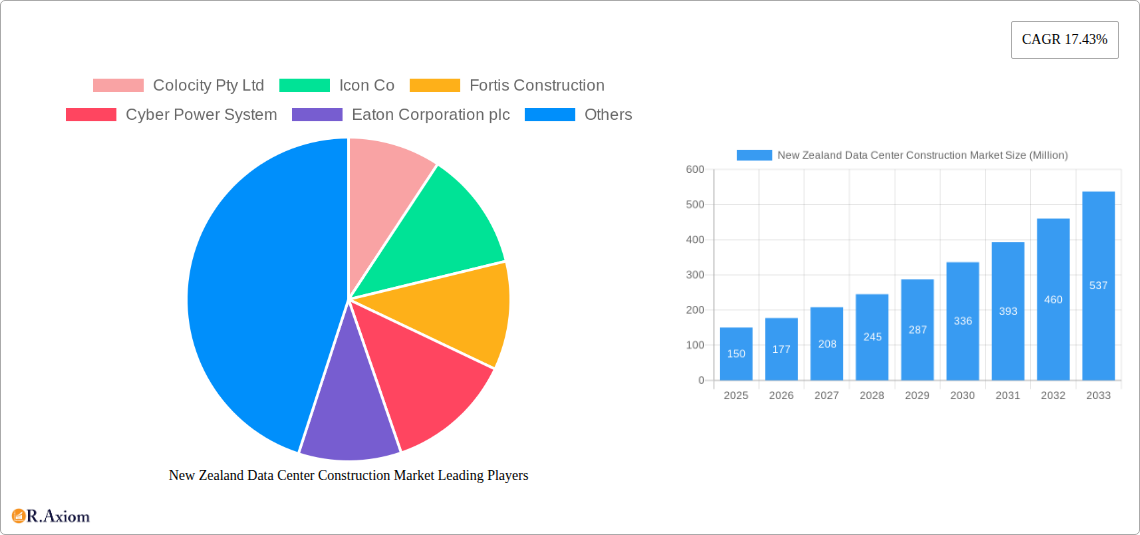
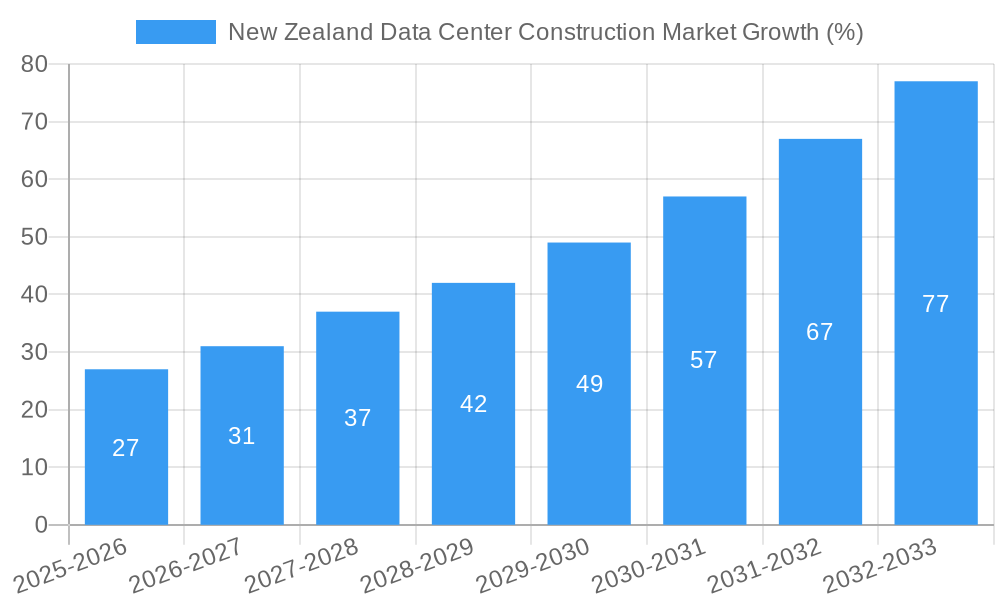
The New Zealand data center construction market exhibits robust growth, projected to reach a substantial value in the coming years. Driven by increasing digitalization, the burgeoning cloud computing sector, and the government's emphasis on digital infrastructure development, the market is experiencing significant expansion. The 17.43% CAGR indicates a strong upward trajectory, fueled primarily by the IT & Telecommunication sector's demand for advanced data storage and processing capabilities. Furthermore, growth is spurred by the expansion of BFSI (Banking, Financial Services, and Insurance) operations requiring high-security data centers and the increasing need for robust digital healthcare infrastructure. The market is segmented by tier type, end-user, infrastructure type, and data center size, allowing for a granular understanding of specific market needs and growth opportunities. Larger data centers (Medium, Large, Massive, Mega) are expected to dominate the market due to economies of scale and the need for high-capacity processing. While challenges may exist concerning land availability and energy consumption, these are mitigated by ongoing innovations in sustainable infrastructure and efficient cooling technologies. Key players like Colocity Pty Ltd, Schneider Electric SE, and others are actively contributing to market growth through their investments and technological advancements. The market's historical performance (2019-2024) provides a solid foundation for predicting future growth, with the forecast period (2025-2033) presenting significant opportunities for stakeholders.
The New Zealand data center construction market's growth is further supported by strategic government initiatives aiming to improve digital connectivity and create a robust digital economy. This includes investments in broadband infrastructure and supportive regulatory frameworks. While the "Other End User" segment currently contributes a smaller share, its growth potential is significant due to the increasing digitization across various sectors. The construction of data centers also considers sustainability and environmental impact, leading to the adoption of energy-efficient technologies and green building practices. This focus on sustainability is driving demand for innovative cooling solutions and renewable energy sources. The competitive landscape is characterized by a mix of both international and local companies, fostering innovation and healthy market dynamics. The market's regional concentration within New Zealand offers opportunities for focused market penetration strategies. Continued investment in infrastructure and technological advancement should further stimulate market growth throughout the forecast period.
New Zealand Data Center Construction Market: A Comprehensive Report (2019-2033)
This in-depth report provides a comprehensive analysis of the New Zealand data center construction market, offering invaluable insights for stakeholders including investors, vendors, and government agencies. The report covers the period 2019-2033, with a focus on the base year 2025 and forecast period 2025-2033. Key segments analyzed include Tier type, end-user, infrastructure type, and data center size. Leading companies such as Colocity Pty Ltd, Icon Co, Fortis Construction, and others are profiled, providing a detailed understanding of the competitive landscape. The report also incorporates recent industry developments and provides a strategic outlook for future growth.
New Zealand Data Center Construction Market Concentration & Innovation
This section analyzes the market concentration, highlighting the market share of key players and exploring innovation drivers shaping the industry. The increasing demand for high-capacity data centers, driven by the growth of cloud computing and digital transformation, is a major factor. Regulatory frameworks, including those related to energy efficiency and data security, significantly impact market dynamics. The report also examines the role of mergers and acquisitions (M&A) activity, providing an overview of recent deals and their impact on market consolidation. The estimated total market value for 2025 is xx Million, with a projected CAGR of xx% during the forecast period.
- Market Concentration: The New Zealand data center construction market exhibits a moderately concentrated structure, with a few major players holding significant market share. Specific market share data for key players is detailed within the full report. The level of concentration is likely to evolve with further M&A activity.
- Innovation Drivers: Technological advancements in areas such as energy-efficient cooling systems (e.g., EcoCooling solutions) and advanced infrastructure management are key drivers. The adoption of sustainable practices and green data centers is also gaining momentum.
- Regulatory Landscape: Government regulations focusing on data sovereignty, security, and energy efficiency are impacting design and construction practices. The report provides a detailed overview of relevant regulations and their implications.
- Product Substitutes: While direct substitutes are limited, the market faces indirect competition from cloud services that potentially reduce the demand for on-premises data centers.
- M&A Activity: Recent M&A activity involving leading players such as Schneider Electric SE and Eaton Corporation plc (though not specifically in NZ, their global activity impacts the market) is analyzed, examining their impact on market competition and innovation. The total value of M&A deals in the analyzed period is estimated at xx Million.
New Zealand Data Center Construction Market Industry Trends & Insights
This section delves into the key industry trends driving the New Zealand data center construction market. The growth is fueled by increasing digitalization across various sectors, leading to heightened demand for reliable and secure data storage and processing capabilities. This includes the rise of cloud computing services, the expansion of the IT & Telecommunication sector, and government initiatives to support digital infrastructure development. The report also assesses the impact of technological disruptions such as the adoption of AI, IoT, and edge computing on the market. The projected CAGR for the market is xx%, indicating strong future growth potential. Market penetration of advanced technologies like AI-powered cooling solutions is also analyzed. Specific factors influencing consumer preference, such as data center location (due to factors like energy costs and seismic activity), are discussed. The competitive landscape is characterized by intense competition among construction firms and specialized vendors such as Arup, Aurecon, and AECOM.
Dominant Markets & Segments in New Zealand Data Center Construction Market
This section identifies the dominant segments within the New Zealand data center construction market. The analysis considers various factors like Tier type, end-user, infrastructure type, and data center size. Based on our analysis, the IT & Telecommunication sector is expected to represent the largest end-user segment.
- By Tier Type: Tier III data centers are expected to dominate due to their higher reliability and redundancy requirements.
- By End User: The IT & Telecommunication sector represents the largest end-user segment, followed by the BFSI and Government sectors. Key drivers for the IT & Telecommunication sector include the increasing adoption of cloud computing and the growth of digital services. The BFSI sector's expansion is driven by the need for robust data security and compliance, while Government initiatives promoting digital infrastructure development fuel growth in the public sector.
- By Infrastructure: Electrical infrastructure commands a significant market share due to its critical role in powering data centers.
- By DC Size: Medium and Large data centers are projected to hold a significant market share, driven by the demand for scalability and capacity expansion.
Detailed analysis of each segment, including projected growth and key drivers, is provided in the full report.
New Zealand Data Center Construction Market Product Developments
Recent product innovations focus on enhancing energy efficiency, improving reliability, and optimizing data center operations. This includes advancements in cooling technologies, power distribution systems (like those offered by Eaton Corporation plc and Schneider Electric SE), and modular data center designs. These innovations aim to meet the growing demands for sustainability and cost-effectiveness, ensuring market fit for a range of applications.
Report Scope & Segmentation Analysis
This report segments the New Zealand data center construction market by Tier type (Tier 1, Tier 2, Tier 3, Tier 4), end-user (IT & Telecommunication, BFSI, Government, Healthcare, Other End User), infrastructure (Electrical Infrastructure, Other Electrical Infrastructure, Mechanical Infrastructure, Other Mechanical Infrastructure, Other Infrastructure), and data center size (Small, Medium, Large, Massive, Mega). Each segment's growth projections, market sizes, and competitive dynamics are detailed within the report. The market size for each segment is projected to xx Million for 2025, with varying growth rates across segments.
Key Drivers of New Zealand Data Center Construction Market Growth
Several factors are driving the growth of the New Zealand data center construction market:
- Increasing Digitalization: The widespread adoption of cloud computing and digital services across various industries is increasing the demand for data center capacity.
- Government Initiatives: Government investment in digital infrastructure and initiatives to support the growth of the technology sector are creating favorable conditions for the data center market. The USD 188 Million Auckland data center project exemplifies this.
- Economic Growth: Sustained economic growth in New Zealand provides a positive environment for investment in data center infrastructure.
Challenges in the New Zealand Data Center Construction Market Sector
The market faces certain challenges:
- High Construction Costs: The cost of land, labor, and materials in New Zealand can be relatively high, impacting project feasibility.
- Limited Skilled Labor: A shortage of skilled labor in the construction and technology sectors could hinder project timelines and increase costs.
- Regulatory Hurdles: Navigating the regulatory landscape can be complex and time-consuming, potentially delaying project approvals.
Emerging Opportunities in New Zealand Data Center Construction Market
Significant opportunities exist:
- Growth of Edge Computing: The increasing adoption of edge computing presents opportunities for specialized data center construction near the point of data generation.
- Sustainability Focus: Growing demand for sustainable and environmentally friendly data centers creates opportunities for green building technologies.
- Hyperscale Data Centers: The potential for establishing large-scale hyperscale data centers in New Zealand presents considerable market potential.
Leading Players in the New Zealand Data Center Construction Market Market
- Colocity Pty Ltd
- Icon Co
- Fortis Construction
- Cyber Power System
- Eaton Corporation plc (Eaton Corporation plc)
- EcoCooling
- Schneider Electric SE (Schneider Electric SE)
- Arista Networks (Arista Networks)
- Arup (Arup)
- Aurecon (Aurecon)
- Airedale International Air Conditioning
- AECOM (AECOM)
- Cisco System (Cisco System)
- Iris Global
- Dell Technologies (Dell Technologies)
Key Developments in New Zealand Data Center Construction Market Industry
- April 2023: The government of New Zealand announced the building of a data center worth USD 188 Million in its Auckland air force base, with completion expected by 2025. This significant investment will stimulate market growth and create opportunities for vendors.
- March 2022: T4 Group announced the construction of a tier 4 data center in New Zealand's south island, with an estimated cost of USD 34.6 Million and an IT load capacity of over 11 MW. Completion is expected by 2024.
Strategic Outlook for New Zealand Data Center Construction Market Market
The New Zealand data center construction market is poised for significant growth over the forecast period, driven by increasing digitalization, government initiatives, and economic expansion. The focus on sustainability and the emergence of new technologies like edge computing will further shape market dynamics. Opportunities exist for companies that can offer innovative solutions, efficient construction practices, and a commitment to sustainability. The market is expected to continue to consolidate, with larger players acquiring smaller firms to expand their market share.
New Zealand Data Center Construction Market Segmentation
-
1. Infrastructure
-
1.1. Market Segmentation - By Electrical Infrastructure
-
1.1.1. Power Distribution Solution
- 1.1.1.1. PDU - Basic & Smart - Metered & Switched solutions
-
1.1.1.2. Transfer Switches
- 1.1.1.2.1. Static
- 1.1.1.2.2. Automatic (ATS)
-
1.1.1.3. Switchgear
- 1.1.1.3.1. Low-Voltage
- 1.1.1.3.2. Medium-Voltage
- 1.1.1.4. Power Panels and Components
- 1.1.1.5. Others
-
1.1.2. Power Back up Solutions
- 1.1.2.1. UPS
- 1.1.2.2. Generators
- 1.1.3. Service
-
1.1.1. Power Distribution Solution
-
1.2. Market Segmentation - By Mechanical Infrastructure
-
1.2.1. Cooling Systems
- 1.2.1.1. Immersion Cooling
- 1.2.1.2. Direct-To-Chip Cooling
- 1.2.1.3. Rear Door Heat Exchanger
- 1.2.1.4. In-Row and In-Rack Cooling
- 1.2.2. Racks
- 1.2.3. Other Mechanical Infrastructure
-
1.2.1. Cooling Systems
- 1.3. General Construction
-
1.1. Market Segmentation - By Electrical Infrastructure
-
2. Electrical Infrastructure
-
2.1. Power Distribution Solution
- 2.1.1. PDU - Basic & Smart - Metered & Switched solutions
-
2.1.2. Transfer Switches
- 2.1.2.1. Static
- 2.1.2.2. Automatic (ATS)
-
2.1.3. Switchgear
- 2.1.3.1. Low-Voltage
- 2.1.3.2. Medium-Voltage
- 2.1.4. Power Panels and Components
- 2.1.5. Others
-
2.2. Power Back up Solutions
- 2.2.1. UPS
- 2.2.2. Generators
- 2.3. Service
-
2.1. Power Distribution Solution
-
3. Power Distribution Solution
- 3.1. PDU - Basic & Smart - Metered & Switched solutions
-
3.2. Transfer Switches
- 3.2.1. Static
- 3.2.2. Automatic (ATS)
-
3.3. Switchgear
- 3.3.1. Low-Voltage
- 3.3.2. Medium-Voltage
- 3.4. Power Panels and Components
- 3.5. Others
-
4. Power Back up Solutions
- 4.1. UPS
- 4.2. Generators
- 5. Service
-
6. Mechanical Infrastructure
-
6.1. Cooling Systems
- 6.1.1. Immersion Cooling
- 6.1.2. Direct-To-Chip Cooling
- 6.1.3. Rear Door Heat Exchanger
- 6.1.4. In-Row and In-Rack Cooling
- 6.2. Racks
- 6.3. Other Mechanical Infrastructure
-
6.1. Cooling Systems
-
7. Cooling Systems
- 7.1. Immersion Cooling
- 7.2. Direct-To-Chip Cooling
- 7.3. Rear Door Heat Exchanger
- 7.4. In-Row and In-Rack Cooling
- 8. Racks
- 9. Other Mechanical Infrastructure
- 10. General Construction
-
11. Tier Type
- 11.1. Tier-I and II
- 11.2. Tier-III
- 11.3. Tier-IV
- 12. Tier-I and II
- 13. Tier-III
- 14. Tier-IV
-
15. End User
- 15.1. Banking, Financial Services, and Insurance
- 15.2. IT and Telecommunications
- 15.3. Government and Defense
- 15.4. Healthcare
- 15.5. Other End Users
- 16. Banking, Financial Services, and Insurance
- 17. IT and Telecommunications
- 18. Government and Defense
- 19. Healthcare
- 20. Other End Users
New Zealand Data Center Construction Market Segmentation By Geography
- 1. New Zealand
New Zealand Data Center Construction Market REPORT HIGHLIGHTS
| Aspects | Details |
|---|---|
| Study Period | 2019-2033 |
| Base Year | 2024 |
| Estimated Year | 2025 |
| Forecast Period | 2025-2033 |
| Historical Period | 2019-2024 |
| Growth Rate | CAGR of 17.43% from 2019-2033 |
| Segmentation |
|
Table of Contents
- 1. Introduction
- 1.1. Research Scope
- 1.2. Market Segmentation
- 1.3. Research Methodology
- 1.4. Definitions and Assumptions
- 2. Executive Summary
- 2.1. Introduction
- 3. Market Dynamics
- 3.1. Introduction
- 3.2. Market Drivers
- 3.2.1. 9.1 Increasing Rate of Data Traffic9.2 Adoption of Colocation Services For Cost Effective Solution9.3 Thriving Digital Transformations Fueling Data Center Demand
- 3.3. Market Restrains
- 3.3.1. 10.1 Limitations on Data Security Features
- 3.4. Market Trends
- 3.4.1. Tier 3 is the Largest Tier Type
- 4. Market Factor Analysis
- 4.1. Porters Five Forces
- 4.2. Supply/Value Chain
- 4.3. PESTEL analysis
- 4.4. Market Entropy
- 4.5. Patent/Trademark Analysis
- 5. New Zealand Data Center Construction Market Analysis, Insights and Forecast, 2019-2031
- 5.1. Market Analysis, Insights and Forecast - by Infrastructure
- 5.1.1. Market Segmentation - By Electrical Infrastructure
- 5.1.1.1. Power Distribution Solution
- 5.1.1.1.1. PDU - Basic & Smart - Metered & Switched solutions
- 5.1.1.1.2. Transfer Switches
- 5.1.1.1.2.1. Static
- 5.1.1.1.2.2. Automatic (ATS)
- 5.1.1.1.3. Switchgear
- 5.1.1.1.3.1. Low-Voltage
- 5.1.1.1.3.2. Medium-Voltage
- 5.1.1.1.4. Power Panels and Components
- 5.1.1.1.5. Others
- 5.1.1.2. Power Back up Solutions
- 5.1.1.2.1. UPS
- 5.1.1.2.2. Generators
- 5.1.1.3. Service
- 5.1.1.1. Power Distribution Solution
- 5.1.2. Market Segmentation - By Mechanical Infrastructure
- 5.1.2.1. Cooling Systems
- 5.1.2.1.1. Immersion Cooling
- 5.1.2.1.2. Direct-To-Chip Cooling
- 5.1.2.1.3. Rear Door Heat Exchanger
- 5.1.2.1.4. In-Row and In-Rack Cooling
- 5.1.2.2. Racks
- 5.1.2.3. Other Mechanical Infrastructure
- 5.1.2.1. Cooling Systems
- 5.1.3. General Construction
- 5.1.1. Market Segmentation - By Electrical Infrastructure
- 5.2. Market Analysis, Insights and Forecast - by Electrical Infrastructure
- 5.2.1. Power Distribution Solution
- 5.2.1.1. PDU - Basic & Smart - Metered & Switched solutions
- 5.2.1.2. Transfer Switches
- 5.2.1.2.1. Static
- 5.2.1.2.2. Automatic (ATS)
- 5.2.1.3. Switchgear
- 5.2.1.3.1. Low-Voltage
- 5.2.1.3.2. Medium-Voltage
- 5.2.1.4. Power Panels and Components
- 5.2.1.5. Others
- 5.2.2. Power Back up Solutions
- 5.2.2.1. UPS
- 5.2.2.2. Generators
- 5.2.3. Service
- 5.2.1. Power Distribution Solution
- 5.3. Market Analysis, Insights and Forecast - by Power Distribution Solution
- 5.3.1. PDU - Basic & Smart - Metered & Switched solutions
- 5.3.2. Transfer Switches
- 5.3.2.1. Static
- 5.3.2.2. Automatic (ATS)
- 5.3.3. Switchgear
- 5.3.3.1. Low-Voltage
- 5.3.3.2. Medium-Voltage
- 5.3.4. Power Panels and Components
- 5.3.5. Others
- 5.4. Market Analysis, Insights and Forecast - by Power Back up Solutions
- 5.4.1. UPS
- 5.4.2. Generators
- 5.5. Market Analysis, Insights and Forecast - by Service
- 5.6. Market Analysis, Insights and Forecast - by Mechanical Infrastructure
- 5.6.1. Cooling Systems
- 5.6.1.1. Immersion Cooling
- 5.6.1.2. Direct-To-Chip Cooling
- 5.6.1.3. Rear Door Heat Exchanger
- 5.6.1.4. In-Row and In-Rack Cooling
- 5.6.2. Racks
- 5.6.3. Other Mechanical Infrastructure
- 5.6.1. Cooling Systems
- 5.7. Market Analysis, Insights and Forecast - by Cooling Systems
- 5.7.1. Immersion Cooling
- 5.7.2. Direct-To-Chip Cooling
- 5.7.3. Rear Door Heat Exchanger
- 5.7.4. In-Row and In-Rack Cooling
- 5.8. Market Analysis, Insights and Forecast - by Racks
- 5.9. Market Analysis, Insights and Forecast - by Other Mechanical Infrastructure
- 5.10. Market Analysis, Insights and Forecast - by General Construction
- 5.11. Market Analysis, Insights and Forecast - by Tier Type
- 5.11.1. Tier-I and II
- 5.11.2. Tier-III
- 5.11.3. Tier-IV
- 5.12. Market Analysis, Insights and Forecast - by Tier-I and II
- 5.13. Market Analysis, Insights and Forecast - by Tier-III
- 5.14. Market Analysis, Insights and Forecast - by Tier-IV
- 5.15. Market Analysis, Insights and Forecast - by End User
- 5.15.1. Banking, Financial Services, and Insurance
- 5.15.2. IT and Telecommunications
- 5.15.3. Government and Defense
- 5.15.4. Healthcare
- 5.15.5. Other End Users
- 5.16. Market Analysis, Insights and Forecast - by Banking, Financial Services, and Insurance
- 5.17. Market Analysis, Insights and Forecast - by IT and Telecommunications
- 5.18. Market Analysis, Insights and Forecast - by Government and Defense
- 5.19. Market Analysis, Insights and Forecast - by Healthcare
- 5.20. Market Analysis, Insights and Forecast - by Other End Users
- 5.21. Market Analysis, Insights and Forecast - by Region
- 5.21.1. New Zealand
- 5.1. Market Analysis, Insights and Forecast - by Infrastructure
- 6. Competitive Analysis
- 6.1. Market Share Analysis 2024
- 6.2. Company Profiles
- 6.2.1 Colocity Pty Ltd
- 6.2.1.1. Overview
- 6.2.1.2. Products
- 6.2.1.3. SWOT Analysis
- 6.2.1.4. Recent Developments
- 6.2.1.5. Financials (Based on Availability)
- 6.2.2 Icon Co
- 6.2.2.1. Overview
- 6.2.2.2. Products
- 6.2.2.3. SWOT Analysis
- 6.2.2.4. Recent Developments
- 6.2.2.5. Financials (Based on Availability)
- 6.2.3 Fortis Construction
- 6.2.3.1. Overview
- 6.2.3.2. Products
- 6.2.3.3. SWOT Analysis
- 6.2.3.4. Recent Developments
- 6.2.3.5. Financials (Based on Availability)
- 6.2.4 Cyber Power System
- 6.2.4.1. Overview
- 6.2.4.2. Products
- 6.2.4.3. SWOT Analysis
- 6.2.4.4. Recent Developments
- 6.2.4.5. Financials (Based on Availability)
- 6.2.5 Eaton Corporation plc
- 6.2.5.1. Overview
- 6.2.5.2. Products
- 6.2.5.3. SWOT Analysis
- 6.2.5.4. Recent Developments
- 6.2.5.5. Financials (Based on Availability)
- 6.2.6 EcoCooling
- 6.2.6.1. Overview
- 6.2.6.2. Products
- 6.2.6.3. SWOT Analysis
- 6.2.6.4. Recent Developments
- 6.2.6.5. Financials (Based on Availability)
- 6.2.7 Schneider Electric SE
- 6.2.7.1. Overview
- 6.2.7.2. Products
- 6.2.7.3. SWOT Analysis
- 6.2.7.4. Recent Developments
- 6.2.7.5. Financials (Based on Availability)
- 6.2.8 Arista Networks
- 6.2.8.1. Overview
- 6.2.8.2. Products
- 6.2.8.3. SWOT Analysis
- 6.2.8.4. Recent Developments
- 6.2.8.5. Financials (Based on Availability)
- 6.2.9 Arup
- 6.2.9.1. Overview
- 6.2.9.2. Products
- 6.2.9.3. SWOT Analysis
- 6.2.9.4. Recent Developments
- 6.2.9.5. Financials (Based on Availability)
- 6.2.10 Aurecon
- 6.2.10.1. Overview
- 6.2.10.2. Products
- 6.2.10.3. SWOT Analysis
- 6.2.10.4. Recent Developments
- 6.2.10.5. Financials (Based on Availability)
- 6.2.11 Airedale International Air Conditioning
- 6.2.11.1. Overview
- 6.2.11.2. Products
- 6.2.11.3. SWOT Analysis
- 6.2.11.4. Recent Developments
- 6.2.11.5. Financials (Based on Availability)
- 6.2.12 AECOM
- 6.2.12.1. Overview
- 6.2.12.2. Products
- 6.2.12.3. SWOT Analysis
- 6.2.12.4. Recent Developments
- 6.2.12.5. Financials (Based on Availability)
- 6.2.13 Cisco System
- 6.2.13.1. Overview
- 6.2.13.2. Products
- 6.2.13.3. SWOT Analysis
- 6.2.13.4. Recent Developments
- 6.2.13.5. Financials (Based on Availability)
- 6.2.14 Iris Global
- 6.2.14.1. Overview
- 6.2.14.2. Products
- 6.2.14.3. SWOT Analysis
- 6.2.14.4. Recent Developments
- 6.2.14.5. Financials (Based on Availability)
- 6.2.15 Dell Technologies
- 6.2.15.1. Overview
- 6.2.15.2. Products
- 6.2.15.3. SWOT Analysis
- 6.2.15.4. Recent Developments
- 6.2.15.5. Financials (Based on Availability)
- 6.2.1 Colocity Pty Ltd
List of Figures
- Figure 1: New Zealand Data Center Construction Market Revenue Breakdown (Million, %) by Product 2024 & 2032
- Figure 2: New Zealand Data Center Construction Market Share (%) by Company 2024
List of Tables
- Table 1: New Zealand Data Center Construction Market Revenue Million Forecast, by Region 2019 & 2032
- Table 2: New Zealand Data Center Construction Market Revenue Million Forecast, by Infrastructure 2019 & 2032
- Table 3: New Zealand Data Center Construction Market Revenue Million Forecast, by Electrical Infrastructure 2019 & 2032
- Table 4: New Zealand Data Center Construction Market Revenue Million Forecast, by Power Distribution Solution 2019 & 2032
- Table 5: New Zealand Data Center Construction Market Revenue Million Forecast, by Power Back up Solutions 2019 & 2032
- Table 6: New Zealand Data Center Construction Market Revenue Million Forecast, by Service 2019 & 2032
- Table 7: New Zealand Data Center Construction Market Revenue Million Forecast, by Mechanical Infrastructure 2019 & 2032
- Table 8: New Zealand Data Center Construction Market Revenue Million Forecast, by Cooling Systems 2019 & 2032
- Table 9: New Zealand Data Center Construction Market Revenue Million Forecast, by Racks 2019 & 2032
- Table 10: New Zealand Data Center Construction Market Revenue Million Forecast, by Other Mechanical Infrastructure 2019 & 2032
- Table 11: New Zealand Data Center Construction Market Revenue Million Forecast, by General Construction 2019 & 2032
- Table 12: New Zealand Data Center Construction Market Revenue Million Forecast, by Tier Type 2019 & 2032
- Table 13: New Zealand Data Center Construction Market Revenue Million Forecast, by Tier-I and II 2019 & 2032
- Table 14: New Zealand Data Center Construction Market Revenue Million Forecast, by Tier-III 2019 & 2032
- Table 15: New Zealand Data Center Construction Market Revenue Million Forecast, by Tier-IV 2019 & 2032
- Table 16: New Zealand Data Center Construction Market Revenue Million Forecast, by End User 2019 & 2032
- Table 17: New Zealand Data Center Construction Market Revenue Million Forecast, by Banking, Financial Services, and Insurance 2019 & 2032
- Table 18: New Zealand Data Center Construction Market Revenue Million Forecast, by IT and Telecommunications 2019 & 2032
- Table 19: New Zealand Data Center Construction Market Revenue Million Forecast, by Government and Defense 2019 & 2032
- Table 20: New Zealand Data Center Construction Market Revenue Million Forecast, by Healthcare 2019 & 2032
- Table 21: New Zealand Data Center Construction Market Revenue Million Forecast, by Other End Users 2019 & 2032
- Table 22: New Zealand Data Center Construction Market Revenue Million Forecast, by Region 2019 & 2032
- Table 23: New Zealand Data Center Construction Market Revenue Million Forecast, by Country 2019 & 2032
- Table 24: New Zealand Data Center Construction Market Revenue Million Forecast, by Infrastructure 2019 & 2032
- Table 25: New Zealand Data Center Construction Market Revenue Million Forecast, by Electrical Infrastructure 2019 & 2032
- Table 26: New Zealand Data Center Construction Market Revenue Million Forecast, by Power Distribution Solution 2019 & 2032
- Table 27: New Zealand Data Center Construction Market Revenue Million Forecast, by Power Back up Solutions 2019 & 2032
- Table 28: New Zealand Data Center Construction Market Revenue Million Forecast, by Service 2019 & 2032
- Table 29: New Zealand Data Center Construction Market Revenue Million Forecast, by Mechanical Infrastructure 2019 & 2032
- Table 30: New Zealand Data Center Construction Market Revenue Million Forecast, by Cooling Systems 2019 & 2032
- Table 31: New Zealand Data Center Construction Market Revenue Million Forecast, by Racks 2019 & 2032
- Table 32: New Zealand Data Center Construction Market Revenue Million Forecast, by Other Mechanical Infrastructure 2019 & 2032
- Table 33: New Zealand Data Center Construction Market Revenue Million Forecast, by General Construction 2019 & 2032
- Table 34: New Zealand Data Center Construction Market Revenue Million Forecast, by Tier Type 2019 & 2032
- Table 35: New Zealand Data Center Construction Market Revenue Million Forecast, by Tier-I and II 2019 & 2032
- Table 36: New Zealand Data Center Construction Market Revenue Million Forecast, by Tier-III 2019 & 2032
- Table 37: New Zealand Data Center Construction Market Revenue Million Forecast, by Tier-IV 2019 & 2032
- Table 38: New Zealand Data Center Construction Market Revenue Million Forecast, by End User 2019 & 2032
- Table 39: New Zealand Data Center Construction Market Revenue Million Forecast, by Banking, Financial Services, and Insurance 2019 & 2032
- Table 40: New Zealand Data Center Construction Market Revenue Million Forecast, by IT and Telecommunications 2019 & 2032
- Table 41: New Zealand Data Center Construction Market Revenue Million Forecast, by Government and Defense 2019 & 2032
- Table 42: New Zealand Data Center Construction Market Revenue Million Forecast, by Healthcare 2019 & 2032
- Table 43: New Zealand Data Center Construction Market Revenue Million Forecast, by Other End Users 2019 & 2032
- Table 44: New Zealand Data Center Construction Market Revenue Million Forecast, by Country 2019 & 2032
Frequently Asked Questions
1. What is the projected Compound Annual Growth Rate (CAGR) of the New Zealand Data Center Construction Market?
The projected CAGR is approximately 17.43%.
2. Which companies are prominent players in the New Zealand Data Center Construction Market?
Key companies in the market include Colocity Pty Ltd, Icon Co, Fortis Construction, Cyber Power System, Eaton Corporation plc, EcoCooling, Schneider Electric SE, Arista Networks, Arup, Aurecon, Airedale International Air Conditioning, AECOM, Cisco System, Iris Global, Dell Technologies.
3. What are the main segments of the New Zealand Data Center Construction Market?
The market segments include Infrastructure, Electrical Infrastructure, Power Distribution Solution, Power Back up Solutions, Service , Mechanical Infrastructure, Cooling Systems, Racks, Other Mechanical Infrastructure, General Construction, Tier Type, Tier-I and II, Tier-III, Tier-IV, End User, Banking, Financial Services, and Insurance, IT and Telecommunications, Government and Defense, Healthcare, Other End Users.
4. Can you provide details about the market size?
The market size is estimated to be USD XX Million as of 2022.
5. What are some drivers contributing to market growth?
9.1 Increasing Rate of Data Traffic9.2 Adoption of Colocation Services For Cost Effective Solution9.3 Thriving Digital Transformations Fueling Data Center Demand.
6. What are the notable trends driving market growth?
Tier 3 is the Largest Tier Type.
7. Are there any restraints impacting market growth?
10.1 Limitations on Data Security Features.
8. Can you provide examples of recent developments in the market?
April 2023: The government of New Zealand announced the building of a data center worth USD 188 million in its Auckland air force base and is expecting to complete construction by 2025. Such initiatives are expected to provide more opportunities for the vendors studied in the market.
9. What pricing options are available for accessing the report?
Pricing options include single-user, multi-user, and enterprise licenses priced at USD 3800, USD 4500, and USD 5800 respectively.
10. Is the market size provided in terms of value or volume?
The market size is provided in terms of value, measured in Million.
11. Are there any specific market keywords associated with the report?
Yes, the market keyword associated with the report is "New Zealand Data Center Construction Market," which aids in identifying and referencing the specific market segment covered.
12. How do I determine which pricing option suits my needs best?
The pricing options vary based on user requirements and access needs. Individual users may opt for single-user licenses, while businesses requiring broader access may choose multi-user or enterprise licenses for cost-effective access to the report.
13. Are there any additional resources or data provided in the New Zealand Data Center Construction Market report?
While the report offers comprehensive insights, it's advisable to review the specific contents or supplementary materials provided to ascertain if additional resources or data are available.
14. How can I stay updated on further developments or reports in the New Zealand Data Center Construction Market?
To stay informed about further developments, trends, and reports in the New Zealand Data Center Construction Market, consider subscribing to industry newsletters, following relevant companies and organizations, or regularly checking reputable industry news sources and publications.
Methodology
Step 1 - Identification of Relevant Samples Size from Population Database


Step 2 - Approaches for Defining Global Market Size (Value, Volume* & Price*)

Note*: In applicable scenarios
Step 3 - Data Sources
Primary Research
- Web Analytics
- Survey Reports
- Research Institute
- Latest Research Reports
- Opinion Leaders
Secondary Research
- Annual Reports
- White Paper
- Latest Press Release
- Industry Association
- Paid Database
- Investor Presentations

Step 4 - Data Triangulation
Involves using different sources of information in order to increase the validity of a study
These sources are likely to be stakeholders in a program - participants, other researchers, program staff, other community members, and so on.
Then we put all data in single framework & apply various statistical tools to find out the dynamic on the market.
During the analysis stage, feedback from the stakeholder groups would be compared to determine areas of agreement as well as areas of divergence


